XRP – Bullish Flag Pattern Suggests Further Upside PotentialTechnical Overview:
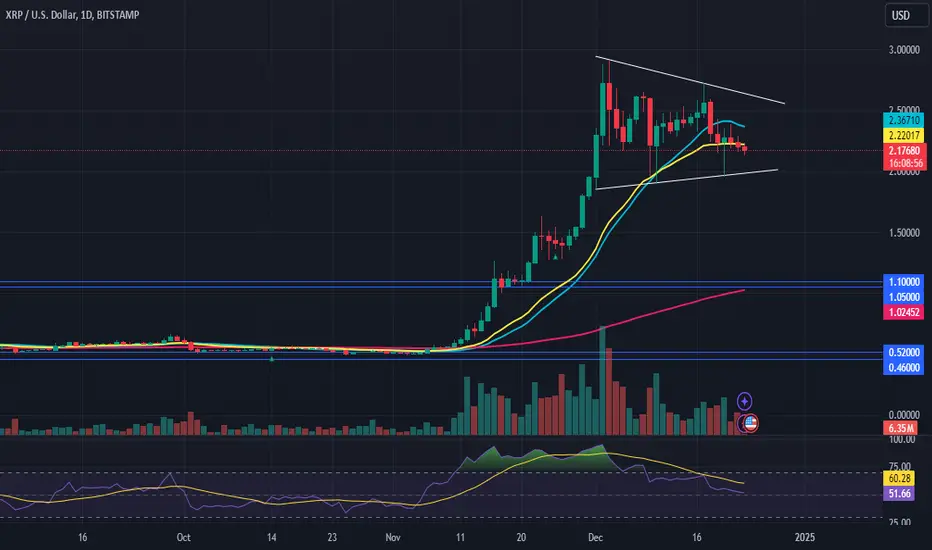
Bullish Flag Formation: XRP is consolidating within a bullish flag pattern, typically indicative of a continuation of its prior uptrend.
Previous Rally: After surging from $0.60 to nearly $2.80, XRP has demonstrated strength by consistently holding support above $2.40, signaling accumulation rather than distribution.
Key Levels to Watch:
Breakout Point: A breakout above the flag's upper trendline, accompanied by increased volume, could confirm the bullish setup.
Targets:
Initial target: $3.00-$3.20, aligning with measured moves from the flag pattern.
Longer-term potential: Continuation above $3.20 could open doors to further price discovery.
Supporting Factors:
Long-Term Base: XRP’s breakout earlier in 2024 from a long-term base adds strength to the current bullish setup.
Volume Confirmation: Increased trading volume during the breakout would validate buyer interest and bolster the bullish case.
Risk Management:
Key Support: Maintaining support above $2.40 is critical for the bullish thesis. A breakdown below this level could signal invalidation of the pattern.
Conclusion: XRP's bullish flag pattern indicates potential continuation of its prior uptrend. A breakout above the flag's trendline with volume confirmation could set sights on $3.00-$3.20 and beyond, reinforcing Ripple’s strong bullish potential heading into 2024.
Crypto-trading
Trading opportunity for OMUSDTBased on technical factors there is a Sell position in :
📊 OMUSDT
🔴 Sell Now
🪫Stop loss 4.71
🔋Target 1 3.01
🔋Target 2 2.44
🔋Target 3 1.75
💸RISK : 1%
We hope it is profitable for you ❤️
Please support our activity with your likes👍 and comments📝

Trading opportunity for BGBUSDTBased on technical factors there is a Sell position in :
📊 BGBUSDT
🔴 Sell Now
🪫Stop loss 4.7000
🔋Target 1 3.4000
🔋Target 2 3.0000
🔋Target 3 2.5000
💸RISK : 1%
We hope it is profitable for you ❤️
Please support our activity with your likes👍 and comments📝

Trading opportunity for GALAUSDTBased on technical factors there is a Buy position in :
📊 GALAUSDT
🔵 Buy Now
🪫Stop loss 0.04300
🔋Target 1 0.05830
🔋Target 2 0.06868
🔋Target 3 0.08888
💸RISK : 1%
We hope it is profitable for you ❤️
Please support our activity with your likes👍 and comments📝

Ethereum (ETH) – Bullish Outlook for 2025Technical Outlook:
Bullish Trend: Ethereum has confirmed a bullish trend across all time frames, indicating strength and continued upward momentum.
Resistance Zones: A breakout above the $4,100-$4,200 zone, forming part of a saucer pattern, could trigger a rally toward the $5,400-$5,600 region. This marks a key resistance level, and clearing it could set Ethereum on a path to new highs.
Long-Term Target: With the $8,000 target in sight for 2025, Ethereum holds substantial upside potential, especially if it continues to maintain bullish momentum in the short term.
Support Levels:
$3,300-$3,500: As long as Ethereum holds support above this range, the bullish momentum remains intact, with potential for further price appreciation.
Key Takeaways:
Bullish Setup: Ethereum's bullish trend is solidifying, and as long as it stays above critical support levels, the outlook remains positive.
Next Target: A breakout above $4,100-$4,200 could signal the start of a significant rally toward $5,400-$5,600, with the potential for even higher levels in 2025.
Long-Term Optimism: Ethereum is poised for strong gains in 2025, with an $8,000 target potentially within reach.
Conclusion: Ethereum's technical setup suggests a strong bullish continuation heading into 2025, with a focus on $4,100-$4,200 as a key breakout point for a rally toward new highs. Holding support above $3,300-$3,500 remains crucial for the bullish outlook.

BRIEFING Week #50: Buckle Up, The FED is ComingHere's your weekly update ! Brought to you each weekend with years of track-record history..
Don't forget to hit the like/follow button if you feel like this post deserves it ;)
That's the best way to support me and help pushing this content to other users.
Kindly,
Phil

THE RETURN OF CTXC/USDTCTXC USDT seems to be an interesting view.
We will follow the data to see if it's able to show new targets.

Market Dominance Analysis–Bullish for Altcoins, Caution AdvisedKey Observations:
Dominance Rejection: The market dominance faced a strong rejection after reaching the 58% level, aligning with key resistance at the 7 and 21-day EMAs. This suggests a bullish signal for altcoins, as the dominance pullback indicates a potential shift in momentum away from Bitcoin.
Bullish Shift for Altcoins: Altcoins are positioned to benefit from this shift, especially if dominance continues to weaken. The key support for dominance lies around the 200-day EMA, and if dominance closes this week below this level, further bullish potential for altcoins could unfold.
Key Levels to Monitor:
Resistance for Dominance: Should dominance attempt to rise again, watch for potential resistance at 54.5% and 53% levels. These could act as key turning points, marking possible take-profit (TP) zones for altcoins as dominance struggles to break higher.
Strategy for Altcoins:
Cautious Optimism: While the rejection of dominance is a bullish signal, altcoins should remain cautious of dips into the danger zones around 54.5% and 53% dominance, which could pose resistance.
Target Zones: The shift in momentum suggests potential for continued altcoin strength, with dominance weakening if the candle close remains under the 200-day EMA.
Conclusion: The recent rejection of dominance is a strong bullish sign for altcoins, but traders should keep a close eye on the danger zones around the 54.5% and 53% dominance levels. If dominance fails to reclaim these areas, altcoins could continue to see further gains.

BTC Long: 200D SMA Bull Regime & RSI SignalsWe are now trending in overbought territory across both Monthly, Weekly timeframes. However, there is still room to go... To measure RSI strength we are leveraging our powerful Adapted RSI indicator.
Whilst, the 200D SMA indicator helps traders identify market regimes using the powerful combination of 50 and 200 SMAs. It provides clear visual signals and detailed metrics for trend-following strategies.
Key Features:
- Dual SMA System (50/200) for regime identification
- Colour-coded candles for easy trend visualisation
- Metrics dashboard
Core Signals:
- Bullish Regime: Price > 200 SMA
- Bearish Regime: Price < 200 SMA
- Additional confirmation: 50 SMA Cross-over or Cross-under (golden cross or death cross)

Trading opportunity for XRUSDTBased on technical factors there is a Buy position in :
📊 XRUSDT
🔵 Buy Now
🪫Stop loss 0.2685
🔋Target 1 0.4363
🔋Target 2 0.5120
🔋Target 3 0.6390
💸RISK : 1%
We hope it is profitable for you ❤️
Please support our activity with your likes👍 and comments📝

Trading opportunity for EIGENUSDTBased on technical factors there is a Buy position in :
📊 EIGENUSDT
🔵 Buy Now or by Breakout
🪫Stop loss 3.900
🔋Target 1 5.950
🔋Target 2 7.500
🔋Target 3 9.900
💸RISK : 1%
We hope it is profitable for you ❤️
Please support our activity with your likes👍 and comments📝

Trading opportunity for JTOUSDTBased on technical factors there is a Buy position in :
📊 JTOUSDT
🔵 Buy Now or by Breakout
🪫Stop loss 3.375
🔋Target 1 4.400
🔋Target 2 5.100
🔋Target 3 6.280
💸RISK : 1%
We hope it is profitable for you ❤️
Please support our activity with your likes👍 and comments📝

BRIEFING Week #49 : Still nothing !Here's your weekly update ! Brought to you each weekend with years of track-record history..
Don't forget to hit the like/follow button if you feel like this post deserves it ;)
That's the best way to support me and help pushing this content to other users.
Kindly,
Phil

$LINK do pivots work on crypto ? Last few weeks, rejections and bounces off the fib pivots have been nearly dead on.
Is crypto now becoming futures?

Your not ready for MARAs next move! 118% Upside🚀 Hold on tight! MARA's Next Move is Coming! 🚀
Get ready for an explosive 118% upside! MARA is showing off a stunning Cup and Handle pattern that's about to break out any moment! And guess what? We've already broken out of a pristine Bull Flag!
Here's the breakdown:
- H5 Indicator: GREEN and ready for action!
- Volume Shelf Launch: With Free Roam Space above.
- WR%: Sitting comfortably in the Consolidation Box.
🚩 Bull Flag MM: $50
Cup and Handle MM: $65
This is Not Financial Advice (NFA), but don't say I didn't warn you—buckle up! 🚀

Trading opportunity for RENUSDTBased on technical factors there is a Buy position in :
📊 RENUSDT
🔵 Buy Now
🪫Stop loss 0.03940
🔋Target 1 0.11111
🔋Target 2 0.16000
🔋Target 3 0.25000
💸RISK : 1%
We hope it is profitable for you ❤️
Please support our activity with your likes👍 and comments📝

Trading opportunity for TELUSDTBased on technical factors there is a Buy position in :
📊 TELUSDT
🔵 Buy Now
🪫Stop loss 0.005925
🔋Target 1 0.009900
🔋Target 2 0.014000
🔋Target 3 0.019900
💸RISK : 1%
We hope it is profitable for you ❤️
Please support our activity with your likes👍 and comments📝

SAND/USDT 100% POSSIBLITY BREAKSAND/USDT Analysis: Potential Break Ahead
The SAND/USDT pair is showing an intriguing setup, which could be confirmed by a new break zone. We will closely monitor the market for any signs of confirmation regarding this coin's movement.
If this coin manages to rise from the current zone, it could initiate a new upward cycle.
The most promising scenario is a 100% increase which can go with time. However, it’s important to note that this may take time, as there are no guarantees in the crypto market. Additionally, much will depend on further data confirmations.
If SAND achieves a break soon the price could potentially target the $0.74–$0.82 range.
This coin has manny levels as open space which can have a break to old levels.

Trading opportunity for EIGENUSDTBased on technical factors there is a Buy position in :
📊 EIGENUSDT
🔵 Buy Now
🪫Stop loss 3.600
🔋Target 1 4.900
🔋Target 2 5.450
🔋Target 3 6.600
💸RISK : 1%
We hope it is profitable for you ❤️
Please support our activity with your likes👍 and comments📝

Trading opportunity for SATSUSDTBased on technical factors there is a Buy position in :
📊 SATSUSDT
🔵 Buy Now
🪫Stop loss 0.0002780
🔋Target 1 0.0004040
🔋Target 2 0.0005050
🔋Target 3 0.0006767
💸RISK : 1%
We hope it is profitable for you ❤️
Please support our activity with your likes👍 and comments📝

XRP/USDT: Local Correction or Springboard to $3?Hi there! 👋
Let’s dive into the XRP/USDT chart, which has been drawing attention with its strong bullish momentum but is now showing the first signs of a possible correction. Let’s break it down! 🧐
🖼 Overall Picture
The chart shows a clear uptrend, which has pushed XRP to a local high of $2.70. However, the market looks slightly overheated, and a correction to key support levels seems likely.
Globally, XRP remains in a bullish trend, supported by positive sentiment and broader crypto market growth.
📈 Technical Analysis (Using Midas Up/Down)
Key Support Levels:
1️⃣ $2.20–2.30 : Local support, a potential zone for entries during a pullback.
2️⃣ $1.80–2.00 : Major support zone, aligned with high volume levels (Volume Profile) and a strong trendline.
Resistance:
$2.60–2.70 : A local profit-taking zone. Price has already rejected this level twice.
$3.00 : The next major target if the current highs are broken.
🛠 What Indicators Say:
RSI (4H) : Still in overbought territory, signaling potential for a correction.
MACD (4H) : Shows slowing momentum as the histogram shrinks, indicating the market is preparing for a pullback.
MACD (1W) : Remains firmly bullish on the weekly timeframe, confirming the strength of the long-term trend.
🗺 Scenarios
1️⃣ Bullish Scenario:
Price holds the $2.20–2.30 support zone and returns to test $2.70.
A breakout above $2.70 opens the path to $3.00 and potentially $3.50.
2️⃣ Bearish Scenario:
Price breaks below $2.20 and tests the $1.80–2.00 support zone.
If this level holds, it presents an excellent low-risk entry point for buyers.
🎯 Trading Strategy
Short-Term (Swing Trading):
Entries:
1️⃣ Around $2.20–2.30 on a local pullback.
2️⃣ Safer entry: $1.80–2.00.
Targets:
1️⃣ $2.60–2.70 — for partial profit-taking.
2️⃣ $3.00 — main target.
Stop-Loss:
Aggressive: Below $2.10.
Conservative: Below $1.80.
Medium-Term:
Buy in the $1.80–2.00 range with the aim to hold until $3.00+.
⚠️ Risks
Breaking below $1.80 could accelerate a drop to $1.50.
The overall market is volatile, so keep an eye on broader trends and adjust positions accordingly.
🚀 Conclusion
XRP continues to delight bulls, but a local correction is likely. The $2.20–2.30 and $1.80–2.00 levels look like great zones for re-entry or scaling in. If the price breaks $2.70, the target of $3.00 becomes realistic. Stay sharp! 💪
💬 What do you think about this scenario? Got any ideas or feedback? Drop your thoughts in the comments, and let’s discuss! 👇
📊 Follow me for more updates and in-depth analysis! 😊

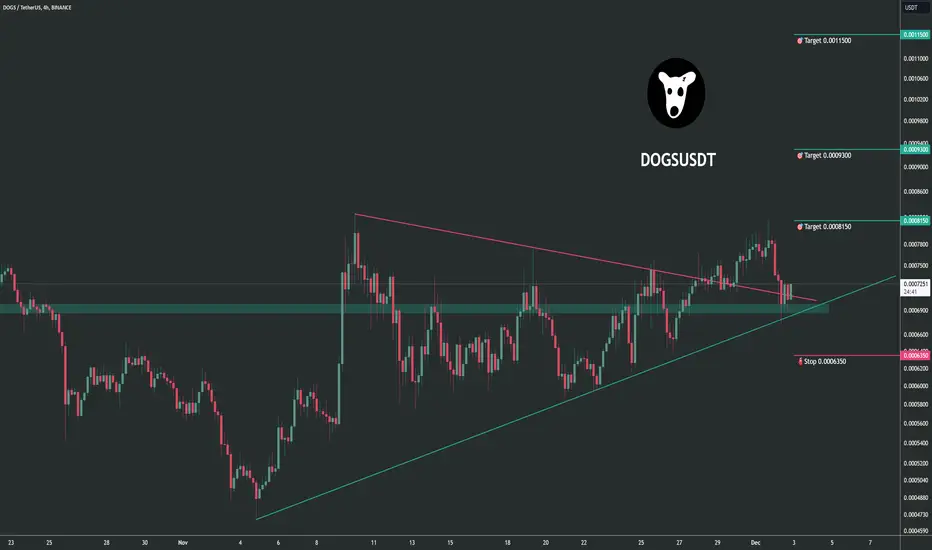
Trading opportunity for DOGSUSDTBased on technical factors there is a Buy position in :
📊 DOGSUSDT
🔵 Buy Now
🪫Stop loss 0.0006350
🔋Target 1 0.0008150
🔋Target 2 0.0009300
🔋Target 3 0.0011500
💸RISK : 1%
We hope it is profitable for you ❤️
Please support our activity with your likes👍 and comments📝
DOGE/USDT (1D Chart)
DOGE/USDT continues to display bullish market behavior, consolidating within a **rising wedge** formation as the price trends upward. The narrowing of the wedge indicates that the price is approaching a critical point for its next major move.
**Key Observations:**
1. **Price Action:**
- The price remains firmly above key moving averages (20, 50, and 200), signaling a continuation of the broader uptrend.
- The narrowing wedge reflects a buildup of tension, typical before a decisive breakout or breakdown.
2. **Volume and CMF Dynamics:**
- A **notable drop in volume** is visible as the price consolidates, which often signals a pending sharp move.
- The **Chaikin Money Flow (CMF)** indicates declining momentum, highlighting a reduction in buying strength and market participation at this stage.
3. **Momentum Indicators:**
- **OBV (On-Balance Volume):** Maintains an upward trend, indicating consistent accumulation despite the consolidation.
- **RSI:** At **70.95**, the slightly overbought reading suggests the possibility of temporary consolidation or a pullback before a potential continuation of the uptrend.
**Conclusion:**
DOGE/USDT is approaching a decisive moment as it consolidates within its rising wedge. The **drop in volume**, visible both on the chart and through the **CMF**, is a common precursor to significant price action. While momentum remains intact, traders should watch for increased activity that confirms the next move.
