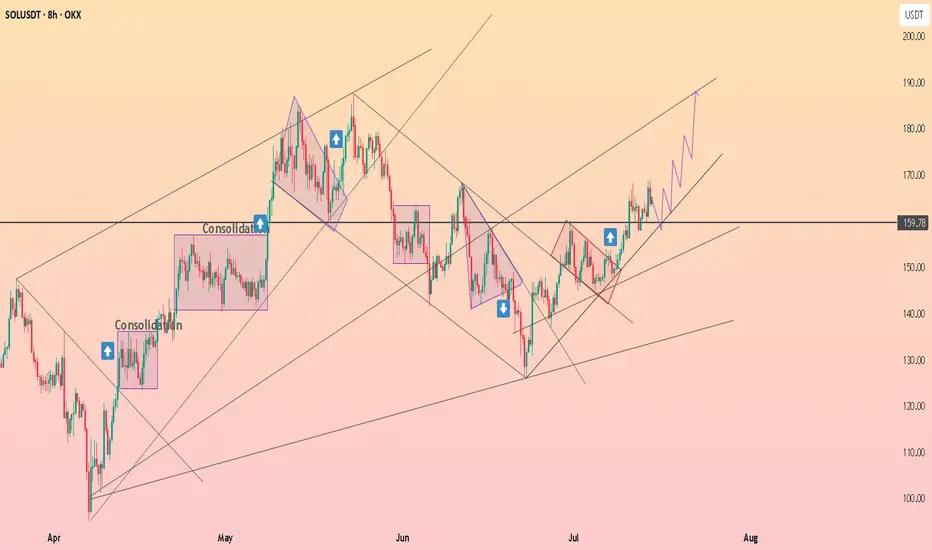
HolderStat┆SOLUSD above the $160 levelBINANCE:SOLUSDT has cleared key resistance at $159.78 after a series of consolidation patterns. The breakout has followed through into an ascending channel aiming at $185. Price remains structurally bullish with higher lows and strong recovery setups.
Crypto
HolderStat┆BNBUSD breakoutBINANCE:BNBUSDT has reclaimed $670 support after breaking out from a long-term falling wedge. The bounce has been strong, and the rising structure now targets the $735–$740 resistance zone. Price action confirms bullish intent with consolidation beneath resistance before breakout.

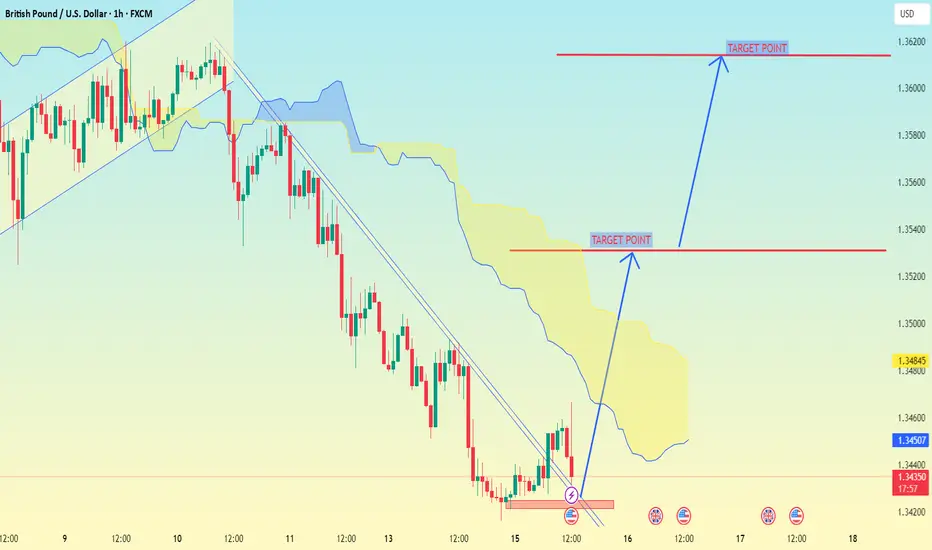
GBP/USD on the 1-hour timeframeGBP/USD on the 1-hour timeframe, here’s a breakdown of the target points indicated:
---
📍 Target Points (as marked on the chart):
1. First Target Point: Around 1.35200
2. Second Target Point: Around 1.36200
---
🧠 Analysis Notes (based on My setup):
Im used Ichimoku Cloud and a trendline breakout, which suggests a bullish reversal.
The price has broken out above a descending trendline and is possibly targeting the top of the cloud and further if momentum sustains.
The two target points represent:
First resistance level (likely top of the Ichimoku cloud).
Second resistance level (recent high before the downtrend began).
---
📌 Summary:
Immediate target: 1.35200
Next potential target: 1.36200
Let me know if you want stop-loss suggestions or a risk-reward analysis.
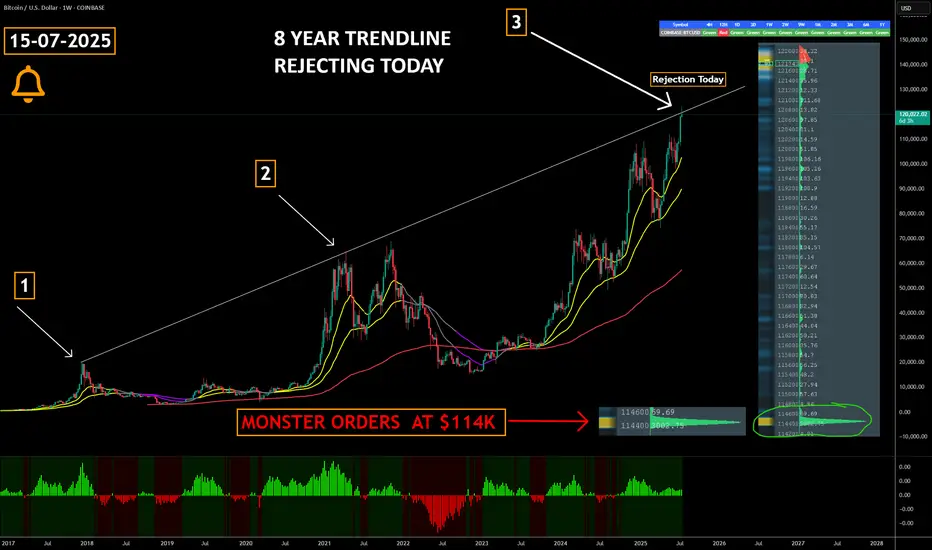
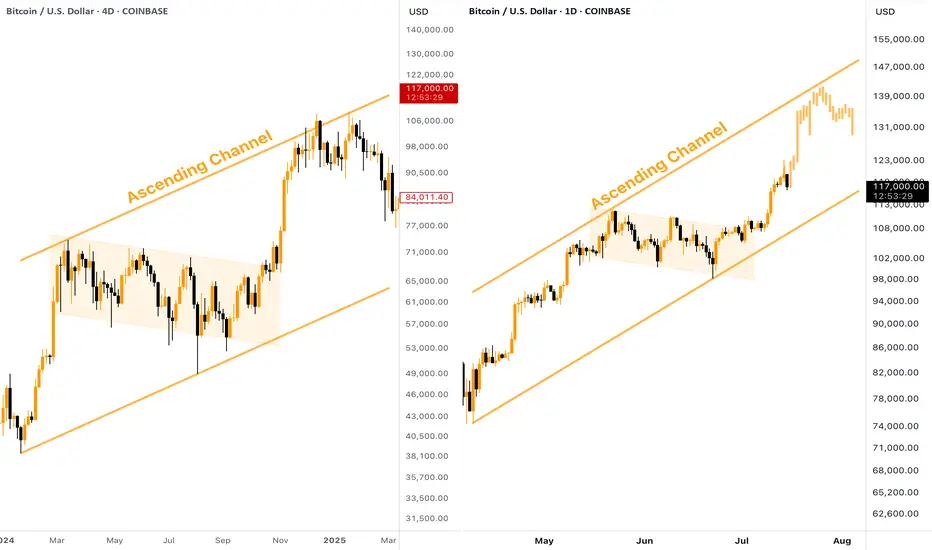
Did Bitcoin Just TOP OUT ??????
COINBASE:BTCUSD has just collided with an 8-year rising trendline that capped the market’s last two cyclical peaks—historically, this level has triggered multi-month corrections and Bear Markets.
Triple-test significance : a third touch of a long-term trendline ➜ heightened odds of a reaction; failure to break cleanly often confirms a major top.
Watch for confirmation signals —weekly bearish RSI divergence, waning volume, or rejection wicks can validate a reversal scenario.
Breakout = regime change : a decisive close and hold above the line flips it to support, opening the door to fresh price discovery and potential parabolic upside.
Large Orders at $114k create a visible demand wall in the order book, signalling that whales / institutions are ready to absorb a dip and accumulate at that level.
Risk-management alert : consider tightening stops, reducing leverage, or hedging until trendline fate is resolved.
The buy pressure has been relentless but this is always worth paying attention to
Marty Boots | 17-Year Trader — smash that , hit LIKE & SUBSCRIBE, and share your views in the comments below so we can make better trades & grow together!
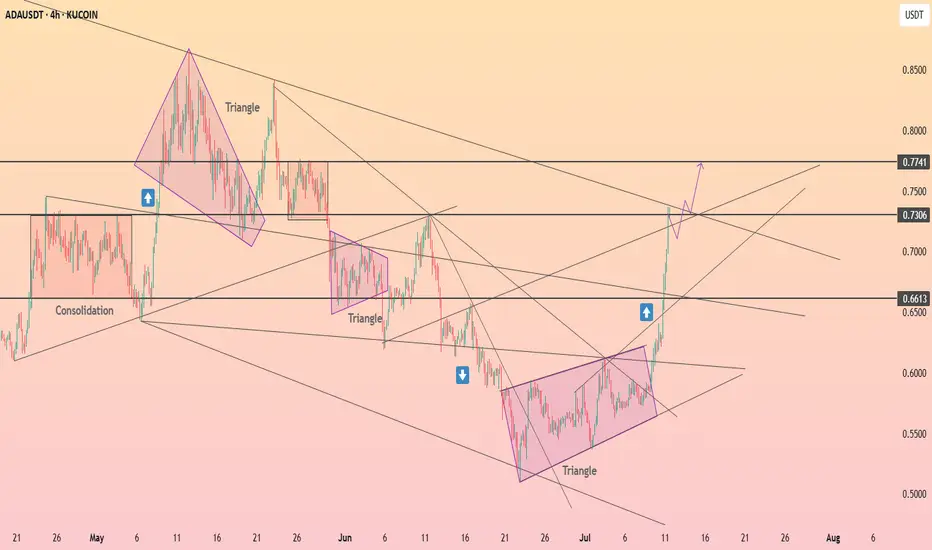
HolderStat┆ADAUSD seeks to $0.774KUCOIN:ADAUSDT recently broke out of a multi-week triangle formation on the 4H chart. The clean break above 0.66 has invalidated the previous downtrend and triggered a new leg higher. With ADA currently riding within an ascending channel, the path toward 0.73–0.75 remains open as momentum continues building.
[BITCOIN] - Where is Potential TOP (ATH) of the Bull Cycle?Many people wondering where is the potential TOP of the current Bitcoin Bull Run? Besides setting a Fibo Retracement, we can take a look at the past. The current situation on CRYPTOCAP:BTC chart reminds me of what we've seen in the end of 2024, here is why:
Big ascending channel, price perfectly moves inside without breaking borders
Descending consolidation inside the bull flag
Strong breakout and pump towards the resistance of the channel
👉 According to this pattern, the target for the current Bitcoin upward move should be located in the $140,000 zone. Keep this in mind when planning your trades.
$XRP All Tie High After Shallow Pullback?CRYPTOCAP:XRP had a fantastic week smashing all resistances. I am looking for a shallow pull back to test the High Volume Node support at $2.7 at the .236 Fibonacci retracement before continuing to challenge the all time high.
Wave (3) of a motif wave appears complete adding confluence to a shallow retracement for wave (4).
Daily RSI is extremely overbought.
Safe trading

$HBAR Weekly Pivot Time...In classic CRYPTOCAP:HBAR fashion what a powerful move this week! Moves like this leave me skeptical of continuation straight away as you often get a pretty decent pullback afterwards before the next leg up. However how many times have you seen a move like this that completely unwinds weeks later and goes lower?
Wave (3) looks truly underway after wave (2) tested the High Volume Node and 'Golden Pocket' 0.50.618 Fibonacci retracement as support on weekly bullish divergence from the RSI.
The weekly pivot is now resistance and it already proving itself. If price continues the all time high is next resistance and price has a weekly R5 pivot target of $1.2 while the Fibonacci extension targets have a minimum of $5.2..
Analysis is invalidated below $0.12
Safe trading

$FET Does Zooming out look better?NYSE:FET has been underperforming lately and the local chart looks trash so I wanted to zoom out to give us all some context on the larger picture which hasn't really changed.
Price appears to have completed wave II at the High Volume Node (HVN) support and 0.5- 0.618 'Golden Pocket' Fibonacci retracement and wave 3 is underway but finding local resistance.
Pivots are warped due to the strength of the move last year so wouldn't count them as reliable so focusing on support and resistance. The megaphone pattern is clear and the next area of resistance when FET starts moving is the $1.2
Weekly RSI is decreasing and is attempting to cross bearishly. If Bitcoin has a significant pullback I would expect new lows for FET at this rate. I have a neutral stance at this point.
Analysis is invalidated below $0.546
Safe trading

$ETH Pullback to $2630 Support?CRYPTOCAP:ETH has a great week pushing through resistance and making new local highs after testing the daily 200EMA and daily pivot as support.
Price is likely to retest the swing high and previous resistance as support around $2600-2700, also the .382 Fibonacci retracement.
RSI is printing daily bearish divergence in overbought from the wave (3) top to current as it did at the wave (5) top seeing large rejection. The retest of $2600 would reset RSI.
Price is ultimately set to test $3600 as the next resistance if the Elliot wave count is correct.
Analysis is invalidated below $2050
Safe trading

$AAVE Macro outlook Grinding the PathCRYPTOCAP:AAVE continues to grind higher poking above the swing high which was rejected to test the weekly pivot and .382 Fibonacci retracement as support successfully. This was a shallow wave 2 so I am expecting a big thrust up in wave 3. However, the alternative count could suggest a wave is only completing now with wave 2 actually being wave (4) of 1, this would be the case if price falls back below $171.
Weekly RSI is still bullish with plenty of room to rise ahead of it. It printed a weekly bullish divergence at the wave II low and major support high volume node.
AAVE is definitely one too watch this cycle.
Safe trading

SANDBOX RALLY..Since 2021, SAND has been quiet but now holds strong support at $0.22. I believe a rally to $2.70 is likely in the coming months.
(ITS NOT A FINANCIAL ADVISE)

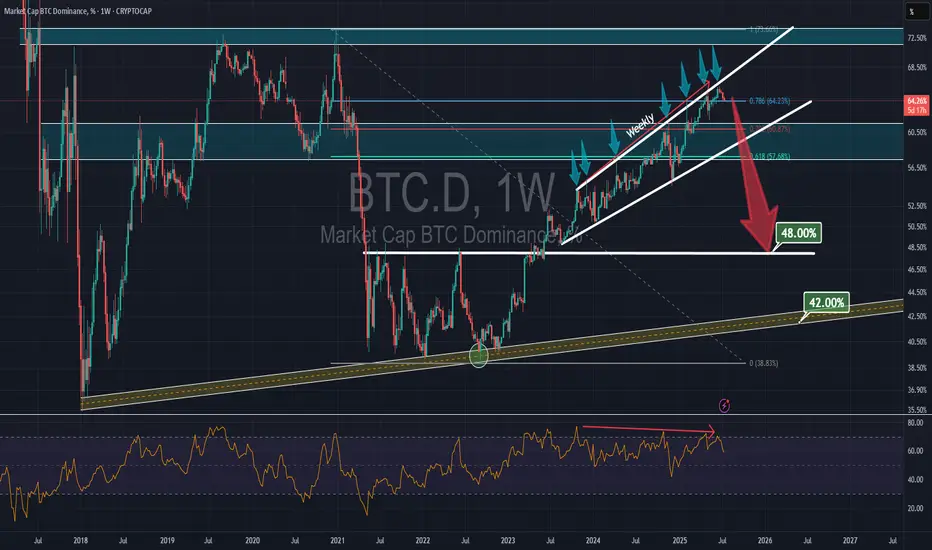
Bitcoin DOMINANCE dropssssBTC dominance has been within a rising channel since October 2023, showing a significant bearish divergence on the weekly RSI. After the seventh rejection from the channel's top, it may drop to the major support at 48%.
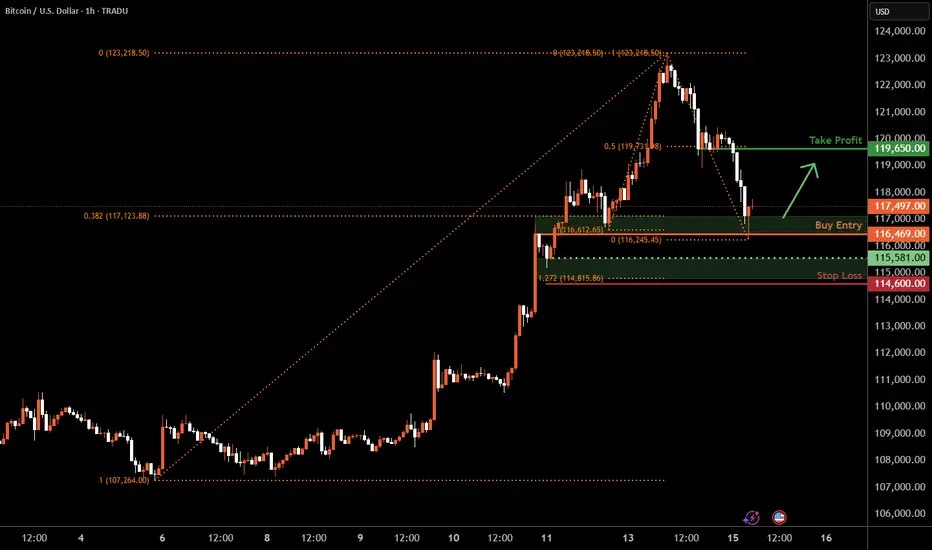
Bitcoin H1 | Potential bounce off a pullback supportBitcoin (BTC/USD) is falling towards a pullback support and could potentially bounce off this level to climb higher.
Buy entry is at 116,469.00 which is a pullback support that aligns closely with the 38.2% Fibonacci retracement.
Stop loss is at 114,600.00 which is a level that lies underneath a swing-low support and the 127.2% Fibonacci extension.
Take profit is at 119,650.00 which is a pullback resistance that aligns with the 50% Fibonacci retracement.
High Risk Investment Warning
Trading Forex/CFDs on margin carries a high level of risk and may not be suitable for all investors. Leverage can work against you.
Stratos Markets Limited (tradu.com ):
CFDs are complex instruments and come with a high risk of losing money rapidly due to leverage. 63% of retail investor accounts lose money when trading CFDs with this provider. You should consider whether you understand how CFDs work and whether you can afford to take the high risk of losing your money.
Stratos Europe Ltd (tradu.com ):
CFDs are complex instruments and come with a high risk of losing money rapidly due to leverage. 63% of retail investor accounts lose money when trading CFDs with this provider. You should consider whether you understand how CFDs work and whether you can afford to take the high risk of losing your money.
Stratos Global LLC (tradu.com ):
Losses can exceed deposits.
Please be advised that the information presented on TradingView is provided to Tradu (‘Company’, ‘we’) by a third-party provider (‘TFA Global Pte Ltd’). Please be reminded that you are solely responsible for the trading decisions on your account. There is a very high degree of risk involved in trading. Any information and/or content is intended entirely for research, educational and informational purposes only and does not constitute investment or consultation advice or investment strategy. The information is not tailored to the investment needs of any specific person and therefore does not involve a consideration of any of the investment objectives, financial situation or needs of any viewer that may receive it. Kindly also note that past performance is not a reliable indicator of future results. Actual results may differ materially from those anticipated in forward-looking or past performance statements. We assume no liability as to the accuracy or completeness of any of the information and/or content provided herein and the Company cannot be held responsible for any omission, mistake nor for any loss or damage including without limitation to any loss of profit which may arise from reliance on any information supplied by TFA Global Pte Ltd.
The speaker(s) is neither an employee, agent nor representative of Tradu and is therefore acting independently. The opinions given are their own, constitute general market commentary, and do not constitute the opinion or advice of Tradu or any form of personal or investment advice. Tradu neither endorses nor guarantees offerings of third-party speakers, nor is Tradu responsible for the content, veracity or opinions of third-party speakers, presenters or participants.
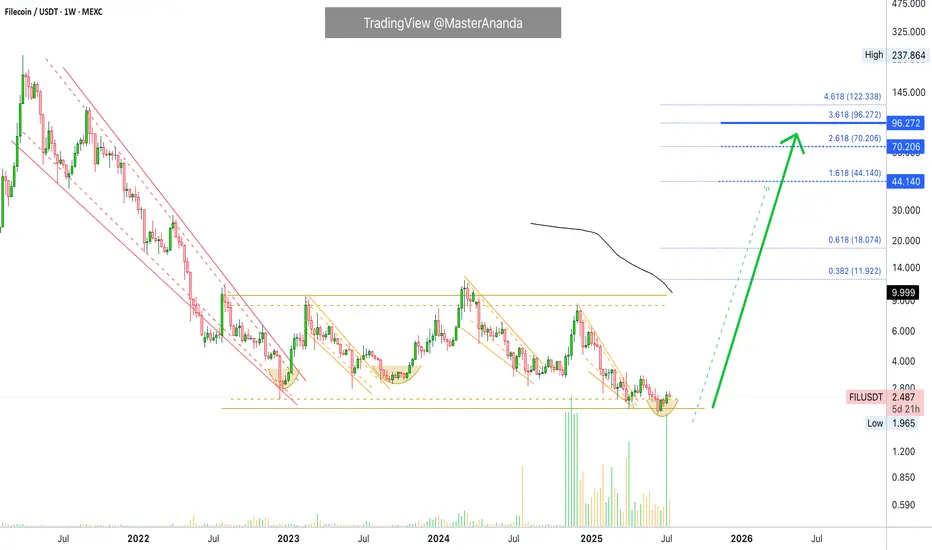
Filecoin Hits Bottom · 3 Years Long BD · Volume Signal · MACD &I think what is really nice about MEXC is that it truly reveals the bottom through volume. The changes in trading volume in this exchange are so pronounced that you can never go wrong. Look at Filecoin, extremely high volume in November 2024, right before a bullish wave. Then again, incredibly high volume last week, July 2025, right before a... Right before a major, major bullish wave, or else trading volume wouldn't be so high. It is this high because whales are buying with margin on this exchange.
Ok. A classic signal, 100% original. MA200 starts curving down strong; prices start to move up to meet this indicator, there will be a cross. So when MA200 starts diving deep down coming from a high point, the low is in, the bottom is in and the trend is about to change from bearish to bullish. Filecoin is about to start growing.
These are two signals, both very strong. Let's add another one. Bullish divergence with the MACD and RSI. Weekly, long-term. This makes these signals very, very strong.
FILUSDT weekly RSI hit bottom June 2022, in June 2025 (three years later) it produced a higher low.
FILUSDT weekly produced a major low December 2022, in June 2025 it produced a lower low. That's a strong divergence.
FILUSDT weekly MACD hit bottom February 2022. There is a extreme higher low in 2025 and also a bullish cross.
Needless to say, the bullish cross indicates the market is about to change. This matches the volume signal, the MA200 signal, marketwide action, the bullish divergence with the RSI, Ethereum and the rest.
Everything is bullish if you look deep enough. Bullish means potential for growth when prices are low. Bullish potential. That's what we are looking for. Filecoin is about to turn-up.
Namaste.
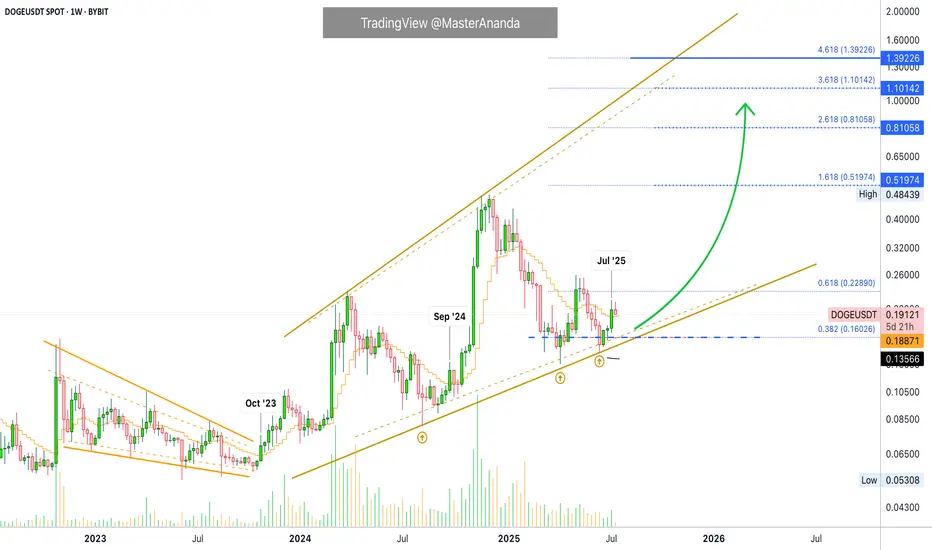
Dogecoin's Bullish Wave Over? Higher High Beyond $1.11111Nope, it is only getting started... Do you see that tiny speck of a black line on the chart? Way below the current candles around 0.135. That's MA200 weekly. Dogecoin is on the bullish zone 100% already confirmed. The bullish wave is only getting started.
DOGEUSDT is trading weekly above EMA13. Watch what happened in September 2024 when Dogecoin broke above this level. Or further back, October 2023. Both instances, there was a bullish impulse; both instances, a higher high.
Dogecoin moved and closed above EMA13 last week, July 2025. Guess what will happen next? A new bullish impulse and a strong higher high.
Patience is key, the market is set to continue growing long-term. No, the uptrend is not over, it is only getting started.
Thanks a lot for your continued support.
Namaste.
Ondo: The Bullish Wave is Over? 410% - 579% Profits PotentialONDOUSDT managed to produce three weeks closing green with the last one conquering EMA13. When this happened back in November 2024 there was a period of continued growth. Look at it in this way; the week is young and the market is taking a break, growth will resume in a matter of days. This same week more green and continued green long-term.
When ONDOUSDT broke above EMA13 last year, it produced a total of six weeks of straight up. Now, back then we were looking at a small jump, today we are looking at a very strong bullish impulse. The 2025 bull market in full force.
Three green weeks is only the start. We are about to experience 12-24 weeks of bullish action. We are looking at the bottom, bullish momentum is yet to grow. It is still early, but early won't be a reality for too long. Buy and hold.
We have two targets that are interesting: 410% and 579%. These can be hit within 3 to 6 months. Allow for retraces and swings on the way up.
Namaste.

Space and Time: Trading Strategy · 1 BTC = 2.5 BTC (PP: 150%)Are you interested in a double-up?
Let's use round numbers to keep it simple.
Trade: Buy 1 BTC STXUSDT = Get 2.5 BTC (150% profits).
Time duration: 20-40 days.
Risk: Very low (time).
The risk can be calculated in time. Since this is a spot trade, you cannot get liquidated. In the worst case scenario, you wait. This is the only risk if the chart breaks down. If it works as planned, you can get 150% profits (250% earnings) by selling on target.
Time duration is "short-term." Which is within 30 days. Here I set 20-40 days to allow for any unexpected variations.
The trade is any amount you want. $1,000 USDT bought at current price, say 0.0890, would result in $2,500 USDT if selling happens at 0.2229. This is just an example of course for illustration purposes.
The trick is to be ready to wait. If waiting is hard, one can be use diversification to be entertained. Say, $250 USDT on four different pairs that have good potential for growth. Can be $2,500 USDT by 4 if the capital is $10,000. Or $10,000 USDT by 10 if the capital is $100,000. There are many different ways to approach the market.
A different approach: $10,000 in. The market (pair in question) grows 25%. Close position (sell). Result = $12,500. Find new pair and repeat.
The stop-loss can be a tight one at 5%. If prices drop 5% close position. Result = $9,500. Try again with a different pair. The stop-loss can be set at 10%, 15%, 20%, based on the chart, etc.
There is also a trailing stop. Adjust the stop below a certain level as prices rise, after you catch the rising trend. This is a bit more advanced and it is mainly used by profitable traders.
Patience is key. If you can wait, you can win.
Space and Time (SXT) is set to grow. How you approach this market is up to you. Remember to do your own research and planning. This is not financial advice. I am sharing for learning and entertainment purposes only.
Thank you for reading.
Namaste.

XRP $6.5, $9.5, $12.5 & $15.5 · Which One?XRP broke a small local downtrend and managed to close above a small resistance zone around $2.76. It managed to do this on a full green candle with rising volume.
XRPUSDT weekly is currently trading above all moving averages, extremely bullish: MA200, EMA377, EMA233, EMA89 and the rest.
If we look at a bull market cycle as a series of three steps, we have the first two missing the last one. Compare current action with 2021 while noticing the 1,2,3 numbers on the chart. This leaves us wondering about the next target: How high can XRP go in its next bullish move?
It seems something extraordinary is brewing behind the scenes, I can feel it. What we've been saying all along but rather than just words, a new feeling came up. "It is not the same to live through an event vs talking about it." That kind of feeling.
I can continue to say that market conditions are extremely positive now especially when we compare it to several years ago. But we have not seen the effect this positive conditions will have on the market, the price of the different projects and the charts, but we are getting close.
XRP has big plans and continue to grow, expand and evolve.
The 2021 bull market from bottom to top produced more than 1,800%. In 2025, if we start counting from the July 2024 low, a target of $6.50 would mean a total of ~1,585% growth. Market conditions are better now so we can aim higher, expect more.
A target of $9.51 sounds great, this would mean a nice ~230% from current price and from the same low as before, a total of ~2,400%. This sounds better but we can do more.
The next two targets based on an extension of the current trend would lead to $12.5 and $15.5. I'll let you calculate the potential yourself.
$6.5, $9.51, $12.5 or more; whatever the market ends up giving us, we are happy to be part of this adventure and we are always grateful for the amazing results.
Aim high. I will be here reading the charts live when we are getting close to the top. There will be time to sell, time to adapt, time to decide. There will be enough time for everything if you start now. Prepare now and success is yours.
We are early for the last phase of the XRP 2025 bull market. The first half is in, we are due the second half; it will be great.
Namaste.

Can a Bear Market Start With Ethereum At $3,000?Ethereum produced sideways action for 49 days, 7 weeks. Immediately after seeing this I realized the next logical step was a bullish breakout, and the market moved up. But this isn't all. Ethereum is still trading at $3,000, more than $1,800 away from its all-time high.
Now, thinking about the doubt that always creeps up when the market becomes bullish confirmed, I want to clear things up if at least for you. While others can continue to doubt and will continue to do so, many others will even SHORT and lose everything, you will be happy knowing that the market will experience additional growth. You will also be making profits as the market grows. You will be happy because you know for a fact, based on data, that we are set to experience sustained long-term growth.
A bear market can only develop after a bull market. A bull market ends in a major high or new all-time high. Current conditions for ETHUSDT are far from being "peaky." There is no new all-time high. Actually, prices are still relatively low.
First Ethereum needs to challenge its previous all-time high, create a new one and then we can talk about a bear market or correction. We know for a fact that Ethereum is bullish based on recent price action and the chart. We know for a fact that Ethereum will grow because Bitcoin is already high up. Ethereum is the #2 Crypto and what Bitcoin does it tends to follow.
Bitcoin is super strong but this is not to be confused as weakness. Weakness comes when the market has been growing for too long, growth becomes heavy and a drop happens next. Strength happens when the market has been sideways for months, breaks up and produces a major advance (now). This type of pattern predicts additional growth.
Bitcoin is the king and what Bitcoin does the rest follows. You can expect additional growth.
The reason why the bullish cycle is not yet over is because prices are still too low. Many altcoins are trading near all-time lows. Think about it. A bear market develops from all-time highs and bull markets develop from all-time lows. We are only at the start of a major bullish cycle, phase and wave.
The proof is in the chart. A major low was hit 7-April 2025, the lowest since March 2023. This marks the end of the correction and the start of the 2025 bullish phase. I don't know if Ethereum will grow for years or only for a few months. I know with 100% certainty that the Cryptocurrency market will continue to grow. You can bet your house on it.
Thanks a lot for your continued support.
Namaste.

Altcoins Bull Market Confirmed —Fun TokenEvery time there is a strong rise immediately what follows is a correction, always, unless of course you are in a bull market. Here you have the most revealing signal of all: Price stability after a major rise, sideways rather than bearish.
Fun Token (FUNUSDT) produced a more than 340% bullish wave. What happens right after the peak? If you guessed a drop I don't blame you, that is what normally happens but here things are different. Since the market is growing and set to grow strong for long, after this major rise instead of a crash we have consolidation, sideways. This reveals that participants are not selling, they are not selling because they know the rise is not over, there will be additional growth.
Go back in time and look at 30-50 altcoins and see what happens after each strong bullish wave, a correction. Now, do the same but focus on a bull market; what happens after a strong bullish wave? Some consolidation followed by additional growth.
The altcoins bull market is already confirmed.
Thanks a lot for your continued support.
Namaste.

HolderStat┆AVAXUSD retest of trend lineBYBIT:AVAXUSDT has climbed steadily through a falling channel breakout and now trades firmly above $20.50. With triangle breakouts behind it, the next likely zone is $24–$25. Price action is aligning with bullish continuation patterns.

HolderStat┆HYPEUSD has consolidated above the trend line$OKX:HYPEUSDT surged after a breakout from a well-formed triangle and a bullish retest of prior resistance. The chart shows a textbook ascending channel with the price climbing from $38 toward the $56 upper range. If momentum remains, a breakout beyond the top boundary is likely.
