Trading Altcoins for Maximum Profits · StrategyIt is a tricky market. How are you going to trade the altcoins to maximize profits? What's your plan?
Everyday there is always some odd pair that grows 100%+, and we feel attracted to this kind of action. We want to be in and we want to hold those pairs. But, there are hundreds of choices on each exchange and only 1-2 pairs breakup this strongly every few days. Quietly, behind the scenes, everything grows but slowly.
Three months down the road the entire market will be 2-3 levels up, minimum. Some pairs will be up five levels and some even more.
If we fall for the trap of trying to catch the next big move, we can miss the real bullish action that is happening every day. I mean, it is better to buy and hold 5-10 strong good pairs rather than chasing around the dream of big wins. A dream that most often than not never comes.
If you look at 22-June or 7-April, it takes months for a bullish wave to develop. All across, marketwide, it happens step by step. Every day altcoins are growing 2-3%, 5-10%, over and over, again and again.
When we jump around trying to catch the next sudden jump, we miss the safe and secure sustained daily growth. When we finally make the right move and buy the pair that is breaking up strong, there is a 50% bullish breakout but somehow this isn't enough, we want more, more, more. 50%, 70% up and yet, we do not sell, we wait for more. But the entire bullish wave, regardless of how you slice it, takes a minimum of 3 months. Then comes a retrace, fast, or a strong correction, and we sell when prices are low. A strong rise at first and we might end up with just 20-30% gains. And in this way we end up wasting months and months.
Three months later, we do have some gains; it is a bull market after all, but total growth is nothing compared to holding a strong pair long-term. The strong pairs, most of them, end up growing 700%, 800%, 1,000%. When you look at your capital and you are moving around, you see only 100 or 200% total growth. What is happening here?
If you have 2-3 years of spot trading experience, then you can definitely choose 20 good pairs and sell the few that breakup weekly, hold the rest. Each time several pairs breakup strong, collect profits and find the ones trading low. But, if you have less than 2 years experience trading spot, you are better off buying low and holding long-term. You will end up with bigger profits in the end.
There are many ways to approach the market, make no mistake, but a plan is needed to maximize profits. I will continue to share my experience so you can avoid making the same mistake I made back in the days.
I've been trading Bitcoin since 2013, altcoins starting 2015; full time Cryptocurrency since 2017 through present day.
The market is a school and will you give tons of lessons, experience is needed for success. If experience is lacking, planing ahead of time will produce the best results.
To plan, just ask yourself the following questions:
1) How long am I willing to wait after buying a pair?
2) If prices rise, will I sell? If yes, when and by how much?
3) If prices drop, will I close the position at a loss? If no, how long are you willing to wait with a losing pair? If yes, when will you close? At -10%, -20%, -50%?
Answering these questions ahead of time can help you avoid anxiety and stress. The more you prepare, the more you read; higher profits.
Namaste.
Crypto

Kava: 5 Strong Bullish Signals, Cup & Handle, High Volume & MoreThe cup & handle pattern doesn't work at resistance. You cannot use this pattern in any meaningful way at the top of a rising trend. For the C&H to be valid, it needs to happen at the end of a downtrend, near the market bottom because this is a bullish reversal pattern.
Here we have KAVAUSDT weekly up-close. August 2024 marks the lowest prices since March 2020, in more than 3.5 years. Including this strong multiple years low, we have the cup pattern forming followed by the handle. See the chart:
This is the classic cup and handle (C&H) pattern and here it is valid and can work as a reversal signal.
One signal in isolation is never enough, it needs to be coupled with 3-4 additional signals to have a strong setup. The next signal comes from the trading volume. As KAVAUSDT reached the lowest in almost 4 years, trading volume goes through the roof; the highest buy-volume ever. This is another strong signal.
We have the reversal pattern, long-term double-bottom, increasing volume, local higher low (the handle low vs the cup low) and marketwide action (the rest of the altcoins market going bullish).
There you have five signals total all supporting a change of trend. This means that soon Kava will start to grow and you know this for certain because you have the supporting data coming from the chart.
Namaste.

ATH Mode On => Request Your Altcoin Analysis NowThe bulls are back in action, and momentum is building fast! ⚡
To celebrate this major milestone, I’m opening the floor to YOU 👇
Request any altcoin in the comments, and I’ll personally share my technical analysis on it! 📊✅
Let’s make the most of this market together — it’s altcoin season waiting to happen! 🚀
📚 Always follow your trading plan regarding entry, risk management, and trade management.
Good luck!
All Strategies Are Good; If Managed Properly!
~Richard Nasr

BTC & USDT.D => Bullish Correction Incoming?Hello TradingView Family / Fellow Traders. This is Richard, also known as theSignalyst.
Both BTC and USDT.D are sitting around key rejection zones.
💰 BTC is hovering near the $100,000 level — a major previous low and a psychological round number.
📊 Meanwhile, USDT.D is testing the 5% resistance — a supply zone and another critical round number.
As long as $100,000 holds as support on BTC and 5.1% holds as resistance on USDT.D, we could expect a bullish correction across the crypto market.
What do you think? Will these levels hold or break? 🤔
📚 Always follow your trading plan regarding entry, risk management, and trade management.
Good luck!
All Strategies Are Good; If Managed Properly!
~Rich

ETH Building Blocks - Keep it Simple🧱 Building Block - ETH Weekly Analysis 🧱
Ethereum has been trading within a well-defined structure, respecting key horizontal zones — each acting as a crucial building block in ETH’s macro journey.
🔹 Zone 1 ($1,700 - $2,100)
A strong demand and accumulation zone. ETH bounced from here multiple times, proving itself as the foundation of the current bullish attempt.
🔹 Zone 2 ($2,400 - $2,600)
We're currently hovering around this key mid-range resistance. A successful break above it would pave the way for the next major leg up.
🔹 Zone 3 ($2,900 - $3,400)
A major historical resistance turned supply area. ETH needs strong momentum and volume to break through this ceiling.
🔹 Zone 4 ($3,800 - $4,200)
The final building block before retesting ATH territory. A retest here could signal full bullish control in the coming months.
📍 As long as Zone 1 holds, ETH remains structurally bullish. Watch for breaks and rejections at each building block to gauge the next move.
Which block will ETH break next? 🔮
📚 Always follow your trading plan regarding entry, risk management, and trade management.
Good luck!
All Strategies Are Good; If Managed Properly!
~Rich

SEI - One More Bullish Impulse Soon!Hello TradingView Family / Fellow Traders. This is Richard, also known as theSignalyst.
📈After surging by over 75% last week , SEI is currently in a correction phase.
However, it is approaching the intersection of the previous high marked in orange and blue trendline acting as a non-horizontal support.
📚 As per my trading style:
As #SEI approaches the blue circle zone, I will be looking for bullish reversal setups (like a double bottom pattern, trendline break , and so on...)
📚 Always follow your trading plan regarding entry, risk management, and trade management.
Good luck!
All Strategies Are Good; If Managed Properly!
~Rich

Layer3 Can Grow 600% Easily (1,000%+ Possible) · Weekly & DailyWe are going to start by looking at the weekly timeframe. After we do a deep analysis on this scale we will move to the daily.
Layer3 (L3USDT) produced its main low in September 2024 after it started trading. We can consider this the market bottom. After this low a bullish wave develops and totals +330%. The peak happened in November 2024. After a bullish wave, there is always a correction and that's exactly what happened for L3USDT.
The correction produced a low that ended 10-March 2025. This is the first low after September 2024 and ended up as a higher low, which means bullish. Buyers were present on the drop and bought before sellers were able to compromise the previous support, our market bottom.
The reaction to this support zone holding produced 300% growth within 3 weeks. Then the same dynamic plays out again. A bullish move is followed by a correction.
The new correction, starting after the late March high, ended the 16-June week. This low moves lower compared to 10-March but the candle/session ends up closing higher. Above the 10-March week wick low, a signal of strength.
When comparing June 2025 vs September 2024 we have a long-term higher low and this supports a bullish bias and a new bullish wave. Just like March but this time stronger.
Now L3USDT has been green three consecutive weeks, this is good. A local downtrend has been broken and seeing how the overall market is doing, the rest of the altcoins, we can expect strong growth. Layer3 is set to move and is already moving, bullish momentum will only build-up.
The targets on the chart are all high probability. The first two are very easy targets. So 600% can happen easily mid-term, which is within 3 months (90 days). The remaining target should be considered long-term.
Daily Timeframe:
The daily timeframe is basically the same. The bullish bias is early but very strong based on multiple reversal bottom patterns and the break of a local downtrend.
This is a good choice.
Thanks a lot for your amazing support, it is truly appreciated.
Namaste.

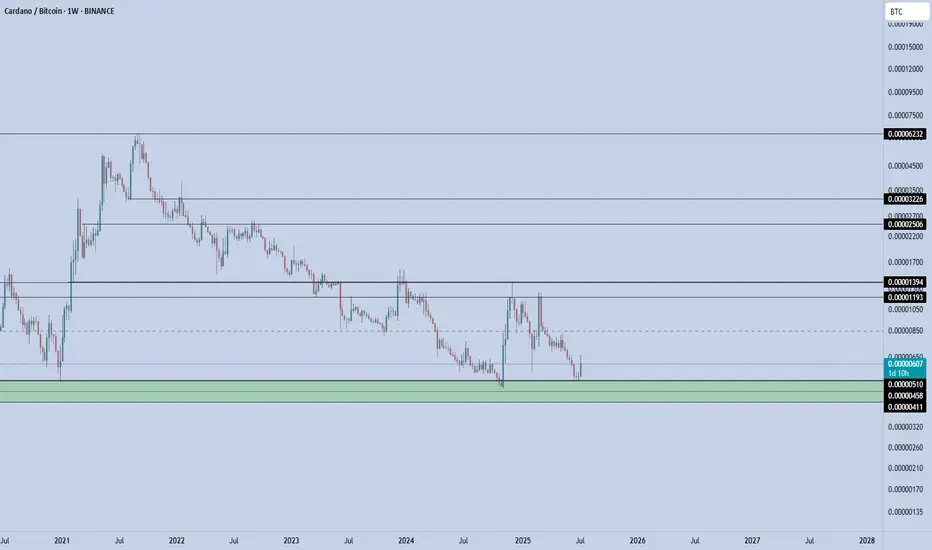
ADABTC – Long-Term Demand ZoneThe green box is a multi-year demand zone, tested multiple times, with each test producing strong upward moves.
Current structure aligns with previous cycle bottoms.
If BTC dominance stalls or rotates, alt/BTC pairs like ADA/BTC could rotate sharply upward.
📌 Risk Management:
A weekly close below 0.0000450 invalidates the long thesis. Until then, the risk-reward favors accumulation.
If market conditions align, ADA could be preparing for one of its classic ratio expansions — especially if Bitcoin cools and capital rotates into majors.
Avalanche, Why with Leverage? Exponential Moving AveragesOn the 10th of July AVAXUSDT finally managed to break above EMA55 and EMA89 on a very strong, full green candle. This is the day the market bias turns bullish and is fully confirmed. Bullish of course happens soon with the higher low, 22-June, but confirmation only comes after certain resistance levels are cleared, after the pair in question trades at a certain price.
Notice yesterday's candle, there was a rejection but prices remained above EMA89—blue dotted line on the chart. Today, we have a small candle with the same dynamics: A little lower then higher but still, above EMA89. The action is happening above 0.148 Fib.
These levels, EMA55, EMA89 and 0.148 Fib. extension all expose a strong support zone. As long as AVAXUSDT trades above them, we can expect maximum growth. That's why leverage is possible. With a well defined support range we can set the stop-loss right below and let the market take care of the rest.
Since both days failed to move prices lower, yesterday and today, and we know where the market is headed thanks to Bitcoin and the other altcoins that moved ahead, we can bet that Avalanche will grow and will do so strong. This is a safe bet.
Remember to do your own research and planning. Leveraged trading should be approached by experienced traders only. The same chart setup can be approached spot with minimum risk. Below 5X is also very low risk but higher is possible on this setup. Buy and hold, the market takes care of the rest. Great prices and entry timing.
Your support is appreciated.
Namaste.

BTC - Falling Correction = Continuation?BTC has been playing by the rules lately!
Every time Bitcoin forms a falling correction, it turns out to be a bullish continuation pattern — and history might be repeating itself 👀
As shown on the chart:
Previous falling channels (flag/wedge structures) have consistently led to strong bullish impulses.
The current correction also appears to be a falling channel, hinting at another potential bullish leg soon.
As long as the structure holds and no major support is broken, the next target could be a new all-time high.
Let’s see if BTC continues to respect this textbook behavior.
📌 Remember: Falling corrections in an uptrend = healthy continuation!
📚 Always follow your trading plan regarding entry, risk management, and trade management.
Good luck!
All Strategies Are Good; If Managed Properly!
~Rich

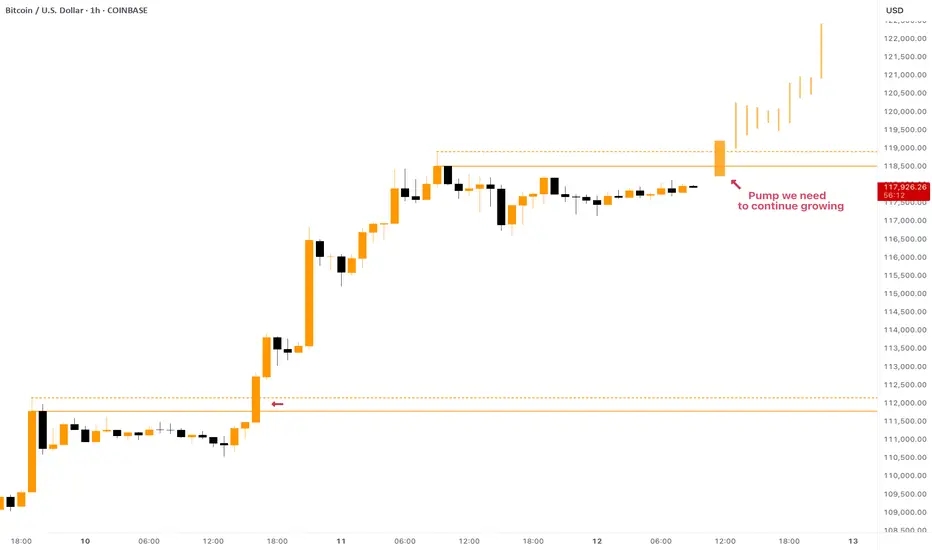
BITCOIN - Local Conditions for Growth ContinuationCRYPTOCAP:BTC showed us an astonishing growth from $108,000 to $118,000 in a few days! But what is next and where is the next target?
At the moment the price is consolidating below the ATH, in fact there are two resistances: $118,500 and $119,000. To continue pumping, Bitcoin has to break both of them with strong impulse.
To be honest , the current price development reminds me of what we've seen a couple days ago: breakout of the resistance -> consolidation below local highs -> strong breakout and growth continuation. Something similar can be expected now as well.
In the past couple of years CRYPTOCAP:BTC taught us a lesson of waiting no time to hop on the train . When it pumps - it does it quickly, just like it does it this time. So, waiting for the best entry near $109,000 - $110,000 might leave you behind while Bitcoin will be pumping towards $125,000.
Core DAO Bullish Impulse, Elliott WaveI am giving two targets for the end of the fifth wave, the first wave is already in.
Good morning my fellow Cryptocurrency trader, I hope you are having a wonderful day.
Here we have a classic chart setup, COREUSDT bearish since April 2024. The drop from April 2024 through March 2025 can be considered a big ABC. Once the correction ends, we can look for signs of a newly developing bullish wave. The signs are in.
Between March & May 2025 we have wave 1, ending clearly in a higher low. The first wave lasted 70 days, the third wave can easily last 90 days. Can be more or less, this is only a projection but we know the market is set to move higher.
Wave 2 was really short, it only lasted 28 days. So wave 4, the second correction within a bullish impulse, can last between 40 and 60 days. After wave 4 we get the fifth and final wave and this is the speculative wave.
These are very conservative projections on the chart, the market can move much higher. For example, wave 3 can end up going as high as wave 5. Then wave 4 would correct into what is now the wave 3 high. Then the final fifth wave would go off the chart and peak at $18. This is another version and it wouldn't surprise me, Crypto tend to go beyond all expectations when the bulls are on.
Regardless of how high the market goes, right now we have great entry timing and prices while at the same time knowing Crypto is going up.
Namaste.

SUPER = BACK WITH SUPER EFFECT - MOON SHOTSuper can show in the coming time frames an interesting view.
When there is confirmations, will add below this update.

THORChain 1,784% Profits Potential & Technical AnalysisHere we can see THORChain sandwiched in-between EMA89 and EMA55. The action is not happening above EMA89 but this shouldn't be considered bearish, more like "we are not there yet." Or, "still consolidating but with a bullish bias."
The bias is bullish because the low came in early February 2025. So that is more than 5 months ago. A bearish trend or bearish continuation would require lower lows in those 5 months. The fact that after the low in February there was a small recovery and this recovery ended as a higher low on the retrace, means the downtrend reached its end. Since the downtrend is over, we are seeing consolidation, accumulation before the market turns. The turning is the bullish cycle, the uptrend. And we are in the process of seeing this change materialize into the market, price and chart.
The minimum target is the "baseline level" between $7.44 and $6.20. The target to aim for should be $18 and if you are feeling optimistic then $28. I've seen this project grow incredibly strong in the past so I wouldn't be surprised if it ends up moving even higher.
This is a simple chart. What goes down, must come back up; specially when we are talking about Crypto. The best financial market in the whole world. Young, but highly profitable. Risky? I don't know... It is risky to be young. But the potential rewards make up for any risk the market carries. We can take risk when we are young. We should. You play it safe because you are old. No risk, no fun. Plan ahead, success is yours.
Namaste.

Peanut the Squirrel 1315% Profits Potential · Technical AnalysisI noticed that most of the memecoins have a strong growth potential. Here we have PNUTUSDT and the potential goes easily beyond 1,300%. An easy target is set to 467% so you can imagine. The chart looks strong and you know we focus only on TA.
Good evening my fellow Cryptocurrency trader, I hope you are having a wonderful day.
Peanut the Squirrel. Who am I to judge? RWA, Layer 1, POW, Gaming, DeFi, Infrastructure, NFT, AI... The choice is yours.
Here we have the classic and more than classic higher low. The bottom low and the bullish breakout ending its retrace higher is as easy and simple as it goes. The beauty of TA. You can know where the market is headed based on how the candles behave.
And then, we are back to the EMAs. Notice the blue one because it is the main one I'll be using on the daily timeframe. The huge big candle happens to break above this level. Once this level is conquered as resistance we know the bulls are on. Now the market can rest but it can also move ahead. We have a higher low, PNUTUSDT, and the action happening above EMA89, EMA55 and EMA13; in short, the bulls win.
The next higher high and first target is $1.03. This is followed by $1.59, 467% potential for growth and then the market can continue higher, easily, because we are entering the strongest ever Cryptocurrency bull market.
Namaste.

ADA Daily Update · Moving Averages · 262% Target ExposedGood morning my fellow Cryptocurrency trader, I know you are having a wonderful day because the market is doing great. We looked at Cardano together on the weekly timeframe and this is a big picture but what about short-term? Where are prices headed next? The next target, resistance/support and the moving averages of course.
I've been looking at the moving averages lately and this is a theme that I will continue for a few days, or weeks, once we exhaust it we use other indicators. You know we also like the RSI and MACD, candlestick reading, volume, chart structure, chart patterns, market cycle, etc. Marketwide action, subtle signals, market sentiment, on and on.
Cardano is already trading above many major moving averages but this is a recent event. First consider the fact that in late 2024 ADAUSDT grew 320% right after breaking above the same EMAs that I am showing you now.
ADA closed just recently above EMA89, EMA233, EMA55, etc. Only MA200 is missing and this is an important one but will soon break. I am not showing it here because the action is still happening below.
There is a rounded bottom. This alone is a reversal signal already confirmed because the action is happening above the base of the pattern. In April we had a triangular bottom and here we can see an alternation. In February it was a straight line. A straight line, a triangle and then a circle; interesting.
The bullish bias is confirmed and we are seeing straight up, the next target is 0.8194. Cardano has been green four days straight. Go back to November 2024... The possibility exist for continued growth. Day after day after day. At some point there will be a stop, can be a retrace or correction. Know that when this stop happens it is not the end. There will be several stops along the way but we are set for a strong new all-time high. You will need to be patient while holding but just make sure to aim high. Don't get greedy of course. If at some point you start to feel anxious, read on the topic, go out into nature or simple sell a small portion until you feel better. The best choice is to be prepared and this can be done by studying the charts and the market. If you have a good plan and a nice map you will do fine. If you are an advanced trader, I am sorry, let's get back to the chart.
$1.01, $1.30, $1.15. These are all resistance. So there will be some challenge around this price zone. Once it is conquered though the advance should be swift until 1.83. Another stop and then 2.65 which is the main target for 262%. Depending on how this level is handled we will update the chart and the targets. For higher targets look at earlier analyses or those on the weekly timeframe.
Thank you for reading.
Namaste.

WAVES ON WAY TO $2waves have a high chance to enter a new break to 2 usd, since the last data.
When there is more confirmation, the updates will be below.

Is BNB About to Explode—or About to Collapse?Yello Paradisers! Could this be the beginning of the next BNB rally, or just another classic trap to liquidate early longs before the real move begins? Let’s dive into this high-probability setup before it’s too late.
💎BNBUSDT is currently showing good signs of bullish continuation. The price has successfully broken out of a descending channel and performed a precise retest of that structure—an early confirmation of strength. Following this, we’ve seen a strong reaction from a Fair Value Gap (FVG) and the 200 EMA, both of which align perfectly with the inducement taken just before the bounce. This confluence of technical signals significantly increases the probability of a sustained bullish move in the near term.
💎If price pulls back from current levels, it could offer us a more attractive risk-to-reward opportunity for long entries. Traders who are targeting higher RR ratios, such as 1:2 or beyond, may prefer to wait for a deeper pullback into our predefined support zone for a cleaner entry. This zone remains critical for maintaining our bullish bias.
💎However, if the price breaks down and we see a full candle close below that support zone, the entire bullish scenario becomes invalid. In such a case, it would be more prudent to stay on the sidelines and wait for a clearer and more favorable price action setup to emerge before jumping back in.
We are playing it safe right now. If you want to be consistently profitable, you need to be extremely patient and always wait only for the best, highest probability trading opportunities.
MyCryptoParadise
iFeel the success🌴

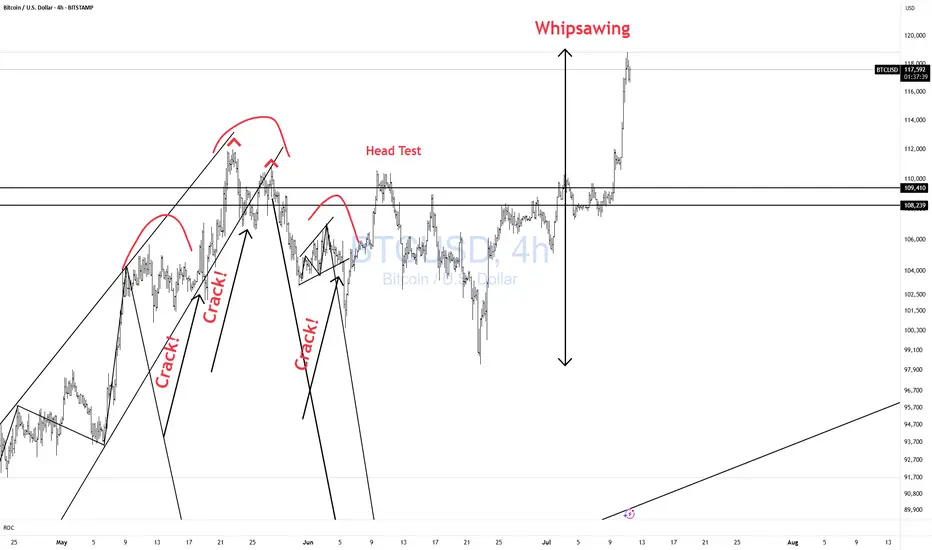
BTCUSD Whipsawing! CAUTION!Bulls CAUTION! Price is whipsawing all over the place.
Better to be out of the market wishing you were in than in wishing you were out!! Don't chase!!
Dogecoin Prepares 2025 Bullish Wave · New All-Time HighThe last time that Dogecoin produced strong bullish action was November 2024, more than 217 days ago. Before this wave, there was a small period of growth in early 2024 and that's about it, the market was bearish for a long-time after the 2021 all-time high. There is good news though. Dogecoin is preparing for a new major bullish cycle and this cycle is already in place.
Since mid-March 2025 the action has been weak. No growth but no decline either. Between May and June, there were more than 8 weeks of bearish action but Dogecoin's price remains strong within a mid-term higher low. The last three weeks have been green with this week being full green trading at the top of the candle, the market is about to produce a major advance.
If you look back to October 2024, late, you will see small candles then several huge big candles, maximum growth. That's how Crypto tends to operate. One day the market is silent, the next day we are witnessing the strongest ever bullish wave. This is what Dogecoin is getting into right now.
If you look back to early 2021 it is the same. Late March and early April 2021 we have very small candles and then everything changes suddenly and the market produced astonishing growth. We are on the verge of such an event, the 2025 bull market phase and bull run. Get ready and prepare for a new all-time high.
Namaste.

Dogecoin Daily, A Closer View · Next Target, How To Trade & MoreYesterday Dogecoin moved above EMA89, a major long-term moving average. Definitely bullish confirmed. We are giving Dogecoin a closer look because the other chart was based on the long long-term, the weekly timeframe. With this one, we will know exactly what happens next.
Today, DOGEUSDT is moving above EMA233 and this one is super long-term. Immediate resistance is found at 0.21300 but this is likely to break right away, always allowing for a few days of fluctuation because the market never moves straight down nor straight up. It fluctuates creating waves.
The next target after this one is 0.26500 followed by 0.34900. These can be hit short-term. In the coming weeks and days. After this one, we will aim at the last high which happened December 2024, now already a long-time ago.
The altcoins market is bullish but this bullishness is very early, it is only getting started. The market will be bullish for such a prolonged period of time that you will get used to seeing bullish action and at one point will become comfortable seeing your profits grow. When this happens, stay alert and make sure to secure some wins on the way up.
Do not chase rising pairs, buy those trading near support. Buy and hold.
This is the best strategy for maximum profits. Also, if you catch a winner, let it ride long-term. This also produces bigger profits in the end vs selling and trying to catch the retrace to buy again. It is better to buy big when prices are low and hold long-term. Only secure some profits when you are really high up, after 2-3 months. And of course, when the time for the new all-time highs is close, that's the time to close all positions.
Thanks a lot for your continued support.
Namaste.

dYdX Hyper Bullish Market Conditions, $11.1 Next Target (1,671%)"Once we hit bottom, there is no other place left to go but up." dYdX hit bottom, a new all-time low last month and is turning ultra-hyper bullish this week. The action is already moving above EMA8 and EMA13 while breaking a local downtrend coming off the December 2024 peak price.
We have a full green candle and this candle signals a recovery and the start of the 2025 bull market cycle. This cycle can last 6-12 months for this specific pair or longer. Remember that each project, each trading pair, each altcoin can produce different price patterns and dynamics. This is easy to see because here we have a new all-time low, other pairs hit their all-time low in April this same year while others did so in August 2024, others in 2023, some others in 2022, etc. Each pair/project should be considered individually.
Good strong projects trading at bottom prices have higher potential for growth. For example, you can certainly make more money buying and holding dYdX tokens vs Solana or Ethereum. Because the latter two are trading much higher compared to their all-time high and because these projects are much bigger. Smaller projects have higher potential for growth.
So all is good in Crypto-world the market is going up. dYdX is turning bullish just now but the bias is confirmed based on marketwide action. Seeing how the other projects are performing predicts what comes next. When the week closes above EMA8 and EMA13, you have a full blown bullish confirmation. The action already recovered from the ATL range and is happening above the 10-March and 7-April lows. This is enough to secure/confirm growth.
We buy low to sell high. We buy when the market is red and hold.
We sell when prices are high. We sell when the market is green and there is lots of hype all around. Lots of profits to be made. At this point in time, all that is needed is to choose wisely and practice patience, patience will be the biggest earner; patience pays.
Thank you for reading.
Namaste.

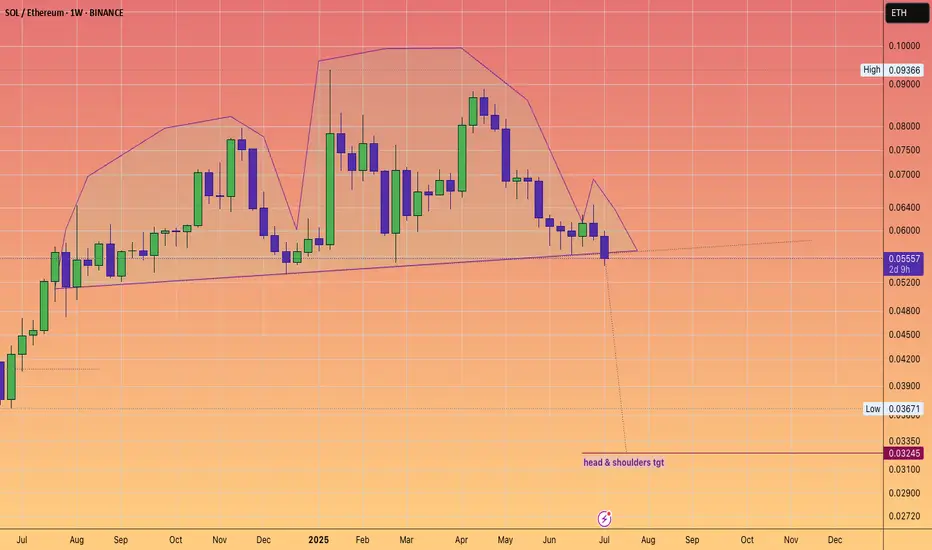
Boomers buying Ethereum not SolanaRatio has broken a head and shoulders
Stablecoin supercycle
Tom Lee
SBET
ETH treasury #fomo