Kaspa Bullish · The Wait is Over · Ready to GrowWe have a very interesting situation here with the Kaspa chart, KASUSDT. There is no going back. Once the bottom is in, you know the next logical step is a change of trend. It can take some time before the low settles; the low is process not a one-day event. But here it settled already and this is all we need to know that the bullish bias is fully confirmed. You can now enter KASUSDT with lev while resting easy.
Good evening my fellow Cryptocurrency trader, I hope you are having a wonderful day.
The first low happened 10-March and then a lower and final low 7-April, also a technical double-bottom. Here Kaspa produces a small reaction and grows 150%. Notice that growing 150% in 30 days is small in the Crypto-world. If you were trading conventional markets, you would have to wait 10 years to get 70% growth.
Anyway, the initial bullish reaction to confirm the end of the correction goes into retrace and 16-June (the week), 22-June specifically, the market produces a higher low. This is the final retrace before maximum growth. I mean, there will be retraces and corrections in the future but the wave that is about to start now will not be 150%, it can be much bigger and last a lot longer, this is the 2025 bull market bullish phase. It will be a major wave.
This is just a friendly reminder to let you know, you can go all-in.
Thanks a lot for your continued support.
You will be happy with the results.
Namaste.
Crypto

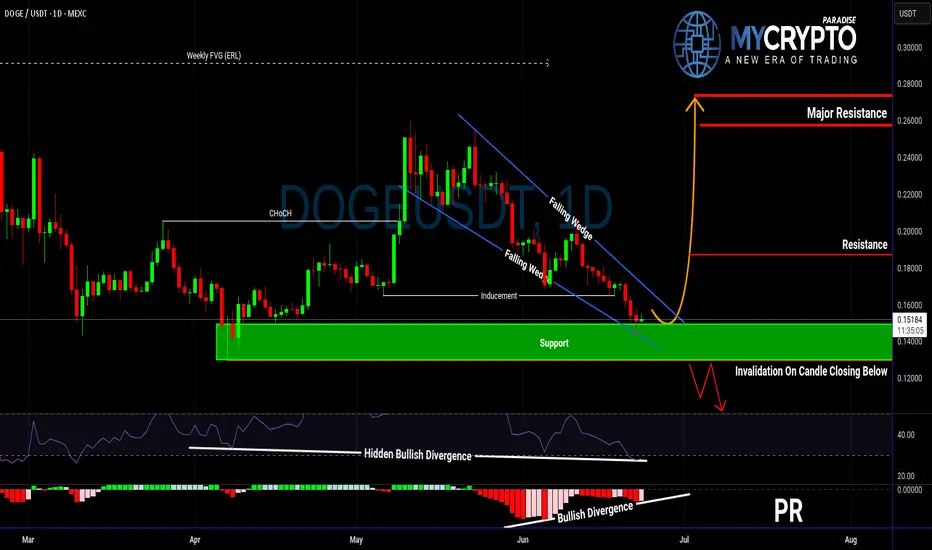
Is DOGE About to Explode or Collapse?Yello Paradisers! Are you ready for what could be DOGE’s most explosive move in weeks? DOGEUSDT is currently developing a very interesting bullish setup that deserves attention.
💎The pair has formed a falling wedge — a pattern that often precedes a breakout to the upside. This comes right after a confirmed bullish Change of Character (CHoCH), indicating that buyers are quietly stepping back in.
💎Even more important, we’ve seen a classic inducement grab, meaning early liquidity has been taken out, clearing the way for a potential real move. On top of that, there’s hidden bullish divergence on the RSI and clear bullish divergence on the MACD. This combination of signals significantly increases the probability of a bullish reversal from the current support zone.
💎If DOGE prints a convincing bullish candlestick pattern at these levels, it could offer a high-probability long opportunity with a strong risk-to-reward ratio. But be careful — if the price breaksdown and closes candle below this key support, the bullish scenario becomes invalid, and it’s better to wait for a more favorable structure to develop.
Strive for consistency, not quick profits. Treat the market as a businessman, not as a gambler. This is the only way you will make it far in your crypto trading journey. Be a PRO.
MyCryptoParadise
iFeel the success🌴
BTC makes new all time highs!Crypto has been soaring today.
Ethereum and BTC pumping liquidity!
Fed minutes came out today around 2pm, indicating rate cuts at next meeting and throughout the rest of the year and crypto absolutely loved that.
Crypto thrives in a cheap liquidity environment, rallying in potential rate cuts.
We took profits on IBIT calls - still holding longs in the BTC market expecting higher price.

XRPBTC 303% Bullish Wave in the Making (Or Higher)One of the most unique charts in the entire Cryptocurrency market, XRPBTC produced very little retrace after its major late 2024 bullish breakout and recovery. This small retrace is a signal of strength. When prices produce a strong advance but fail to move deep once the advance is over—consolidation happening at high prices—this is one of the strongest signals the market can offer.
XRPBTC started at a low of 674 satoshis in mid-November 2024. The peak happened two months later at 3419 satoshis. Mid January 2025. Now, the retrace lowest point in June was 1928 satoshis. This is 185% higher compared to the November 2024 low, that's what I mean by strength.
The fact that there wasn't strong selling pressure after a 400% bullish wave, signals that participants are ready to hold long-term. And this is a great choice, people are smart. They are holding because they know XRP will continue to grow.
When it comes to Fibonacci retracements, the correction found support right at 0.5. When the market is weak, it tends to move below 0.618 and reach 0.786 or lower before recovering.
The rounded bottom is already in and the candles are starting to curve. Three weeks green, we can expect XRPBTC to produce a new wave of growth. The targets can be found on the chart.
Namaste.

ENJBTC 2017, 2019, 2021 & 2025 (530% Easy Target)This is another interesting BTC trading pair—ENJBTC. I am only showing a portion of the chart, the bottom and falling wedge pattern but the decline has been happening since November 2021.
There have been three bull markets on this pair: Late 2017, 2019 and 2021.
» In late 2017 ENJBTC grew 1,622% in 68 days.
» In the 2019 bull market, ENJBTC grew 1,199% in 206 days. The meat of the move happened in 116 days.
» In 2021, the most astonishing Cryptocurrency bull market ever, until 2025 that is, ENJBTC grew 1,756% in 96 days. It took an additional 231 days for a double-top and the final all-time high. From bottom to top the 2021 bull market produced 2,180% growth in 327 days.
Now we are looking at a completely different situation. The longest bear market ever and a true all-time low are now present on the chart. The mapped targets are super easy, 300% and 530%, ENJBTC can grow so much more in the coming months. You can aim for 1,000% or higher.
This is just a friendly reminder, so that you can enjoy great timing and entry prices.
Thank you for reading.
Namaste.

ETHBTC Opportunity Buy: Major 2025 AltcoinSeason & Bull MarketThis is the big one and the good one. ETHBTC was bearish since December 2021 but this cycle finally came to an end in April this year. After the initial bullish breakout and higher low we can clearly see some bullish action developing; three consecutive weeks green. The bullish bias is now confirmed. It is still early.
We are looking at 200% potential. The "back to baseline" target. This is a price range where ETHBTC traded sideways as part of a distribution phase for more than two years. This is a must-to-be-tested resistance zone and thus opens up a sure 200% profits potential for this newly developing bullish wave.
Ethereum's ETFs are coming, Bitcoin already has its ETFs. This can mean Ethereum outperforming Bitcoin, and many altcoins, in so many ways. This also opens up the potential for a new all-time high on this pair.
The same sequence of 'low-higher low' happened in the last bull market. ETHBTC hit bottom in September 2019 then produced a higher low and this signaled the start of a major, long-term 447% rise. The conditions are similar now but the rise will be faster.
We have two main targets for the all-time high in late 2025 or early 2026.
1) 0.13207. With 442% profits potential from current price.
2) 0.20278. With 733% profits potential.
The entire bullish cycle for this pair can unravel within 4-6 months. If it becomes extended, it can last one year or longer. Both scenarios are possible.
It is 100% certain that ETHBTC will go on a major bullish cycle together with the rest of the altcoins market. Bitcoin will also grow.
Thanks a lot for your continued support.
If you are bullish on Crypto, comment below.
Namaste.

Stellar Lumens Looks Ready for Blast-Off!There is a very similar trend happening with the technology of the internet and computing as what we’re seeing now with AI and crypto. The early accumulation cycle for Nvidia would have shaken out many investors simply because of how long it took before going parabolic. Stellar Lumens is showing the same pattern—but the wait could be over. I see a large parabolic run coming for Stellar Lumens very soon, one that could take us to new all-time highs and spark a mass adoption cycle similar to what happened with internet and computing technology.
As always, stay profitable.
- Dalin Anderson

Dogecoin Will Shock Investors With Its Next Move!Today I’m doing an in-depth analysis of Dogecoin and its market cycle in comparison to the early Bitcoin cycles. As you can see, the same human psychology and emotions are playing out in the Dogecoin market that we previously saw with Bitcoin. With mass adoption coming to the cryptocurrency markets, it’s very possible we’ll see a parabolic run on Dogecoin similar to what we saw with Bitcoin in 2016 and 2017. This could lead us to a new all-time high.
Because markets are fractal in nature, we see similar patterns appearing over and over again. If you can learn to understand and identify these cycles and patterns, you can position yourself for maximum profit. I see Dogecoin running very bullish through the rest of 2025, and it could also continue into 2026 as mass adoption drives increasing demand for cryptocurrencies. In fact, we could see the entire crypto market run all the way into 2029, as the stock market is also primed for a large parabolic move in its own cycle.
Stocks and crypto are heavily correlated since both are tied to the global economy. Contrary to popular belief, the world economy may actually be set up for a massive run in value—almost like a “Roaring 20s 2.0.” This means buying Dogecoin today could be like buying Bitcoin in early 2016—the opportunity for profit is enormous.
As always, stay profitable.
- Dalin Anderson

BITCOIN - SELL TO $86,000 (8H VIEW)I see selling opportunities right now for Bitcoin.
⭕️LQ Swiped Above Previous Wave 3 High ($109,000).
⭕️Wave 4 Complex Correction Complete (5 Sub-Waves).
⭕️(Wave 5 Impulse Bullish Move Complete (5 Sub-Waves of 1,2,3,4,5).
❌Invalidation Zone Above Wave 5 High ($112,140).
High risk trade as BTC could still head high for Wave 5 around $120- $130,000. Use strict risk management.

XRP: Ripple Ready to Unleash a Tsunami?Ripple (XRP) is coiling like a spring—ready to explode. After five clean re-tests of a powerful demand zone, buyers have repeatedly stepped in to defend key levels, launching 40–75% swings each time. Is this the moment it unleashes the wave?
🔍 Technical Breakdown:
✅ Demand Zone Strength
XRP is bouncing from a long-tested demand zone (5+ re-tests). Each bounce led to substantial upside momentum.
✅ Bull Flag Retest
XRP previously broke out of a large bull flag and has been holding the flag’s top trendline for over 40 days—acting as strong support.
✅ Higher Low Structure
Price formed a higher low (H/L) and has climbed steadily for two weeks—building bullish structure.
✅ Volume Profile
Price reclaimed ground above the high-volume node, signaling accumulation strength.
✅ Market Cipher B Divergence
A weekly hidden bullish divergence is present—not massive, but notable—hinting at momentum shift.
⚠️ What to Watch:
Volume is key: Current consolidation shows a decline in volume—a surge could ignite the breakout.
Confirmation for conservative traders: Wait for a break and hold above $2.33 with volume, or a retest of that level.
If past demand zone reactions repeat, a breakout could be imminent.
What do you think?
📈 As always—this is not financial advice. Do your own research.
🧭 Happy Hunting!

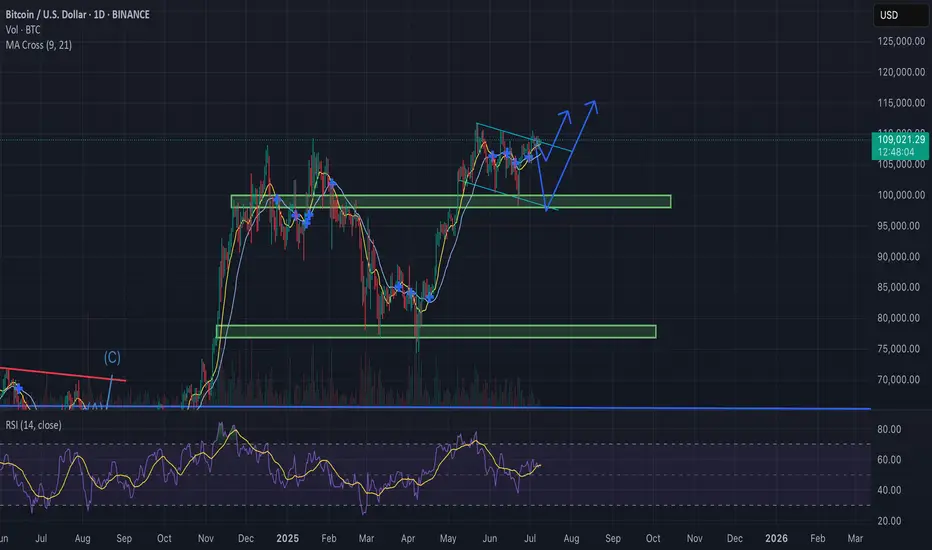
Bitcoin Update – Bullish Falling Wedge in Play?BTC/USD is currently trading near $108.8K, compressing within a falling wedge formation — historically a bullish continuation pattern, especially after a strong uptrend.
Why the Bias Remains Bullish:
Bullish MA Cross: Short-term MAs (9/21) are aligned for upside momentum.
Falling Wedge: Price compressing with lower highs and lows, coiling for a breakout.
RSI Strength: RSI (purple) remains elevated, supporting continued upside pressure.
Fundamental Catalysts:
Trump delays trade war announcements, reducing global uncertainty.
FOMC meeting in late July: Trump pushes for rate cuts, potentially bullish for risk assets like BTC.
If BTC breaks out above the wedge resistance with convincing volume:
Retest likely at ~$110K
Targets : $115K → $120K+
SOL/USD 2H chart PATTERN.SOL/USD 2H chart, the price is forming a bullish ascending triangle breakout, and it's approaching the upper resistance trendline. If it breaks out with volume, a strong move upward is expected.
📈 Bullish Target Points:
1. First Target:
✅ $157.80 — This is the first horizontal resistance and initial breakout target.
2. Second Target:
✅ $162.00 — A higher resistance level based on previous highs and projected breakout momentum.
---
🔎 Additional Notes:
Support Level: Around $149.90 — also near the ascending trendline.
A confirmed breakout above the triangle with a daily candle close and strong volume would validate these targets.
Consider using a stop-loss below $149.00 if you're trading this setup.
Let me know if you want a trade entry suggestion or risk management strategy.

Cronos (CRO) Soars +20% – Can the Rally Push to $0.10?Over the past 24 hours , the Cronos project with the CRO ( COINBASE:CROUSD ) token has seen a price increase of nearly +20% .
Let's see if we can still profit from the movement of the CRO token .
What is Cronos (CRO)?
Cronos is an EVM-compatible blockchain built on the Cosmos SDK. It supports DeFi, NFTs, faster payments, and even AI‑capable dApps. Its native token, CRO, powers fees, staking, and ecosystem activities.
Why CRO Jumped +20% Today (July 8)
Technical leap: Sub-second block times and faster throughput
Better UX: Real-world ready for fast DeFi, payments, and AI dApps
Increased adoption: Greater utility across CAPITALCOM:CROUSD ecosystem
Trader momentum: Volume surges and speculative interest
Strategic roadmap alignment: Upgrades following gas fee improvements ---------------------------------------------------------------------
Now let's examine the CRO token chart on the 4-hour time frame from a technical analysis perspective.
CRO token is currently trying to break the Resistance zone($0.0960-$0.0925) .
Also, in terms of Elliott wave theory , this CRO token price increase with high momentum should be in the form of wave 3 and we can expect a correction to the Potential Reversal Zone(PRZ) for CRO .
I expect CRO to re-attack the Resistance zone($0.0960-$0.0925) after entering the PRZ and rise to at least near $0.1(Round Number) .
Note: Stop Loss (SL) = $0.847= Worst Stop Loss(SL)
Note: If the CRO token breaks the Resistance zone($0.0960-$0.0925) without correction, we can expect a break of the Resistance lines.
Note: It is better to enter a trade if you find the right trigger for a Long position, as a Short position is more risky.
Please respect each other's ideas and express them politely if you agree or disagree.
Cronos Analyze (CROUSD), 4-hour time frame.
Be sure to follow the updated ideas.
Do not forget to put a Stop loss for your positions (For every position you want to open).
Please follow your strategy and updates; this is just my Idea, and I will gladly see your ideas in this post.
Please do not forget the ✅' like '✅ button 🙏😊 & Share it with your friends; thanks, and Trade safe.

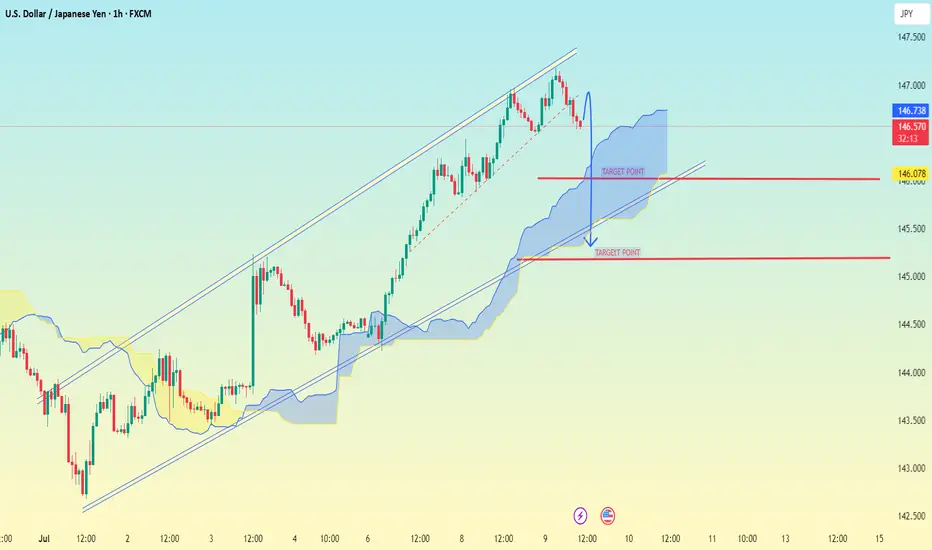
USD/JPY 1H chart PATTERNUSD/JPY 1H chart, the pair has broken below an ascending channel, which is typically a bearish signal. The price is currently inside the Ichimoku cloud, indicating uncertainty, but a breakdown seems likely.
📉 Bearish Target Points:
1. First Target:
✅ 146.078 — Near the bottom edge of the Ichimoku cloud and a horizontal support level.
2. Second Target:
✅ 145.300 — Clear support zone below the cloud, also aligns with previous consolidation area.
---
🔎 Additional Notes:
A breakdown below the Ichimoku cloud will confirm stronger bearish momentum.
Watch for a retest of the lower trendline or cloud support before a deeper drop.
Use stop-loss above 146.80 to manage risk if you're trading this setup.
Let me know if you want a buy/sell entry recommendation or SL/TP planning.
(XAU/USD – Gold vs US Dollar on 4H timeframe)(XAU/USD – Gold vs US Dollar on 4H timeframe), the analysis shows a bearish setup with a breakdown from the ascending trendline and confirmation below the Ichimoku cloud.
1. First Target: 3,220
2. Second Target: 3,180
3. Final Target Zone: 3,130 – 3,100
Note.
Price has rejected from the resistance zone (highlighted in yellow).
Break below support and cloud suggests bearish momentum.
The blue box (around 3,240–3,250) seems to be a possible retest zone before continuation downward.
📉 Bias: Bearish
If price stays below 3,250, these targets remain valid. Watch for retest failures or strong rejection candles to confirm entries.
Let me know if you want SL (stop-loss) or entry suggestion too.

Bitcoin H1 | Potential bounce off a multi-swing-low supportBitcoin (BTC/USD) is falling towards a multi-swing-low support and could potentially bounce off this level to climb higher.
Buy entry is at 107,504.00 which is a multi-swing-low support that aligns closely with the 61.8% Fibonacci retracement.
Stop loss is at 106,700.00 which is a level that lies underneath an overlap support.
Take profit is at 109,163.00 which is a swing-high resistance that aligns with the 78.6% Fibonacci retracement.
High Risk Investment Warning
Trading Forex/CFDs on margin carries a high level of risk and may not be suitable for all investors. Leverage can work against you.
Stratos Markets Limited (tradu.com ):
CFDs are complex instruments and come with a high risk of losing money rapidly due to leverage. 63% of retail investor accounts lose money when trading CFDs with this provider. You should consider whether you understand how CFDs work and whether you can afford to take the high risk of losing your money.
Stratos Europe Ltd (tradu.com ):
CFDs are complex instruments and come with a high risk of losing money rapidly due to leverage. 63% of retail investor accounts lose money when trading CFDs with this provider. You should consider whether you understand how CFDs work and whether you can afford to take the high risk of losing your money.
Stratos Global LLC (tradu.com ):
Losses can exceed deposits.
Please be advised that the information presented on TradingView is provided to Tradu (‘Company’, ‘we’) by a third-party provider (‘TFA Global Pte Ltd’). Please be reminded that you are solely responsible for the trading decisions on your account. There is a very high degree of risk involved in trading. Any information and/or content is intended entirely for research, educational and informational purposes only and does not constitute investment or consultation advice or investment strategy. The information is not tailored to the investment needs of any specific person and therefore does not involve a consideration of any of the investment objectives, financial situation or needs of any viewer that may receive it. Kindly also note that past performance is not a reliable indicator of future results. Actual results may differ materially from those anticipated in forward-looking or past performance statements. We assume no liability as to the accuracy or completeness of any of the information and/or content provided herein and the Company cannot be held responsible for any omission, mistake nor for any loss or damage including without limitation to any loss of profit which may arise from reliance on any information supplied by TFA Global Pte Ltd.
The speaker(s) is neither an employee, agent nor representative of Tradu and is therefore acting independently. The opinions given are their own, constitute general market commentary, and do not constitute the opinion or advice of Tradu or any form of personal or investment advice. Tradu neither endorses nor guarantees offerings of third-party speakers, nor is Tradu responsible for the content, veracity or opinions of third-party speakers, presenters or participants.


$SUI Gearing Up to Break Triple Resistance?CRYPTOCAP:SUI is consolidating under resistance which often leads to a breakthrough but can take some time.
Price is sat above the daily pivot after breaking the downward trend resistance, but still under the daily 200 EMA and High Volume Node resistance. A pop above $3.09 swing high would be a bullish signal to long towards a first target of $4.2 High Volume Node.
Analysis is invalidated with a move below $2.7, leaving heavy resistance still ahead.
Safe trading

$AAVE Ready to Pop?EURONEXT:AAVE long signal is now active.
Price is still well above the daily pivot and daily 200EMA showing a strong local trend.
I am still expecting a decent move to test the all time high, High Volume Node at $460.
Safe trading

Bitcoin Dominance, RSI Bearish Divergence & Decreasing VolumeThis is a classic signal and we are going to be looking at it on two different timeframes, daily and weekly.
Bitcoin Dominance (BTC.D) is producing a strong bearish divergence with the RSI. The weekly timeframe is very pronounced and I will show you the details below. This type of signal tends to support a change of trend. It appears before the reversal happens but sometimes it can take years before it goes into effect.
» BTC.D Weekly RSI
Here you can see the RSI peaked October 2023. Then a lower high October 2024, then again in April 2025 and finally last month.
As the RSI produces lower highs BTC.D is producing higher highs.
This signal is supported by decreasing volume. Bitcoin Dominance continues to climb higher while trading volume continues to drop. Both signal support a change of trend soon and together they become stronger.
» BTC.D Daily RSI
The daily RSI peaked June 2023 but we will focus on the short-term as we already have a strong signal coming from the weekly.
Here we have a peak in May 2025 and a strong lower high in June. Needless to say, BTC.D peaked 27-June thus the divergence but the action is clearly weak.
» Bitcoin daily
There is a long-term rising wedge on the weekly timeframe and this pattern can also support a reversal.
All these signals are bearish but not very strong, still, there is some weakness on the bearish side for this index. This means that the action can turn bearish tomorrow or it can continue rising for weeks or months before turning red.
These signals are pointing to a reversal but they do not give us a specific date. Can happen next week, next month or in seven months. If we focus on the altcoins, the way they are looking and how long will it take for them to grow, then this index can turn bearish within 2-4 weeks. Bitcoin will also grow as the altcoins market grow. Everything Crypto will grow in late 2025.
Thanks a lot for your continued support.
Namaste.

TOTAL2 Moving Averages · This Bull Market Will Change Your LifeMarch 2024 signaled the end of a bullish cycle. After this month, the Cryptocurrency market went bearish. TOTAL2 index went bearish. As it was bullish, it traded above all the moving averages plotted on this chart. As it went bearish, all the moving averages broke as support but one, MA200. The back line on the chart.
MA200 works as support and denotes the broader and bigger cycle. As long as the action happens above this indicator, the market is growing thus bullish long-term. If the action moves below, the bears are in and winning.
Another strong moving average is EMA89, blue on this chart.
When TOTAL2 was bearish it managed to close only briefly below this level. One week and the next week back green. August 2024 and September 2024 TOTAL2 found support at MA200 and EMA89. As soon as these indicators were confirmed as support, we saw the development of a new bullish wave.
The altcoins market grew in November leading to a peak in December 2024. Here the same pattern repeats. TOTAL2 went from bullish to bearish. While it was bullish, it traded above all of the moving averages: EMA8, EMA13, EMA21, EMA55, EMA89 & MA200. As it turned bearish, all these moving averages were tested as support, all of them broke but one, MA200.
In April 2025 MA200 was tested as support and holds. As long as TOTAL2 trades above this level, we know the bigger broader market bias remains bullish. Bullish confirmed. As soon as this level was tested we had a small recovery above all moving averages, until May. Then a retrace led to a test of EMA89 as support and this level holds.
When TOTAL2 trades above all the moving averages, bullish confirmed.
TOTAL2 is now trading above EMA8, EMA13, EMA21, EMA55, EMA89 and MA200 on the weekly timeframe. Ultra-bullish and ready to grow.
Just as the December 2024 high was a higher high compared to March 2024, the late 2025 high will be a higher high vs December 2024. We are in a rising trend and this is confirmed because MA200 always holds as support.
Now that this level has been confirmed, we can expect additional growth. Instead of a single month of bullish action as it happened in late 2024, we can expect a minimum of 3 months of continued growth. In total, we will have at least 6 months, and then some more.
Because it is unexpected, this bull market will change your life, forever. You will receive more benefits and more blessings than anything you can ever imagine. All your hard work will pay-off. You will be rewarded for your patience, persistence and continued support.
Namaste.

Syscoin: From Bearish to Bullish, The Market Wants ChangeChange is good, but it is not always mandatory. Change is good and recommended only when we are stuck in a certain pattern, in a certain routine or lifestyle, in a certain way of being and we want to experience growth. Exponential growth. When it comes to growth, change is awesome.
Market conditions are changing. Very slowly but still, change is change and change leads to growth. If the market has been stuck too long in the same pattern, the same condition, stagnation is the result.
The market is alive. The market has goals and its goal is to reach you; in order to reach as far as you, the market must grow.
The market understands this dynamic and it will do whatever it takes. The market will not die, it cannot die, so it will do what is necessary in order to promote its own growth. If what the people want is a bullish wave, higher prices, high profits; get ready because the market will give you exactly what you want.
Syscoin has been bearish since December 2021. Apart from a few small bounces, 140% and 400%, it has been going down and really strong, just recently, we witnessed a new all-time low.
Syscoin will not continue in the same pattern for long. In fact, the all-time low happened 7-April, in June, last month, we had a double-bottom (higher low). So the downtrend is over, we are approaching a wave of growth.
The market is changing. The market will change. The change of course will be a major bull run. Instead of lower prices, we will have a multiple-years high, maybe even a new all-time high in the coming months.
In late 2025, everything Crypto will be up. We even have the potential of a multiple years long bull market. Do you agree?
Thanks a lot for your continued support.
Namaste.

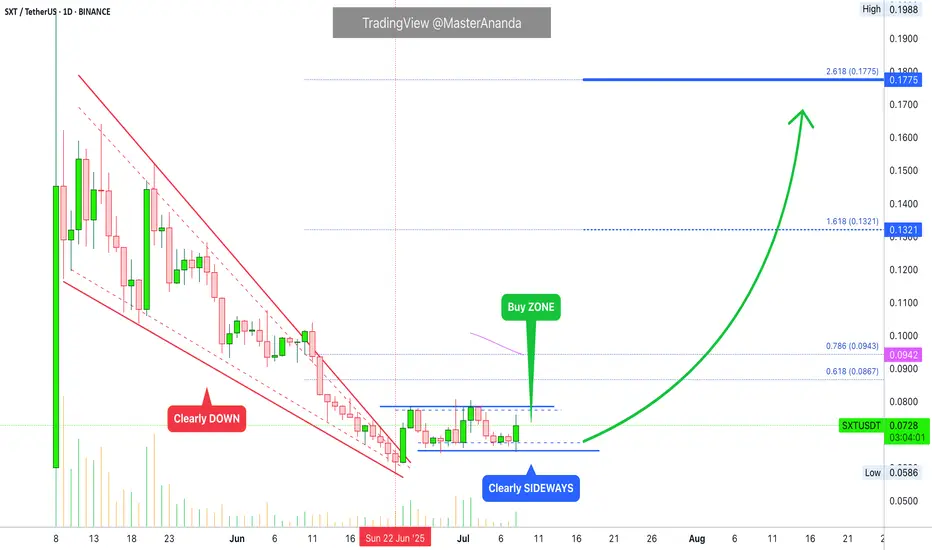
Space and Time Buy Zone: 1,000% or More Profits PotentialWhen the market is no longer bearish we know that something changed. We are going to be looking at the same price pattern we've been looking at on multiple charts.
Space and Time (SXT) was bearish, strongly bearish within a falling wedge pattern. On June 22 the bearish action ceased completely and the pattern broke. SXTUSDT went from clearly DOWN to clearly SIDEWAYS action. This is a huge change in price and candles pattern.
The highest bearish volume came in early May and later late May. As prices move lower, trading volume continued to decrease. As the ATL was hit, bear volume was really low. Lower lows with decreasing volume indicates the bearish move is losing force. Sure enough, the next day we get some green candles and volume starts to go up.
The market is changing, we are going from bearish to bullish and we are now in the transition period, prices moving within the buy zone.
This is the opportunity to buy within the accumulation range. The prices now are the best before a bullish breakout and major bullish run.
This looks like a good pair, the chart shows very low risk vs a high potential for reward. We are approaching the pair short-term because of the young chart, but you can buy and wait until prices grow. This pair can easily give 1,000% or more.
Namaste.