CoW Protocol About to Enter Bullish Zone (214% Easy Target)'Next target' has 484% profits potential. This target is projected to hit mid-term, that is, within 3 months (90 days)... Boost & keep reading below!
Good afternoon my fellow Cryptocurrency trader, I hope you are having a wonderful week and day.
COWUSDT is about to enter the bullish zone, when the action moves above EMA55. The magenta line on the chart.
This altcoin is already bullish because it is no longer bearish. The low happened 7-April and as you can see, the market has been sideways since early February. 150 days. More than 5 months.
Notice how daily trading volume is almost flat but some days stand out with increased buying. You see green bars shooting up but never red bars. This reveals a bullish bias. We are witnessing the early days before a major bullish breakout. One that will lead to 200% and up to 500% profits mid-term. Long-term, there can be more.
Thank you for reading.
Another easy trade, huge profits, easy chart. Buy and hold.
Namaste.
Crypto

Rose Network: Double-Up Within Weeks (PP: 435%)ROSE grew 130% between April and May, a relatively small wave. The peak happened at 0.04424. The low in April happened at 0.01920. The previous wave high in early December 2024 happened at 0.14260. As you can see, a relatively small wave. But this is good news.
In June we get a higher low compared to 7-April. A technical double-bottom. This double-bottom/higher low reveals a higher high next. This is why this is a good an easy setup. The next target is already confirmed. We can buy easily; no stress, fully relaxed, because we know prices will grow.
We know prices will grow because they grew in April and now we have the same low. The downtrend is no more and thus a new uptrend starts. 139% is the very easy target based on the short-term. Mid-term and long-term there will be so much more growth. 337% & 435%.
Thank you for reading.
I like this one. It is an easy win. Easy pair to double-up.
Namaste.

The best-looking HTF meme chart, hands down is $PENGUThe team behind the crypto mascot accomplished a lot over the last couple of weeks, and the TA is showing;
- CBOE filing for PENGU ETF
- Appeared at @Nasdaq
- Listed on @eToro
- Listed on @RevolutApp
- Listed on @Official_Upbit
- Listed on @WebullGlobal Pay
- @NASCAR Partnership
- PEZ x Pudgy Penguins Partnership
- Miles & More Partnership
- @PenguClash reached 2M+ on waitlist
- 1B views per day
All this and much more!
@pudgypenguins are doing it the right way 🐧

DOGE Long Swing Setup – Musk-Fueled Hype & Political BuzzElon Musk’s launch of the “America Party” is reigniting interest in his potential impact on crypto—especially Dogecoin. With his history of moving DOGE’s price, this political pivot could stir volatility and renewed upside. We’re watching for a dip into the $0.15–$0.16 zone for a possible long entry.
📌 Trade Setup:
• Entry Zone: $0.15 – $0.16
• Take Profit Targets:
o 🥇 $0.19 - $0.20
o 🥈 $0.23 – $0.24
• Stop Loss: Daily close below $0.13

ETH Long Swing Setup – Sideways Hold with Dip-Buy OpportunityETH continues to hold above the key $2,300 support, showing resilience and consolidating within range. We’re watching for one more dip into the $2,300–$2,375 zone to trigger a long entry, with momentum building for a potential breakout.
📌 Trade Setup:
• Entry Zone: $2,300 – $2,375
• Take Profit Targets:
o 🥇 $2,900 – $3,000
o 🥈 $3,300 – $3,400
o 🥉 $4,000 – $4,200
• Stop Loss: Daily close below $2,000

HolderStat┆XRPUSD targeting $2.4BINANCE:XRPUSDT is printing repeated consolidation zones and ascending structures. Price is currently rebounding above 2.20, eyeing a breakout toward 2.40. The bullish momentum persists with higher lows and breakout setups.

HolderStat┆SOLUSD seeks to the resistance lineBINANCE:SOLUSDT has broken out of a descending wedge and is coiling in a symmetrical triangle above 150. The setup supports a push toward 165–170, with momentum favoring bulls if the triangle resolves upward.

HolderStat┆BNBUSD forming the triangleBINANCE:BNBUSDT is approaching the apex of a symmetrical triangle pattern with strong support from 650. Repeated rebounds and higher lows indicate bullish pressure. A breakout above 665 could drive price to test the 695 resistance block.

BITCOIN - SELL TO $86,000 (8H VIEW)I see possible shorting opportunities right now for BTC.
⭕️LQ Swiped Above Previous Wave 3 High ($109,000).
⭕️Wave 4 Complex Correction Complete (5 Sub-Waves).
⭕️(Wave 5 Impulse Bullish Move Complete (5 Sub-Waves of 1,2,3,4,5).
❌Invalidation Zone Above Wave 5 High ($112,140).
High risk trade as BTC could still head high for Wave 5 around $120- $130,000. Use strict risk management.

HolderStat┆ADAUSD rising topBINANCE:ADAUSDT is breaking out of a falling channel, following a long consolidation period and bullish wedge development. Price action is coiling around 0.58–0.60 and may rally toward 0.65 if the breakout sustains. Historical patterns suggest continued strength from this structure.

Bitcoin Monthly · New ATH vs 2021, Indicators & MoreLast month Bitcoin produced its highest close ever, $107,146. The last three months all closed green, the close was higher than the open, and this is the fourth green month so far.
Bitcoin tends to produce a period of bullish consolidation before a major move, and this is exactly what we are seeing now. Bitcoin tends to produce a correction before a major bullish move, and this is exactly what happened between January and April. Bitcoin is set to grow.
Past action · consolidation
We already looked at the consolidation period that happens between each major price advance. Since 2022, Bitcoin has been moving sideways for some 200-220 days before each advance. This happened in 2022, 2023, 2024 and also now in 2025.
Looking at it from the monthly timeframe, the consolidation period was capped each time at 7 bars, 214 days. Current consolidation has already been going for more than 215 days. Bitcoin is set to continue growing.
Indicators · MAs, RSI & MACD
Bitcoin is trading above all moving averages. The monthly RSI is very strong, beyond 70.6.
The monthly MACD is moving at all-time high levels, trending up with room available for additional growth.
Chart patterns · candlestick reading
The chart patterns now has no similarities to 2021. Many people were saying that Bitcoin produced a double-top similar to 2021 and was set to move down. I completely disagree with this analysis.
In 2021 both instances when Bitcoin peaked the month ended up closing red. In 2025 the months when Bitcoin peaked the months ended closing green.
The same month the peak was hit in 2021 was followed by bearish action, twice. And of course, the bear market. In 2025 the market has been consolidating for months and trading near its all-time high.
Finally, in 2021 each peak was 7 months apart, 214. In 2025, the last two peaks are 4 months apart, only 120 days.
This difference is good to point out because market conditions are not the same. Not the same market conditions means that Bitcoin is not likely to go into a bear market now, instead, it can produce something difference. The market has only three directions: Down, sideways and up.
Down has been eliminated based on past action.
Sideways is happening now.
Something different only leaves the upside open; Bitcoin is going up.
Namaste.

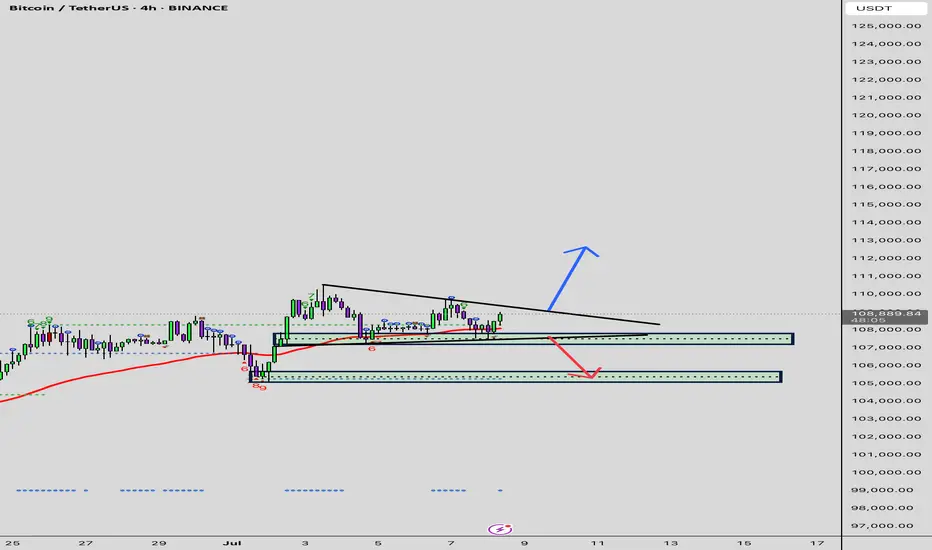
BTC/USD SCENARIO Bitcoin is trying to break out of the 110,000
If we break out we will see a new high
If we don’t break it we could see 105k possibly 100k
#OTHERS.D ~ Do you believe in Castles in the SKY?I believe that the Others dominance metric divided by an ounce of real money #Gold gives us a valuable insight into the fabled altseasons.
Because as this chart shows theres only been 4 in actuality
and you normal get a double bubble in a cycle.
So I believe we are at the cusp of turning things around as most people have given up on the concept of altcoins ever pumping again.
But it was just the business cycle #PMI that has depressed prices for the past few years.

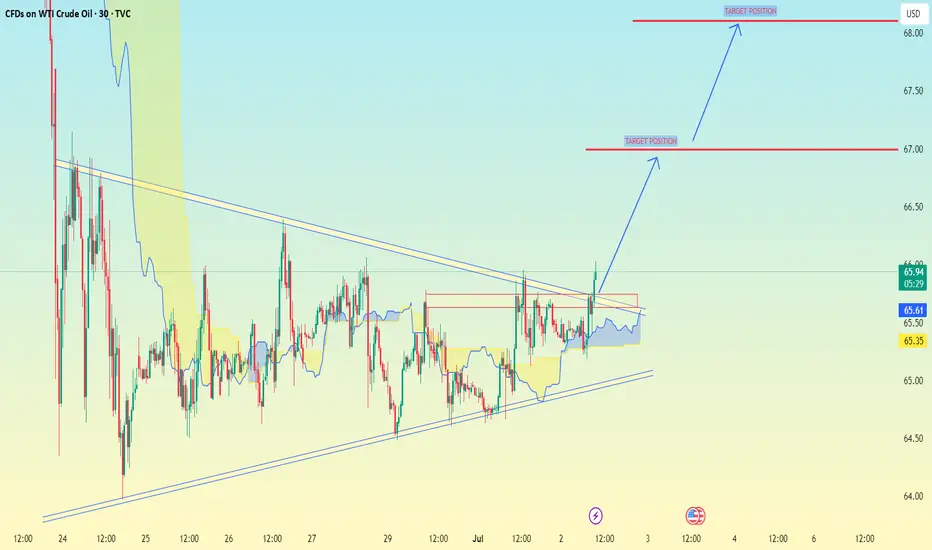
(WTI Crude Oil) on the 30-minute timeframe:(WTI Crude Oil) on the 30-minute timeframe:
You have a clear triangle breakout happening.
The chart shows two bullish target positions marked with blue arrows.
Based on your chart:
Current Price Zone: Around 66.20 - 66.25
Target Levels:
✅ First Target: 67.00
✅ Second Target: 68.00 - 68.10
---
Summary Trading Idea:
Breakout above resistance trendline confirmed.
First resistance and partial target at 67.00
Final target near 68.00 - 68.10, where the next significant resistance lies.
Let me know if you want stop-loss suggestions or a detailed entry strategy.
NZD/USD(New Zealand Dollar vs US Dollar) chart on the 1H timefrm NZD/USD (New Zealand Dollar vs US Dollar) chart on the 1H timeframe:
Price has broken below the ascending trendline and is now trading below the Ichimoku Cloud, confirming bearish momentum.
You already have clear two downside target levels marked on the chart.
Based on your chart:
✅ First Target: 0.60200
✅ Second Target: 0.59500
---
Quick Summary:
Bearish breakout confirmed.
Targets are positioned at 0.60200 and 0.59500.
As long as price stays below the Ichimoku Cloud, the bearish trend is valid.
Let me know if you want stop-loss or confirmation levels suggestions.

Ethereum H4 | Potential bearish reversalEthereum (ETH/USD) is rising towards a swing-high resistance and could potentially reverse off this level to drop lower.
Sell entry is at 2,601.80 which is a swing-high resistance.
Stop loss is at 2,700.00 which is a level that sits above a swing-high resistance.
Take profit is at 2,397.10 which is a multi-swing-low support that aligns with a 50% Fibonacci retracement.
High Risk Investment Warning
Trading Forex/CFDs on margin carries a high level of risk and may not be suitable for all investors. Leverage can work against you.
Stratos Markets Limited (tradu.com ):
CFDs are complex instruments and come with a high risk of losing money rapidly due to leverage. 63% of retail investor accounts lose money when trading CFDs with this provider. You should consider whether you understand how CFDs work and whether you can afford to take the high risk of losing your money.
Stratos Europe Ltd (tradu.com ):
CFDs are complex instruments and come with a high risk of losing money rapidly due to leverage. 63% of retail investor accounts lose money when trading CFDs with this provider. You should consider whether you understand how CFDs work and whether you can afford to take the high risk of losing your money.
Stratos Global LLC (tradu.com ):
Losses can exceed deposits.
Please be advised that the information presented on TradingView is provided to Tradu (‘Company’, ‘we’) by a third-party provider (‘TFA Global Pte Ltd’). Please be reminded that you are solely responsible for the trading decisions on your account. There is a very high degree of risk involved in trading. Any information and/or content is intended entirely for research, educational and informational purposes only and does not constitute investment or consultation advice or investment strategy. The information is not tailored to the investment needs of any specific person and therefore does not involve a consideration of any of the investment objectives, financial situation or needs of any viewer that may receive it. Kindly also note that past performance is not a reliable indicator of future results. Actual results may differ materially from those anticipated in forward-looking or past performance statements. We assume no liability as to the accuracy or completeness of any of the information and/or content provided herein and the Company cannot be held responsible for any omission, mistake nor for any loss or damage including without limitation to any loss of profit which may arise from reliance on any information supplied by TFA Global Pte Ltd.
The speaker(s) is neither an employee, agent nor representative of Tradu and is therefore acting independently. The opinions given are their own, constitute general market commentary, and do not constitute the opinion or advice of Tradu or any form of personal or investment advice. Tradu neither endorses nor guarantees offerings of third-party speakers, nor is Tradu responsible for the content, veracity or opinions of third-party speakers, presenters or participants.

Phemex Analysis #95: Pro Tips for Trading Stellar (XLM)Stellar ( PHEMEX:XLMUSDT.P ) is an open-source, decentralized blockchain platform specializing in fast, affordable cross-border transactions aimed at enhancing global financial inclusion. Its native cryptocurrency, Lumens (XLM), serves as a bridge for currency exchanges and is used to pay transaction fees on the network. Founded in 2014 by Jed McCaleb, Stellar connects banks, payment systems, and individuals worldwide, providing seamless and cost-effective financial interactions.
Recently, Stellar has shown positive market momentum, including a notable 5% price surge coupled with increased transaction volumes. A key catalyst for this optimism is PayPal’s upcoming integration of its stablecoin PYUSD onto the Stellar blockchain, significantly expanding Stellar's real-world use case and accessibility across more than 170 countries.
Given these promising developments, let’s explore several possible trading scenarios to help traders strategically approach XLM.
Possible Scenarios
1. Breakout Rise to $0.28 and Above (Bullish Scenario)
On the daily chart, XLM recently formed a clear "cup and handle" pattern, with the handle emerging around June 22. This classic bullish indicator signals accumulation of buying momentum. If XLM decisively breaks out above the critical resistance level at $0.257, particularly with strong trading volume, it could confirm a bullish continuation, potentially targeting resistance zones around $0.28, $0.312, and even the significant resistance at $0.43.
Pro Tips:
Entry Point: Consider entering positions after confirming the breakout above $0.257, ideally with significant volume confirmation.
Profit-Taking Levels: Aim to take partial profits at key resistance levels: $0.28, $0.312, and $0.43.
2. Rejection by Key Resistance Levels (Neutral Scenario)
While the immediate resistance at $0.28 is relatively weak and likely to be overcome easily, subsequent resistance at $0.312 and particularly at $0.43 could present strong selling pressure, potentially rejecting XLM’s first attempt.
If rejection occurs, the price will likely retrace to retest support zones, such as around $0.25, consolidating before attempting another bullish move.
Pro Tips:
Cautious Entries: If initial rejections occur at higher resistance zones ($0.312 or $0.43), consider waiting for price stabilization around lower support areas ($0.25) before re-entering.
Volume Check: Closely monitor trading volumes during retracements—declining volume often indicates a healthy pullback rather than a significant reversal.
3. All Things Go South (Bearish Scenario)
If broader market sentiment suddenly turns sharply negative—particularly driven by a significant decline in Bitcoin—XLM could face substantial selling pressure. A sharp drop below key support at $0.216 with high volume, accompanied by broader market downturns, would signal serious bearish momentum.
Pro Tips:
Market Observation: Stay cautious and consider stepping aside until clear stabilization occurs at lower support levels.
Accumulation Opportunities: Long-term holders should watch closely for stabilization at critical historical supports, including $0.20, $0.18, $0.12, and $0.09, which could offer attractive entry points for gradual accumulation.
Conclusion
Stellar (XLM) currently stands at a pivotal juncture driven by significant fundamental catalysts and compelling technical signals. By closely monitoring the outlined bullish, neutral, and bearish scenarios, traders can strategically position themselves for profitable trades while effectively managing risks. Always remain alert, employ disciplined risk management strategies, and stay informed on broader market movements to successfully navigate XLM’s market dynamics.
🔥 Tips:
Armed Your Trading Arsenal with advanced tools like multiple watchlists, basket orders, and real-time strategy adjustments at Phemex. Our USDT-based scaled orders give you precise control over your risk, while iceberg orders provide stealthy execution.
Disclaimer: This is NOT financial or investment advice. Please conduct your own research (DYOR). Phemex is not responsible, directly or indirectly, for any damage or loss incurred or claimed to be caused by or in association with the use of or reliance on any content, goods, or services mentioned in this article.

Dusk Network Major Buy Opportunity, 2020 Bull Market Revisited Today Dusk Network produced the highest buy volume since early February, a pretty good signal. On the weekly timeframe, the action is happening at extreme prices, the "opportunity buy-zone."
DUSKUSDT moved below all support from 2022, 2023 and 2024. The action is happening now at the exact same baseline levels from November 2020, before the last bull market.
» From its Oct. 2020 low (0.0359) DUSK grew 3,171%.
» From its Mar. 2020 low (0.0106) DUSK grew 10,978%.
The current low happened June 2025 at 0.0427. The bearish action preceding this date can be equated to what happened before March 2020. There is always strong bearish action preceding a major bull market.
The last bull market lasted 658 days, from bottom to top. From March 2020 until late December 2021. It is hard how to say how long the next bull market will last but a similar duration would lead to April 2027 being a major date.
A bull market can happen within 6 months, just as it can take years for the entire process to unravel. Since market conditions are so different now with all the innovation, adoption and expansion, we will have to wait and see.
The fact that we have the lowest prices in almost 5 years is also an interesting fact. All weak hands have been removed and this opens up maximum growth potential in the coming years.
I think we will have an extended bull market because it is already July 2025 and we have only very early signals, which means that it will take at least 4-8 weeks before full marketwide bullish action becomes the norm, August-September 2025. Activating 2026 minimum for new cycle tops.
Conclusion
Dusk Network is trading at bottom prices, a great opportunity to accumulate; buy and hold. The future is bright for this coin.
Namaste.

Solana Moving Averages: Patience is KeySolana is trading above EMA89 while at the same time trading below EMA55, we have a mixed situation. When in doubt, stay out. Anything is possible on this chart.
There was a major correction already that lasted 84 days. Solana lost more than 65% in this correction. A -67% drop. This correction removed all gains from 2024 sending prices back below $100. This is to say that Solana already went through a full and major flush.
The market could very easily continue lower and produce a lower low compared to 7-April, a major crash leading to August and I can easily see this scenario developing. Will it develop? Is it really necessary?
I can also see a slow but sure change of course. A few days red at the start of the week, as it is usual and then Boom!, the market turns green. And it grows day after day after day. It is already happening, patience is key. Better focus on the numbers.
» If Solana trades weekly above $142, we are bullish, strongly bullish and can expect additional growth.
» If Solana moves and closes weekly below $142, market conditions still remain bullish but we can approach this pair with caution.
» On a broader perspective, any trading above $95, the 7-April low, is bullish long-term. As long as this level holds, we can expect higher prices. The last low sits at $126...
It doesn't matter how you slice it, the price is good and is more likely than not to continue to increase. Patience is key.
Namaste.

Bitcoin Daily, Mixed Situation · Bitcoin vs Altcoins · Not MixedI came with the intention of doing an update on the weekly timeframe, the chart doesn't look great.
Here we are looking at Bitcoin daily and once more the situation is mixed to say the least. It is hard to predict with exactitude with such a chart. In this case, we have to look for clues in other places. The altcoins.
But before we go there let's consider a few of the actualities that are present on the Bitcoin chart.
Bitcoin price action
Mixed or not mixed, the action continues to happen at resistance against all odds; this is bullish.
Bitcoin is trading safely above $106-$107,000 daily, and this is also bullish.
Bitcoin is trading above all moving averages we track and nothing is more bullish than that. MA200 sits around $96,000. EMA55 at $104,700 and EMA13 at $107,700.
Bitcoin will be bullish regardless as long as it trades above these levels and at a such strong price. So the mixed part is only psychological. It is mixed because people are afraid of a drop or want to see it drop. It is bullish based on the actual numbers and the chart.
The altcoins market vs Bitcoin
Some altcoins are breaking up today two to three digits green. Those good old reputable projects. This wouldn't be happening preceding a major bearish wave. Such strong action on the altcoins tends to precede a major bull market. Last week there were other pairs breaking really strong, the previous week another group, this week a new group and so on. Slowly but surely the low prices are disappearing but this isn't still a marketwide occurrence, we can see/say that the market is in no hurry.
Another relationship between Bitcoin and the altcoins relates to how many are behaving; when Bitcoin is about to crash, the altcoins tend to crash really strong and fast. The altcoins don't wait and just go down and continue diving deep if Bitcoin is about to produce a major crash. But this isn't the case, many altcoins are already at bottom prices but not based on a crash but a very slow and drawn out retrace. From these lows they are recovering strong.
When Bitcoin is bullish, sideways with a strong price within a bull market, the altcoins tend to grow. It is the same signal looked at from a different perspective. These altcoins are telling us that behind the scenes Bitcoin is bullish and we know Bitcoin is bullish because it is trading above $107,000. A bullish continuation is the next logical step.
Thank you for reading.
Boost if you agree.
Namaste.

BEAMX NEW DAY TRADE VOLUMEBEAMX NEW DAY TRADE VOLUME
If the trend gets confirmation, we will follow this update with a live follow.

HolderStat┆AVAXUSD decline from the trend lineBYBIT:AVAXUSDT has reclaimed key support near 17.63 USDT and is testing the $20 barrier after bouncing from a falling channel. The structure is bullish with higher lows forming. If price breaks above $20, the next target lies toward 25 USDT.

HolderStat┆HYPEUSD forming the triangleKUCOIN:HYPEUSDT has entered a narrowing triangle formation with a bullish trajectory, forming higher lows from the 33 USDT base. Price is nearing resistance around 40 USDT, and if breached, the pattern projects continuation toward the 43.5 USDT level.
