GBPJPY BULLISH OR BEARIS DETAILED ANALYSISGBPJPY has successfully broken out of a long-term falling wedge on the weekly chart, and the bullish momentum is unfolding as expected. Price has rallied from 190.00 to the current 197.00 level, delivering solid profits from the breakout zone. This continuation setup is extremely strong, with the market respecting the wedge breakout structure and forming higher highs. As long as we hold above the 190.00 support, the bullish bias remains fully intact, with 205.00 as the next key upside target.
Fundamentally, the British pound remains well-supported due to the Bank of England’s hawkish stance. Despite softer inflation data, the BoE has signaled a cautious approach to rate cuts compared to other central banks, maintaining underlying GBP strength. On the other side, the Japanese yen continues to weaken as the Bank of Japan sticks with its ultra-loose monetary policy. Yen weakness is further fueled by rising US and UK bond yields, widening the yield differential and attracting carry trades into GBPJPY.
Technically, the breakout is unfolding with textbook precision. Price has cleared descending resistance, retested it, and is now building a new leg higher. The volume profile is supporting this bullish breakout, and market structure is confirming further upside. The 200.00 psychological level may act as a minor resistance, but once cleared, 205.00 is well within range and aligns with major Fibonacci extensions.
GBPJPY is also benefiting from increased volatility in risk-on sentiment, as equity markets remain firm and bond yields rise globally. Traders are favoring high-yielding currencies like GBP while shorting low-yielders like JPY. With the fundamentals and technicals now strongly aligned, this trade is well-positioned to deliver continued profits toward 205.00 and beyond.
Crypto

USDCAD BULLISH OR BEARISH DETAILED ANALYSISUSDCAD has just completed a clean falling wedge breakout—a classic bullish reversal pattern often signaling trend exhaustion. After months of consistent lower highs and lower lows within a well-defined wedge, price has now broken decisively above the descending resistance. The current price sits around 1.367, and we are confidently targeting the 1.407 level in the coming weeks. This breakout aligns perfectly with the seasonal USD strength historically seen in Q3, especially following soft Canadian economic data.
From a fundamental perspective, the Canadian dollar is facing downside pressure amid falling crude oil prices and softening domestic data. Canada’s most recent GDP growth came in below expectations, raising concerns around economic resilience. Meanwhile, the Bank of Canada is expected to remain dovish with growing speculation of another rate cut in the next quarter. In contrast, the US dollar has been gaining traction following stronger-than-expected ISM services data and a better-than-anticipated ADP employment report, supporting the Fed’s “higher for longer” stance on interest rates.
Technically, the breakout is further supported by increasing bullish momentum and a break of market structure on lower timeframes. We’re seeing volume confirmation with this push, adding conviction that buyers are stepping in with strength. The risk-to-reward ratio remains highly favorable here, and any pullback into the 1.36 zone would provide an excellent re-entry opportunity for continuation.
With sentiment shifting in favor of USD bulls and oil-related weakness dragging CAD, USDCAD looks primed for a rally. The 1.407 target aligns with both key resistance levels and Fibonacci projections from the breakout structure. Momentum is with the bulls, and this setup has the potential to deliver solid profits as we head deeper into Q3.
US

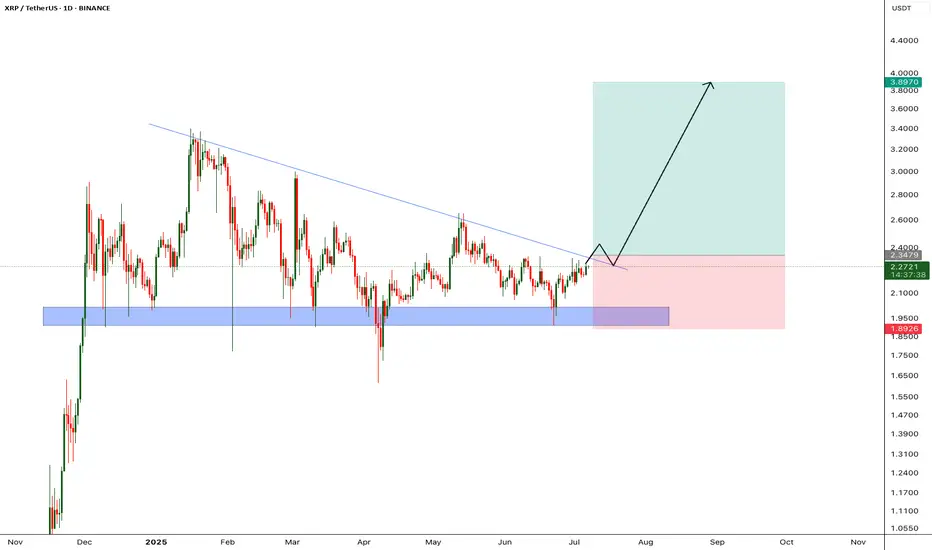
XRP - Huge breakout incomingXRP price is retesting it's descending trendline, in the past price got rejected from this trendline multple times, however im expecting price to breakout from this trendline since we almost at the last 2 quarters of bull run.
We will enter the trade after candle closes above the trendline
Entry Price: 2.34
StopLoss: 1.89
TP1: 2.5981
TP2: 2.8543
TP3: 3.2796
TP4: 3.8676
Like and follow.
Cheers
GreenCrypto
BNB Stuck in Barrier Triangle?CRYPTOCAP:BNB appears to be in a macro wave 4 barrier triangle, and for some time.
It has held up particularly well during the alt coin massacre, not even reaching the .382 Fibonacci retracement.
Price is testing the upper boundary for the 4th time, that starts to give us the higher probability breakout which increases with each test. The daily 200EMA and pivot were tested as support successfully.
Safe trading.

$FET Ready for the next move up?NYSE:FET looks ready for the next move up with a similar analysis to many other alts I have shared.
It is breaking out of descending resistance after testing the .618 Fibonacci retracement and High Volume Node (HVN) as support. Price broke above the daily pivot and is now swinging below, a recovery above the local swing high will be a bullish signal to go long with a wave 3 target of the R3 daily pivot and major resistance HVN at $1.13.
Analysis is invalidated below $0.54
Safe trading

$HBAR Ready for a move up?CRYPTOCAP:HBAR appears to have completed its wave 2 WXYXZ complex correction
It has broken its descending resistance & daily pivot, retested both as support and is approaching the local swing high which would be a bullish long signal.
Cautious traders may want to take partial take profit at the first resistance High Volume Node and R1 pivot $.18 and a secondary target with good RR is the swing high resistance node at $0.22.
Analysis is invalidated below $.14 swing low.
Safe trading

POLKADOT on last supportI think $3 is the very strong support for DOT, and the blue zone will hold, and i believe $18 resistance is very reachable for the next few months after $10 resistance got broken.

$ETH Breakout this week?CRYPTOCAP:ETH local chart looks ready
I think were looking at a decent ETH breakout this week to the next resistance High Volume Node at $3600 minimum target.
👉 BTC is consolidating under all time high resistance after multiple tests which is usual a sign of bullish continuation. Usualy giving alts room to room.
👉 Ethereum is above the daily 200EMA, daily pivot and also consolidating under resistance once more after testing the 0.382 Fibonacci retracement and S1 daily pivot adding confluence to that being the local bottom. This appears to be Elliot wave 2, a shallow wave 2 retracement (less than 0.5) is a show of strength and investor impatience.
Analysis invalidated below the daily pivot and daily 200EMA as this will lock in 3 waves up and look corrective.
Safe trading

$NEAR Disappointing so far...CBOE:NEAR is disappointing me as it continues towards the lows
Testing the .786 alt-coin golden pocket High Volume Node so should see a decent reaction from here as it appears a an ABC correction is complete after an Elliot wave motif wave.
Safe trading

CelesTIA, All-Time Low Last Month, Trend Change—2025 Bull MarketI am showing multiple charts but my prediction is that the market will turn—the entire Cryptocurrency market—the altcoins market will turn bullish.
CelesTIA
There is an uptrend between late 2023 and early 2024, the same with the rest of the market. There was also a bullish wave late 2024. Huhhh, there will be an uptrend in late 2025 and early 2026.
Ok. Celestia. TIAUSDT.
It is easy to distinguish the downtrend vs no more downtrend.
The period drawn orange did produce lower lows but it is very different compared to the "downtrend," red on the chart.
So this is the transition. Strong down, then sideways, then up.
This pair is producing lower lows in its consolidation period but I also showed you many pairs that are producing higher lows, it makes no difference. Lower lows or higher lows, the action is very different compared to the "downtrend." The downtrend is no more.
My thesis concludes with a change of trend. This is where everything is leading, hundreds and hundreds of charts, more than 500 since 7-April. They all say the same.
In short, these hundreds of charts are saying that the market is about to become extremely bullish and that is something that we welcome with open arms. Actually, we have been waiting patiently, and some not so patiently, for this change to occur.
Many trust me; trusted me;
Many doubted me and that is also ok.
I love the truster and the doubter...
I love the reader and the follower...
I love TradingView and the Cryptocurrency market; but I will be proven right in the end.
I accept the fact that it is impossible to get it always right. I accept the fact that many times I am so, so very wrong.
You have to accept the fact that time is running out, Crypto is going up.
Celestia just hit a new all-time low and this is awesome news for me and for you, because, from this bottom low we will grow. You can mark these words... Just watch!
I would like to take just a few seconds of your time to say, thank you. Time is precious, and you took the time to read this long. If you enjoy the content, make sure to follow.
Thanks a lot for your continued support.
There is only one Cryptocurrency market, this is us.
It is you and me, it is all of us. It is not the whales or the exchanges. We are the whales and the exchanges. We are the government, the institutions, the programmers, the designers; the owners, the planners, the coders, the security expert, the writer, the reporter, the auditor; the professor, the mom, the father and the son. You are the market. You are it. You are the whole thing, the whole world.
You might think yourself unimportant as just a tiny ray of light, but there is no life without the sun. You being light, you permeate everything that exist around us. So you are the Cryptocurrency market. You are Bitcoin and you are the altcoins.
Namaste.

Notcoin: The Market Always Changes Direction, Change of TrendIt is amazing, people tend to give up right before the market is about to change. I am not blaming anybody because I can fully understand. I sold everything November 2022, truly at the market bottom, but life conditions didn't allow for anything else, so I can understand those that are in a similar situation. I can see many people giving up, folding everything, selling, closing, leaving, right at the market bottom; right before the market is about to turn.
It does happen and nothing can be done about it but normally we go through this experience just one, or twice, or thrice but not forever more. Yes, we can give up because things just seen hard or even impossible but everything changes for the better when you least expect it.
When the worst is reaching its end, it gets really bad, pretty bad... In this market, a major crash, a flush and when you think you can't take it anymore it happens that you are witnessing the bottom.
Please, do not give up. If you must, go ahead... Take a break, recharge and come back. if you have the chance to stay around and stick around for a few more months, the market will reward you for your patience and persistence... Nobody said it was going to be easy, but once the positive side materializes it will be worth the hard work.
Anyway... Here we are looking at Notcoin once more. A new all-time high for sure.
I never take into consideration the first candle, the launch date because this date can be incredibly wild. I just don't trust the high and the low. But there is a high 2-June and based on this high I am certain we will get a new all-time high. This is my guess only of course, my opinion but it is based on years of experience.
Without a new all-time high we have 1,400% profits potential from current price. With 5X, you get 7000%. With 8X...
I mean, high risk vs a high potential for reward, that's leveraged trading, but you can always approach this pair spot with minimum risk and still, an amazing potential for huge rewards.
Never give up. Don't give. I don't give up, I can't understand what the word means anyway.
Yes, when it gets really hard... Just right around the corner, the next step, that's when you are closer to success. If you give up today, it means the goal could have been reached the next day. So never give up, you never know when everything will change right when the sun comes up.
We are already here... It is already happening....
You can count with my continued support. Forever and then some more.
Thank you for reading.
Your comment is appreciated.
Let me know what you think.
Namaste.

Bitcoin H4 | Rising into a swing-high resistanceBitcoin (BTC/USD) is rising towards a swing-high resistance and could potentially reverse off this level to drop lower.
Sell entry is at 111,747.48 which is a swing-high resistance that aligns with a confluence of Fibonacci levels i.e. the 78.6% projection and the 127.2% extension.
Stop loss is at 113,000.00 which is a level that sits above a confluence of Fibonacci levels i.e. the 100% projection and the 161.8% extension.
Take profit is at 108,698.22 which is an overlap support.
High Risk Investment Warning
Trading Forex/CFDs on margin carries a high level of risk and may not be suitable for all investors. Leverage can work against you.
Stratos Markets Limited (tradu.com ):
CFDs are complex instruments and come with a high risk of losing money rapidly due to leverage. 63% of retail investor accounts lose money when trading CFDs with this provider. You should consider whether you understand how CFDs work and whether you can afford to take the high risk of losing your money.
Stratos Europe Ltd (tradu.com ):
CFDs are complex instruments and come with a high risk of losing money rapidly due to leverage. 63% of retail investor accounts lose money when trading CFDs with this provider. You should consider whether you understand how CFDs work and whether you can afford to take the high risk of losing your money.
Stratos Global LLC (tradu.com ):
Losses can exceed deposits.
Please be advised that the information presented on TradingView is provided to Tradu (‘Company’, ‘we’) by a third-party provider (‘TFA Global Pte Ltd’). Please be reminded that you are solely responsible for the trading decisions on your account. There is a very high degree of risk involved in trading. Any information and/or content is intended entirely for research, educational and informational purposes only and does not constitute investment or consultation advice or investment strategy. The information is not tailored to the investment needs of any specific person and therefore does not involve a consideration of any of the investment objectives, financial situation or needs of any viewer that may receive it. Kindly also note that past performance is not a reliable indicator of future results. Actual results may differ materially from those anticipated in forward-looking or past performance statements. We assume no liability as to the accuracy or completeness of any of the information and/or content provided herein and the Company cannot be held responsible for any omission, mistake nor for any loss or damage including without limitation to any loss of profit which may arise from reliance on any information supplied by TFA Global Pte Ltd.
The speaker(s) is neither an employee, agent nor representative of Tradu and is therefore acting independently. The opinions given are their own, constitute general market commentary, and do not constitute the opinion or advice of Tradu or any form of personal or investment advice. Tradu neither endorses nor guarantees offerings of third-party speakers, nor is Tradu responsible for the content, veracity or opinions of third-party speakers, presenters or participants.

Bitcoin (BTCUSD) - Daily Price Uptrend, Resistance Breakout TestBitcoin (BTCUSD) has been in a recent Daily price Uptrend, rallying up from the $100,000 price support level.
A SMA Golden Cross printed on May 21st, 2025.
Bitcoin price is attempting a resistance zone test and has yet to breakout and hold above the $111,000 to $112,000 price zone.
Resistance levels: $110,000 , $112,000 , $117,000 , $121,000.
Support levels: $108,000 , $107,000 , $105,000 , $104,000 , $100,000.
Recent crypto industry, government legislation news, and institutional crypto purchases have helped to keep Bitcoin price above $100,000 support.
Stock market correlation volatility could also affect the crypto market and prices for the next 30 to 45 days.

Stellar 2025 Bull Market, ATH Targets, Price Action & MoreA very interesting chart. What is interesting here is how obvious it is that the correction is over. Stellar produced a massive bullish breakout in November 2024, more than 700% growth. After a strong move, there is always a correction. After the correction ends, we get the resumption of the initial move, in this case a bullish wave.
The 0.786 Fib. retracement level worked as support. 7-April. There is an interesting dynamic around this level. Back in July 2023 as XLMUSDT was rising resistance was found around 0.2000. Very close to this level. We then had the late 2024 bullish wave and the correction that ended in early April this year. Support was found exactly at the 0.786 Fib retracement level and this level matches 0.2000. This is the purple line on the chart. Resistance turned support.
After this support zone was hit and confirmed Stellar moved to produce an initial breakout and on the 16-June week, 22-June, we get a higher low. This higher low signals the start of the next bullish wave with a target around 0.9100. This is the next target for the current move but not necessarily where the bull market cycle will end. Can be but not necessarily, the action can move higher.
Growth potential from current price to our target goes to 257%. Coming from the August 2024 low, this same target would give a total of 1,099%. Seeing how strong the first jump was, it is likely that Stellar will go higher in this 2025 bull market.
We have another target between $1.25 and $1.35.
Let's focus on the market and the bigger picture.
Stellar has already proven that it will be a top performer in this cycle. Back in late 2024 XLM outperformed many projects, we can expect the same pattern to repeat in this bullish continuation.
The fact that there are no new lows also signals strength. We saw many pairs hitting new all-time lows in April and June, this is not the case here. And this is also good.
This is a proven project so it is easy to go in big.
Last time the meat of the move unraveled in just two weeks. Something also to keep in mind. Something similar would allow us to profit from the entire XLM wave and then browse the market for new opportunities.
Remember, the market is set to grow for 6 months in the least or it can extend and grow for years. While some pairs go down, others will be going up. When some pairs stop going up, others being down will recover and grow. The market will cycle between this and that, here and there; in the end, everything grows; that's the definition of a bull market. A rising wave lifts all boats.
Notice the long-term consolidation phase, it lasted more than 900 days and then we had a very strong bullish breakout. The longer the consolidation phase, the stronger the move that follows. This is only the beginning, there will be more.
Thank you for reading and for your continued support.
Namaste.

Ethereum | ETH | Long at $2,598.77Currently within my historical simple moving average area and consolidating. I suspect a move up is imminent, but 100% speculation. Crypto "bros" know more than I do.
Targets into 2028:
$4,000 (+53.9%)
$5,500 (+111.6%)

Optimism Extreme BUY: Easy 1277% Profits Potential—Can Go HigherOptimism is now moving within a "extreme BUY" zone. This is a price zone that was active only once between June and July 2022, one month only and then OPUSDT went on a massive rally. Total growth amounting to more than 1,111% from bottom to top.
This zone has been activated again for a little over one month and I believe it won't remain valid much longer. There is room for a new wave of growth but this time much more than 1,111%.
The target shown on the chart is a good one but I believe this trading pair/Cryptocurrency project can go higher when all is said and done.
Technical analysis —Bullish based on price action
On the 16-June week, 22-June specifically, Optimism (OPUSDT) hit its lowest price yet. 0.457. This is just a bit higher compared to the all-time low June 2022 at 0.396. We can easily say the bottom is in as this week the action is back above its 7-April 2025 low.
Higher targets
The next high target sits at $12, giving us a 2,078% potential for profits from current price. 0.551 at the time of writing.
Previous cycle vs current cycle
Optimism's first bullish cycle lasted 630 days. The next cycle, the one that is about to start now, can last an entire year, eight months... We are entering uncharted territory so it is hard to say.
One thing I can say based on TA is that this new wave will be much more steep compared to the last one. The climb will be really fast, it will be hard to adapt.
How to trade to maximize profits
The best way to approach this pair for sure success is by buying when prices are low, now. This would secure a smooth ride and happy profits on the way up.
If you are reading this now, your timing is awesome because we are looking at a bottom catch, this type of opportunity is only seen once every several years. For example, the last time OPUSDT traded this low was in mid-2022, three years ago. Once the bullish wave takes off, there is no going back. Once the bulls are in, low prices will be forever gone.
Thanks a lot for your continued support.
Namaste.

Dogs: Friendly Reminder, Bullish Wave in the Making (5-8X Lev.)We looked at Dogs rencelty, DOGSUSDT, and market conditions continue to improve. The higher low is confirmed and the action is turning bullish now with Bitcoin trading near a new all-time high. This is a friendly reminder.
This is the last chance to join the wave before a major advance. We are about to witness long-term growth and this chart setup can be approached with 5X, relatively low risk and up to 8X which is higher risk but also a higher potential for reward.
Make sure to do your planning as leveraged trading should be approached by experts only, not recommended for beginners.
How to trade
Very easy, buy and hold. Set up your position and then wait patiently. As soon as the trade reaches 200-300% profits, secure it. Once the profits reach 500-800%, you can close your position and go find a new chart setup, or you can continue to hold long-term as your trade is already secured from the first advance.
There are many more ways to approach this and other pairs, this is just one example.
Plan ahead of time. Aim high. Hold strong.
Wishing you great success and huge profits.
Thanks a lot for your continued support.
Namaste.

PRCL/USDT NEW INCREASE VOLUMEPRCL/USDT NEW INCREASE VOLUME
it shows new volume depending on the 1H volume. Since this unexpected volume, there isa new follow for this coin.

Toncoin Bullish Breakout Confirmed —8X Lev. PossibleLook at the volume today, it is the highest since late May. This high volume coupled with a big bullish candle confirms two things: 1) The higher low is in and 2) the next bullish wave starts now.
There is no other way things can develop. The chart is the market. The chart reveals everything you need to know. Toncoin's chart is revealing buying pressure right now, after a higher low. Now that the higher low is confirmed this means the bullish wave we have been expecting is underway.
This is the last chance. A great opportunity. This chart setup can be approached with leverage, easily with 5X. Can be more just as it can be less. Make sure to plan ahead.
Aim high —A new all-time high
Do not sell after 100% growth, the market will grow much more. Here there is an easy target open with 222%, this level should be achieved mid-term. Long-term, expect maximum growth.
The altcoins market will be growing straight up, month after month after month.
This is just a friendly reminder. Get back in the market.
Buy and hold.
Thanks a lot for your continued support.
Namaste.

XRP $2 Support Updated, Tested 12 Times & When BullishThere is one number, a price level, that defines XRP's current situation. Either bearish or bullish depends on this number: $2.
As long as XRPUSDT trades above $2, we know the bulls have the upper hand and the bullish bias is confirmed.
If XRPUSDT moves and closes below $2, we know the bulls are losing momentum, the bears are gaining the upper hand and lower prices are possible.
What is the current situation?
XRP continues to trade above $2 and this price continues to be left behind, meaning, the bulls are winning.
Before 7-April, this level was tested over and over, again and again. After 7-April, only two challenges and the last one, 21-June, ended as a perfect bullish hammer. Now the action is moving higher toward resistance, growing not lower. $2 has been confirmed as support.
Now that support has been confirmed, we can expect additional growth. It can take some time, maybe a few days but the bulls are in control.
It can take some time, not that long, the market has been sideways for more than 7 months. This is a long-time and no more is needed. The consolidation period just reached its end.
The final low happened late last month, Crypto is set to grow; XRP will be doing great in a matter of days. Closer than anything you can think or expect, next week can be boom, sellers are exhausted. People are back to work.
Thank you for reading.
We are about to experience a growth explosion.
Namaste.

From BONK to Boom: Is This a Full Impulse?If you find this information inspiring/helpful, please consider a boost and follow! Any questions or comments, please leave a comment!
BONK: Watching the Impulse Unfold
Looks like BONK may have bottomed at 887, where it kicked off what appears to be an impulsive move up.
The retrace that followed was suspicious—plenty of ways to count it depending on your lens—but price action eventually started hinting at a 12-12 or zigzag-style crossroad. That indecision resolved quickly once BONK cleared 1511, shifting the structure firmly back into bullish territory.
Now trading around 2242, the behavior is aligning with what you'd expect from a wave 3: strong momentum, vertical lift, and minimal resistance. It’s moving like a third wave should.
That said, there’s some heavy resistance sitting overhead at 2506, and it could stall or even reject price short-term. If it does, the next thing I’ll be watching is how price reacts—specifically looking for a clean wave 4 pullback and a final push into wave 5.
If we see that 4–5 structure play out at multiple degrees, it would go a long way toward confirming this whole move as a completed impulse off the low.
For now, this one stays on watch for the next setup.
Trade Safe!
Trade Clarity!

BTC - Bulls Getting Ready!!Hello TradingView Family / Fellow Traders. This is Richard, also known as theSignalyst.
📈BTC has been bullish trading within the flat rising wedge marked in blue and it is currently retesting the lower bound of the wedge.
Moreover, the orange zone is a strong demand.
🏹 Thus, the highlighted blue circle is a strong area to look for buy setups as it is the intersection of demand and lower blue trendline acting as a non-horizontal support.
📚 As per my trading style:
As #BTC approaches the blue circle zone, I will be looking for bullish reversal setups (like a double bottom pattern, trendline break , and so on...)
📚 Always follow your trading plan regarding entry, risk management, and trade management.
Good luck!
All Strategies Are Good; If Managed Properly!
~Rich

Banana zone starts when PMI is above 53.Check your charts to verify this fact.
Total 2 with the US Purchasing Managers Index overlain.
The PMI is one of the most reliable leading indicators for assessing the state of the U.S. economy.
Previous Banana zones have coincided with the PMI above 53.
so not just when the economy is growing, but when the economy has entered humming along approaching full acceleration.
This is when most people will feel confidence and WANT to take on more risk as they are most optimistic about the future when the economy is in this state of being.
