Bitcoin - An Epic Move Awaits!Bitcoin gained 13% in H1 2025, outperforming Ethereum and Solana, which dropped ~25% and ~17% respectively—highlighting BTC's strength in turbulent market conditions.
Institutional wedge: spot-BTC ETFs saw huge inflows—BlackRock’s took in $336M, and total crypto product inflows approached $45B+ this year.
AI models foresee BTC holding $105K+ by end-June, with ChatGPT pointing to $118K and Grok forecasting $108K, based on momentum and ETF flows.
We see BTC holding the 20 MA and spiking to new all time highs.
Crypto

Bitcoin - Price struggles below resistance, correction to $104k?This 4-hour chart for BTC/USD illustrates a detailed technical analysis scenario highlighting key resistance and support zones, as well as a critical fair value gap (FVG). The chart shows that Bitcoin is currently facing strong resistance in the $108,000 to $109,000 range. This area has been tested multiple times without a successful breakout, indicating significant selling pressure. The price is currently trading just below this resistance zone, struggling to gain momentum above it.
Support zone in the consolidation
A clear support level has been marked in the recent consolidation area around $106,000. This zone has served as a short-term base during the recent upward movement, and a retest here could provide a temporary bounce or pause in bearish momentum. However, if this support fails to hold, the next major area of interest lies within the 4-hour bullish FVG between approximately $103,000 and $104,000.
4H FVG
There is a clear 4-hour bullish FVG between approximately $103.000 and $104.000. This level can act as a strong support for buyers after filling up the inbalance zone. it is highly important to hold this level as support and not to break below it.
Upside potential
On the upside, if BTC can defend the support in the consolidation zone and reclaim momentum, a push back to the $108,000 to $109,000 resistance area is probable. A successful breakout above this zone would invalidate the bearish scenario and may trigger a bullish continuation, with the potential to reach higher targets such as $111,000 or beyond.
Downside risk
The downside risk becomes more pronounced if BTC breaks below the 4H FVG. A sustained move beneath this level would likely signal weakness in buyer interest and potentially open the path to deeper downside targets. In such a scenario, the price could accelerate lower toward the psychological support level at $100,000. This round number also carries technical and emotional significance for traders, which could create both a strong support area and potential buying interest.
Conclusion
In conclusion, Bitcoin remains at a critical juncture. The key levels to watch are the support within the current consolidation and the 4H FVG imbalance zone. A breakdown below the FVG could lead to a decline toward $100,000, while holding above these levels keeps the door open for another test of resistance at $108,000 to $109,000. A breakout from there would indicate bullish strength and a shift in market sentiment. Traders should remain cautious and reactive to how price behaves around these critical areas.
Disclosure: I am part of Trade Nation's Influencer program and receive a monthly fee for using their TradingView charts in my analysis.
Thanks for your support.
- Make sure to follow me so you don't miss out on the next analysis!
- Drop a like and leave a comment!

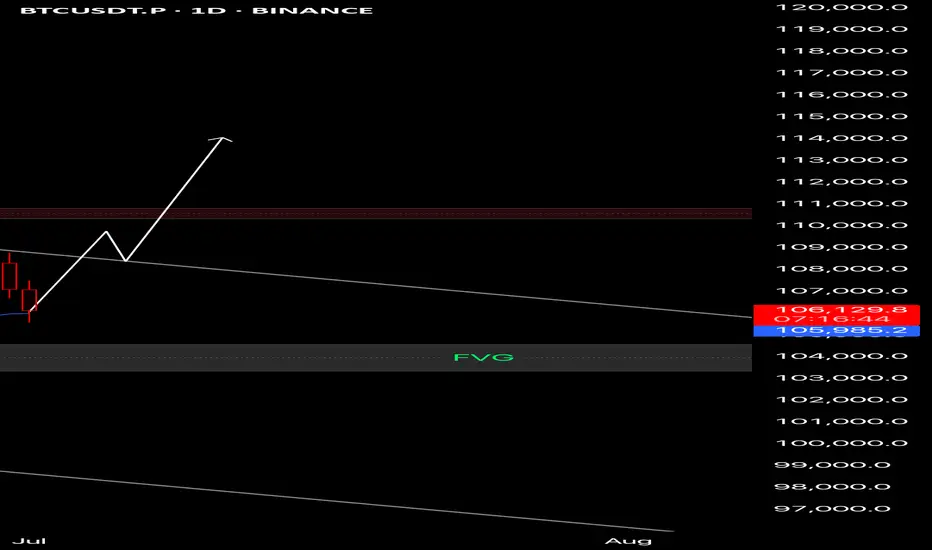
BTC 1D Analysis📊 BTC 1D Analysis
Price is respecting the channel and currently holding the 21 EMA as dynamic support.
If we see a strong daily close above the descending resistance, it may trigger a breakout toward the $110,000–$112,000 zone.
Key levels:
🔹 Support: $105,980
🔹 Resistance: $110,800
Bias: Bullish if breakout confirms
Watch the next 1–2 candles for confirmation.
🔔 Set alerts – don’t chase!
#BTC #Bitcoin #CryptoAnalysis #TradingView #CryptoSignals #DYOR
XMR Long Swing Setup – 50% Retrace with Structure ShiftXMR rallied from $200 to $400 and has now pulled back 50% of that move. With price reclaiming the 20-day SMA and a recent structure shift, there’s a solid setup forming with ~60% probability of continuation.
📌 Trade Setup:
• Entry Zone: $305 – $315
• Take Profit Targets:
o 🥇 $360
o 🥈 $400
• Stop Loss: Daily close below $300

Bitcoin can turn around from seller zone and start to declineHello traders, I want share with you my opinion about Bitcoin. The price previously broke above the support line and made a strong bullish move from the buyer zone (99300–100500 points). After the breakout, the price started rising steadily and is now approaching the Seller Zone (108500–109500), which also coincides with the resistance line of the downward channel. This area has shown strong bearish pressure in the past. Every time the price entered this zone, it quickly reversed. It’s a key area where many traders seek short-term opportunities. Currently, price is just entering this zone again and showing early signs of weakening momentum. Given the channel's structure, past price behavior near this resistance level, and the presence of the seller zone, I expect BTCUSD to turn around soon. Once the price rejects this level, I anticipate a reversal and a move back into the channel, continuing the downward trajectory. My first target is set at 103000 points, near the center of the range and above the support level (100500). This area has been tested multiple times before and may act as a strong buffer again. Please share this idea with your friends and click Boost 🚀
Disclaimer: As part of ThinkMarkets’ Influencer Program, I am sponsored to share and publish their charts in my analysis.

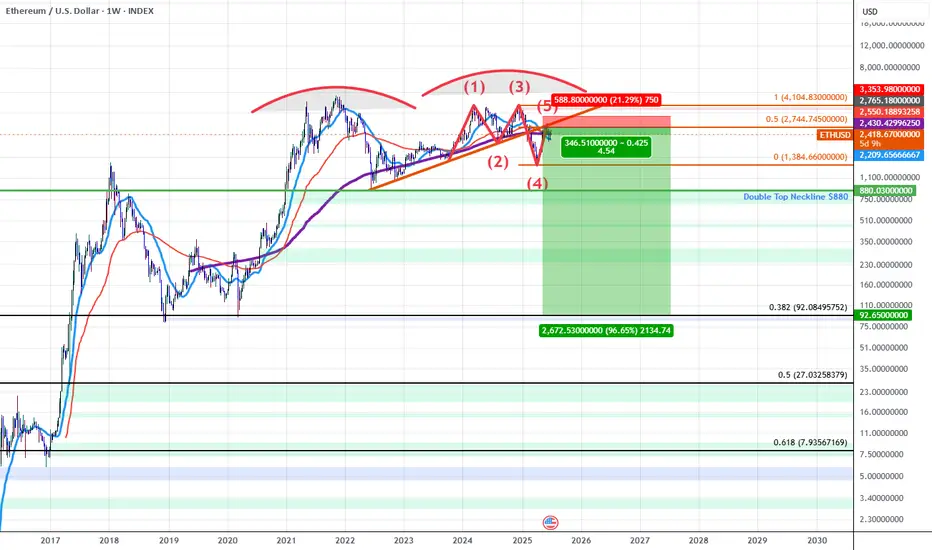
ETHUSD: Double Top into A Bearish 5-0 BreakdownETH for the last 5 years has been developing a Double Topping pattern which has put in a series of lower highs during the most recent 2nd run up. As we've confirmed these lower highs we've broken down below trendline and found resistance at the trendline which happens to have confluence with the PCZ of a Bearish 5-0 wave formation.
As we begin to find weakness and Bearish price action begins I suspect price will make it's way towards the neckline of the double top aligning with the $880 price level if ETH breaks below that level there will be no significant support until it reaches the all-time 0.382 retrace down at around $92.10.
In short it seems ETH is in the early stages of a macro breakdown which could result in value declines greater than 80%.
HolderStat┆BTCUSD forming the triangleBINANCE:BTCUSDT has reclaimed the $106,000 support and broken out of a triangle structure. The path now leads toward 111K, a major resistance zone. Similar setups have triggered strong rallies before, and bulls are defending levels aggressively.

HolderStat┆ETHUSD fixed above the supportBINANCE:ETHUSDT broke out from a triangle and is holding above the 2,447 zone. The current ascending structure targets 2,700 in the near term. Reclaiming short-term resistances confirms a bullish reversal from recent lows, similar to past triangle breakouts.

HolderStat┆XRPUSD before retest of the $2 levelBINANCE:XRPUSDT has rebounded from its 2.08 base and broken out of consolidation, aiming for the upper diagonal resistance near 2.40–2.60. With recurring bullish patterns and a history of strong follow-through after similar setups, momentum may build if 2.20 is cleared.

HolderStat┆SOLUSD aims for the $170 levelBINANCE:SOLUSDT has broken above triangle resistance, retesting the $146.60 level as new support. The breakout echoes earlier consolidation-based rallies, opening the path toward $170. As long as the structure remains intact, bulls could extend the climb over the next few sessions.

HolderStat┆ADAUSD formed rising bottomBINANCE:ADAUSDT has formed a symmetrical triangle after finding firm support around 0.54. Previous consolidation zones have led to significant breakouts, and the current structure is showing early signs of a similar rally. If bulls manage to reclaim 0.58, a climb toward 0.66 and 0.70 becomes likely, with upper trendline resistance acting as a magnet for price.

XAU/USD (Gold vs. US Dollar) 4h chart pattern XAU/USD (Gold vs. US Dollar) on the 4-hour timeframe displays a bullish cup and handle pattern forming, with a breakout above the handle resistance and Ichimoku cloud.
Technical Observations:
Cup and Handle pattern indicates bullish continuation.
Breakout has occurred above trendline and handle.
Price is trading near $3,350 (approx).
Two upside TARGETS are marked on the chart.
---
🎯 Projected Targets (Approximate):
Based on your chart:
1. First Target (TP1): Around $3,390 - $3,395
2. Second Target (TP2): Around $3,425 - $3,430
These targets align with the measured move of the cup height projected from the breakout level.
---
✅ Confirmation:
Price is above the trendline and trying to hold above the Ichimoku cloud.
Entry would be ideal on a pullback to the breakout zone (~31,335-$3,340) for lower risk.
Stop-loss can be considered below the handle low (~$3,310 or $3,305).
Let me know if you want Fibonacci-based targets or support/resistance levels as well.

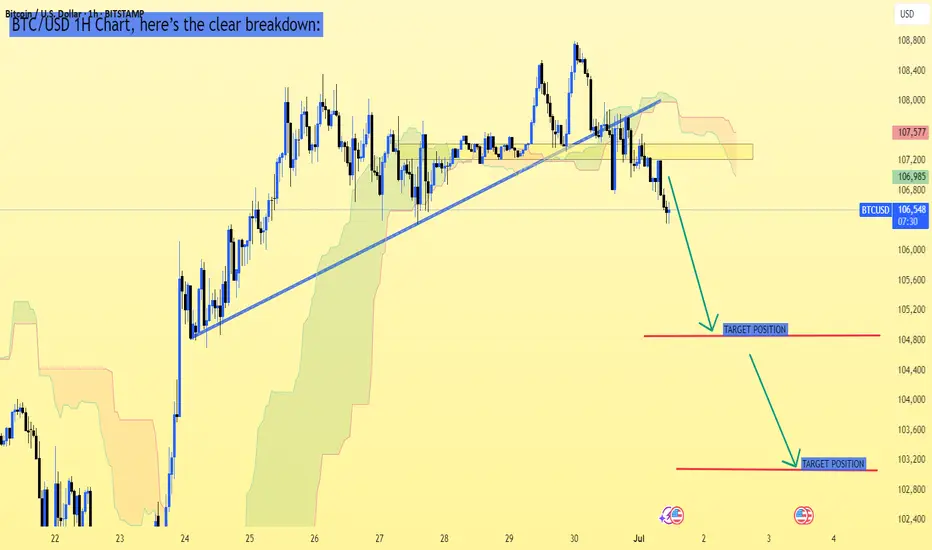
BTC/USD 1H Chart, here’s the clear breakdown:BTC/USD 1H Chart, here’s the clear breakdown:
---
Current Price:
Around 106,636 USD
---
Bearish Setup Observations:
Price has broken the ascending trendline support
Price is below Ichimoku Cloud — bearish confirmation
Retest of broken trendline area failed, suggesting more downside
---
Target Levels Based on Your Chart:
✅ First Target: Around 105,200 - 105,400 USD
✅ Second Target (Final Target): Around 103,200 - 103,500 USD
---
Conclusion:
Bearish momentum is strong; watch for price to test 105,200 zone
If that level breaks, likely move toward 103,200
Resistance area remains near 107,200 - 107,500 (good stop-loss zone for shorts)
---
Would you like a risk management suggestion for this setup? Let me know!
Silver (XAG/USD) on the 1-hour timeframe.Silver (XAG/USD) on the 1-hour timeframe, the chart shows a bullish breakout from a symmetrical triangle pattern. Here's the target breakdown:
📈 Silver Bullish Targets:
Current Price: Around 36.42
1st Target (TP1): Approximately 36.95 – 37.00
2nd Target (TP2): Approximately 37.40 – 37.50
These targets are based on the breakout from the triangle and previous resistance zones marked on your chart.
🛑 Suggested Support Zone (Breakout Retest Area):
Around 36.00 – 36.20 (acts as support now after the breakout)
If price holds above this zone, the bullish structure remains valid. Let me know if you'd like stop loss suggestions or lower timeframe analysis.

USD/JPY (4H timeframe) shows a clear break 0ut.USD/JPY (4H timeframe) shows a clear break below the ascending trendline and Ichimoku cloud support, suggesting a bearish continuation.
Key Bearish Targets (Based on the chart):
1. First Target Zone:
📉 140.88
This level aligns with previous structure support and is marked as the initial target on the chart.
2. Second Target Zone:
📉 138.85 – 139.00
This is a deeper support zone and is indicated as the next bearish leg if price momentum continues downward.
Summary:
Current Price: ~142.74
Trend: Bearish (Breakdown from trendline + Ichimoku bearish signals)
Target 1: 140.88
Target 2: 138.85
Let me know if you want SL (stop-loss) or entry suggestions.

SHORT ON BITCOINBITCOIN has continue to create lower highs at a major resistance zone.
I will be selling bitcoin looking to make over 8000 to 20,000 points.

EUR/USD.4h chart pattern.EUR/USD 4H chart, I can see an ascending trendline with a breakout to the upside, suggesting bullish momentum. You’ve also marked a "TARGET" zone visually on the chart.
Estimated Target:
Based on standard breakout and trend continuation principles:
Current Price: Around 1.1598
Visual Target Zone (as per your chart): Near 1.1700
Potential Target Zone:
1.1700 - 1.1720 (Approximate zone for bullish continuation if breakout holds)
Notes:
✅ Strong bullish structure confirmed by higher highs and trendline support
✅ Breakout already in motion; as long as price stays above the trendline, bullish target remains valid
✅ Watch key support at 1.1535 - 1.1500; price falling below this weakens bullish outlook
Would you like Fibonacci or measured move targets calculated more precisely? Let me know!


EUR/USD 4H Chart Pattern, here's the analysis..Looking at My EUR/USD 4H Chart Pattern, here's the analysis:
Current Price:
Around 1.1819
Observations:
Price is moving inside an ascending channel
Breakout from the upper channel line is happening
Ichimoku Cloud shows bullish momentum as price is well above the cloud
---
Target Levels:
✅ First Target Zone: 1.1900 - 1.1950
✅ Final Target Zone: 1.2000 - 1.2020 (as marked on your chart)
---
Notes:
Watch for strong breakout confirmation above 1.1850
If momentum continues, price can reach 1.2000
Use stop-loss below 1.1750 to manage risk
---
If you want, I can help suggest stop-loss, entry, and risk management in detail. Let me know!

GOLD 3H Chart Pattern, I have marked a cup formationGOLD 3H Chart Pattern, I have marked a cup formation, which often indicates a bullish reversal setup. Based on the chart:
Key Levels:
Current Price Zone: Around 3,323 - 3,330
First Target: Near 3,380 - 3,400
Final Target: Near 3,440 - 3,460
Analysis:
Price is forming a cup pattern with resistance around 3,380 - 3,400
Break above 3,400 could lead towards the final target zone of 3,440 - 3,460
Watch for price reaction near Ichimoku Cloud; clean breakout above the cloud confirms bullish momentum
Suggested Targets:
✅ First Target: 3,380 - 3,400 USD
✅ Second Target: 3,440 - 3,460 USD
Note: Wait for confirmation above 3,330 - 3,340 and bullish momentum to continue.
If you want, I can also give stop-loss and entry suggestions based on this chart. Let me know!

AAPL triangle breakout pattern (bullish bias in this case).📈 Chart Pattern Observed:
This is a symmetrical triangle breakout pattern (bullish bias in this case).
Price has broken out or is near breakout above the descending trendline.
Ichimoku cloud thinning and flattening indicates potential bullish momentum building up.
---
🎯 Target Levels Based on Chart:
1. First Target Point:
Price Level: Around $225.00 USD
This is the initial breakout target, often calculated by measuring the widest part of the triangle and projecting upward from the breakout point.
2. Second (Final) Target Point:
Price Level: Around $250.00 USD
This is a more extended target if bullish momentum continues strongly and volume confirms the move.
---
🔍 Additional Notes:
Current Price Zone: Around $202–$206 USD
Stop-Loss Idea: Below the recent swing low or lower trendline, around $195–$197 USD
Entry Idea: On confirmed breakout and retest, above $206.50–$208.00 USD
Would you like help with a trade plan including entry/SL/TP levels based on risk-reward?

SILVER US$ 1H CHART PATTERNSilver (XAG/USD) 1H timeframe, here’s a breakdown of the target levels indicated:
📈 Chart Analysis Highlights:
The chart shows a bullish ascending triangle pattern, which is typically a continuation pattern signaling upward movement.
The price has recently broken above resistance around the 36.36–36.40 area.
You’ve marked two target points:
---
🎯 Target Levels:
1. First Target Point:
Price Level: Approximately 37.40 USD
This is the first significant resistance level after breakout, potentially reachable if momentum continues.
2. Second Target Point (Extended Target):
Price Level: Approximately 37.80 USD
This would be a more ambitious target assuming strong bullish follow-through.
---
📌 Notes:
Ensure to monitor volume on breakout for confirmation.
Risk management is important — consider stop-loss near 36.10 or below the ascending trendline.
Watch for any false breakouts especially near Ichimoku cloud resistance zones.
Would you like help setting up entry/exit levels or risk-reward ratios?

ETH Pushed Back, Support in Sight
ETH on the 4H just closed below the last daily close and the 0.5 Fib again, after getting pushed back from the 4H 200MA and daily 200MA resistance zone.
The next key supports are the weekly 200MA and the local support zone.
Also worth noting: Trump and Musk are stirring things up again. The last time this dynamic appeared, it triggered a selloff a few weeks ago, even before the conflict began.
Always take profits and manage risk.
Interaction is welcome.
