Ethereum H4 | Resistance at 78.6% Fibonacci retracementEthereum (ETH/USD) is rising towards a pullback resistance and could potentially reverse off this level to drop lower.
Sell entry is at 2,551.80 which is a pullback resistance that aligns closely with the 78.6% Fibonacci retracement.
Stop loss is at 2,700.00 which is a level that sits above the 127.2% Fibonacci extension and an overlap resistance.
Take profit is at 2,364.35 which is a pullback support.
High Risk Investment Warning
Trading Forex/CFDs on margin carries a high level of risk and may not be suitable for all investors. Leverage can work against you.
Stratos Markets Limited (tradu.com ):
CFDs are complex instruments and come with a high risk of losing money rapidly due to leverage. 63% of retail investor accounts lose money when trading CFDs with this provider. You should consider whether you understand how CFDs work and whether you can afford to take the high risk of losing your money.
Stratos Europe Ltd (tradu.com ):
CFDs are complex instruments and come with a high risk of losing money rapidly due to leverage. 63% of retail investor accounts lose money when trading CFDs with this provider. You should consider whether you understand how CFDs work and whether you can afford to take the high risk of losing your money.
Stratos Global LLC (tradu.com ):
Losses can exceed deposits.
Please be advised that the information presented on TradingView is provided to Tradu (‘Company’, ‘we’) by a third-party provider (‘TFA Global Pte Ltd’). Please be reminded that you are solely responsible for the trading decisions on your account. There is a very high degree of risk involved in trading. Any information and/or content is intended entirely for research, educational and informational purposes only and does not constitute investment or consultation advice or investment strategy. The information is not tailored to the investment needs of any specific person and therefore does not involve a consideration of any of the investment objectives, financial situation or needs of any viewer that may receive it. Kindly also note that past performance is not a reliable indicator of future results. Actual results may differ materially from those anticipated in forward-looking or past performance statements. We assume no liability as to the accuracy or completeness of any of the information and/or content provided herein and the Company cannot be held responsible for any omission, mistake nor for any loss or damage including without limitation to any loss of profit which may arise from reliance on any information supplied by TFA Global Pte Ltd.
The speaker(s) is neither an employee, agent nor representative of Tradu and is therefore acting independently. The opinions given are their own, constitute general market commentary, and do not constitute the opinion or advice of Tradu or any form of personal or investment advice. Tradu neither endorses nor guarantees offerings of third-party speakers, nor is Tradu responsible for the content, veracity or opinions of third-party speakers, presenters or participants.
Crypto

Bitcoin H1 | Potential bounce off an overlap supportBitcoin (BTC/USD) is falling towards an overlap support and could potentially bounce off this level to climb higher.
Buy entry is at 106,532.50 which is an overlap support that aligns closely with the 23.6% Fibonacci retracement.
Stop loss is at 104,600.00 which is a level that lies underneath a swing-low support and the 38.2% Fibonacci retracement.
Take profit is at 108,808.50 which is a swing-high resistance that aligns with the 127.2% Fibonacci extension.
High Risk Investment Warning
Trading Forex/CFDs on margin carries a high level of risk and may not be suitable for all investors. Leverage can work against you.
Stratos Markets Limited (tradu.com ):
CFDs are complex instruments and come with a high risk of losing money rapidly due to leverage. 63% of retail investor accounts lose money when trading CFDs with this provider. You should consider whether you understand how CFDs work and whether you can afford to take the high risk of losing your money.
Stratos Europe Ltd (tradu.com ):
CFDs are complex instruments and come with a high risk of losing money rapidly due to leverage. 63% of retail investor accounts lose money when trading CFDs with this provider. You should consider whether you understand how CFDs work and whether you can afford to take the high risk of losing your money.
Stratos Global LLC (tradu.com ):
Losses can exceed deposits.
Please be advised that the information presented on TradingView is provided to Tradu (‘Company’, ‘we’) by a third-party provider (‘TFA Global Pte Ltd’). Please be reminded that you are solely responsible for the trading decisions on your account. There is a very high degree of risk involved in trading. Any information and/or content is intended entirely for research, educational and informational purposes only and does not constitute investment or consultation advice or investment strategy. The information is not tailored to the investment needs of any specific person and therefore does not involve a consideration of any of the investment objectives, financial situation or needs of any viewer that may receive it. Kindly also note that past performance is not a reliable indicator of future results. Actual results may differ materially from those anticipated in forward-looking or past performance statements. We assume no liability as to the accuracy or completeness of any of the information and/or content provided herein and the Company cannot be held responsible for any omission, mistake nor for any loss or damage including without limitation to any loss of profit which may arise from reliance on any information supplied by TFA Global Pte Ltd.
The speaker(s) is neither an employee, agent nor representative of Tradu and is therefore acting independently. The opinions given are their own, constitute general market commentary, and do not constitute the opinion or advice of Tradu or any form of personal or investment advice. Tradu neither endorses nor guarantees offerings of third-party speakers, nor is Tradu responsible for the content, veracity or opinions of third-party speakers, presenters or participants.

XRP UG-ah-LYXRP has been slowly chopping lower in a mess of overlapping candles. Lower highs and lower lows at the Highest degree. The trend is down and the Elliott Is ugly.
There is a chance here for the trend to shift, but that low needs to hold.
In Elliott Wave, ugly can be useful. An ugly pattern often screams correction. That is the working assumption right now. This structure could still be a complex wave four.
Even though the wave count has not been crystal clear, I am not flying blind. I am using support and resistance to track the structure and wait for clarity.
Here are the levels that matter right now:
3.4005 was the major high
3.0257 and 2.2762 are key reaction zones
2.6510 is the median and the first major line bulls need to beat
1.9736 is the old high that price continues to bounce from
1.9015 and 1.5267 are the potential downside reaction zones if the yellow path unfolds
If this is a correction, there is still potential to hold above 1.62 and send. If that level goes, the structure shifts fast to lower targets.
This is not the time to get brave without confirmation, mo.
Ugly price action can still resolve cleanly. But I want to see an impulsive move through one of these levels, followed by a corrective return to that level. That would offer a more ideal continuation in whichever direction price decides.
Let the level reactions speak first. I will act after.

Bitcoin Top is In! Bear considerationsPrice has been carving out an unclear correction off the high. The recent structure has many squinting. Is it done or the calm before another wave of selling?
I am weighing two bearish scenarios here. One is more aggressive than the other. But both start with the same idea. No new high before another low.
Let’s start at the top.
The initial move down off the recent high could count as an impulse. Whether that is a wave 1 or a wave A is still up for judgment. Either way, that first leg sets a bearish tone at the larger degree.
Here’s where it gets interesting. The correction since then shows traits of a flat. A running one at the moment.
This opens the door to two active bearish projections:
A wave C collapse, implying a completed A B C correction and a downside resolution.
A wave 3 drop, for a possible top if this is an impulsive sequence.
That is the fork in the road. And it all hinges on the next move.
Right now, the smallest degree impulse off the low is doing some heavy lifting.
If that pivot holds and we only get an internal retracement like a micro wave 2, the door is still open for upside continuation.
But if that impulse gets invalidated, I would expect bears to press. First for a break below 100k, then toward the 95k area.
Here is how to think about it:
Hold the small impulse → Potential upside
Break the impulse base → Wave C or 3 likely underway
Context still leans bearish. Lower highs are still in play. But we are hunting a specific structure to confirm it.

ADA About to Explode or Fakeout Trap?Yello Paradisers — is ADA quietly setting up for a powerful reversal, or are we about to walk straight into a painful bull trap? This zone could decide everything, and here’s why you need to pay close attention.
💎Cardano (ADAUSDT) is currently sitting right on the supportive trendline of a descending channel, while also forming a classic double bottom pattern. What makes this even more significant is the presence of bullish divergence on RSI. This combination alone already hints at a potential bullish reversal, but there’s more to it.
💎The current zone also served as a previous resistance area, and it has now flipped into support—this “resistance-turned-support” structure adds confluence and increases the probability of an upward move. When multiple bullish signals align at a major structural level like this, it usually sets the stage for a strong bounce.
💎Aggressive traders who entered early from current levels are already seeing a potential 1:1 risk-to-reward ratio. However, for safer and more strategic positioning, conservative traders can wait for a pullback to this support zone. Waiting for a bullish confirmation candle after the pullback can offer a better entry with a healthier RR and higher probability of success.
💎That said, if the price breaks below the current support and closes a candle below our invalidation level, the entire bullish idea will be invalidated. In that scenario, the smart move is to remain patient and wait for a new setup to form. Chasing trades after invalidation is how most retail traders get trapped—don’t be one of them.
🎖Strive for consistency, not quick profits. Treat the market as a businessman, not as a gambler. This is the only way you’ll make it far in your crypto trading journey. Be a PRO.
MyCryptoParadise
iFeel the success🌴

#ETH Rebounds on Ceasefire News – Eyes Set on $3100 and Beyond!By analyzing the #Ethereum chart on the weekly (logarithmic) timeframe, we can see that after dropping to $2100, ETH started recovering strongly following the ceasefire announcement, and is currently trading around $2430. If Ethereum manages to close above $2700 by the end of the week, we could expect further upside.
The next potential bullish targets are $2890, $3100, and $4100.
Please support me with your likes and comments to motivate me to share more analysis with you and share your opinion about the possible trend of this chart with me !
Best Regards , Arman Shaban

Cardano Correction or Opportunity? (READ THE CAPTION)By analyzing the #Cardano chart on the 3-day timeframe, we can see that after reaching 73 cents and amid rising war tensions, the price started a correction along with the broader crypto market. This correction has now brought ADA to attractive zones for potential laddered buying and long-term investment. Cardano is currently trading around 54 cents, and if the conflict continues, it may drop further, possibly below 45 cents.
Key demand zones are at $0.36, $0.45, and $0.52.
Short-term targets are $0.61 and $0.76, while long-term bullish targets are $0.93, $1.05, and $1.33.
Please support me with your likes and comments to motivate me to share more analysis with you and share your opinion about the possible trend of this chart with me !
Best Regards , Arman Shaban

ETHBTC: Ethereum to outperform massively Bitcoin.ETHBTC turned neutral again on its 1D technical outlook (RSI = 41.566, MACD = -0.00033, ADX = 21.423) as in the past 4 weeks it failed to extend the rebound of the April 14th bottom. Ahead of a MACD Bullish Cross, a little further correction to make a Double Bottom (DB) would make the pattern more bullish, much like the December 9th 2019 DB. That was the start of Ethereum's bull season. Similarly, we expect it to start outperforming Bitcoin massively and approach the R1 level (TP = 0.0800).
## If you like our free content follow our profile to get more daily ideas. ##
## Comments and likes are greatly appreciated. ##

#PAXGUSDT #1D (ByBit) Head & Shoulders near breakdownPax Gold printed a shooting star and is losing 50MA now, on daily.
Seems on the verge of a big retracement down towards 200MA support, once neckline is broken.
⚡️⚡️ #PAXG/USDT ⚡️⚡️
Exchanges: ByBit USDT
Signal Type: Regular (Short)
Leverage: Isolated (9.0X)
Amount: 4.9%
Entry Targets:
1) 3349.94
Take-Profit Targets:
1) 3049.06
Stop Targets:
1) 3500.75
Published By: @Zblaba
LSE:PAXG BYBIT:PAXGUSDT.P #1D #PaxGold TVC:XAU
Risk/Reward= 1:2.0
Expected Profit= +80.8%
Possible Loss= -40.5%
Estimated Gaintime= 1.5 months

HolderStat┆BTCUSD broke the trend lineOKX:BTCUSDT on the 3h chart is accelerating from a breakout above $104,000 after several consolidation phases. Price is approaching $109,000 resistance. A breakout above this could trigger a run toward $112K+.

HolderStat┆ETHUSD formed the rising bottomBINANCE:ETHUSDT on the 16h chart is pressing upward inside a steep channel after reclaiming $2,300. Momentum is driving the price toward $2,800 and possibly $3,400. Previous breakouts from consolidation zones support the bullish bias.

HolderStat┆XRPUSD held the supportBINANCE:XRPUSDT on the 16h chart is showing strength above $2.05 after breaking out from consolidation. The path is clear toward $2.30 and $2.60 as buyers regain control. The bullish pattern sequence continues to develop.

HolderStat┆SOLUSD above the supportBINANCE:SOLUSDT reclaimed the $140 level after a wedge breakout and is now forming a stair-step recovery structure. The price is targeting the mid $150s with higher lows supporting the bullish thesis. Previous consolidations and wedge formations suggest buyers are regaining control. Continued strength above $140 reinforces the move.

HolderStat┆BNBUSD retest of the channelBINANCE:BNBUSDT has completed a bullish reversal from the 633.4 level and is now testing upper trend resistance. A breakout from this wedge structure may lead to a rapid move toward the 680–700 region. Past triangle patterns have preceded strong rallies, and momentum indicators favor bulls. Traders will look for a breakout above 650 to confirm.

HolderStat┆ADAUSD retest of the supportBINANCE:ADAUSDT has bounced from the 0.55 support level, completing a falling wedge structure. The price now attempts to recover, with a visible bullish wave formation targeting the 0.62 resistance trendline. Multiple past consolidations have preceded breakouts, and if this pattern holds, a strong upside push is possible. Watch for confirmation of continued higher lows.

CHZ Bulls Are Getting Trapped Again —Another Nasty Drop Loading?Yello Paradisers did you notice how clean this CHZ rejection was? After a textbook touch of descending resistance, the price got slammed down again, and what comes next might catch many traders off guard. If you’re not prepared, this next leg could drain portfolios fast.
💎#CHZ/USDT continues to respect its well-defined descending channel on the 12H chart. Every time price attempts to rise, it's met with aggressive selling and this latest bounce was no different. Price failed to even reach the major supply zone between 0.03800 and 0.04200 before getting rejected at the resistance layer around 0.03600. This weakness suggests buyers are running out of steam and may not have the power to defend current levels for much longer.
💎The setup is straightforward #CHZ is trading within a strong bearish structure. The lower highs and lower lows pattern remains intact, and the most recent push up couldn’t break the descending resistance line. This latest rejection also aligns with the horizontal resistance just below the supply zone, which adds confluence to the bearish outlook. Unless the price breaks and closes above 0.04423 which would invalidate the current downtrend the path of least resistance remains to the downside.
💎The next level to watch is moderate support at 0.03026, but more importantly, all eyes should be on the major support zone down at 0.02562. That’s where significant liquidity is likely to be resting and that’s where smart money will be hunting for entries once retail panic sets in.
Right now, volume remains weak, and there’s no bullish momentum strong enough to break out of this channel. Until that changes, expect this to play out as another trap pushing late longs into losses before sweeping the lows.
MyCryptoParadise
iFeel the success🌴

What Is The Market Waiting For?Good Morning Trading Fam,
Our stock and crypto markets seem to have stalled. You may be wondering what they are waiting for. Quite simply, the S&P 500 has reached a double-top. That's all. There may be some more pause here for the next week or so. Barring any significant bearish geopolitical or other events, I expect us to move higher. Any FUD at all will send the market back down again. So yes, unfortunately, the next move(s) will be mostly predicated on news. Traders are rather fragile rn. Trade accordingly.
Best,
Stew

Super high risk setup BTC with 60 R:RIt looks like BTC is about to close the weekly candle above 106K.
If the bulls are still in control, they need to act very soon. The 100K support level has been successfully retested, and now could be the time for a move upward.
📈 Trade Setup (Educational Purpose Only):
Entry: 106,040
Stop Loss: 105,431
Target: 144,000
Risk-Reward Ratio: 1:60
This is a super high-risk setup, but the potential reward is significant. Proceed with caution and always do your own research.

15 R:R setup for EthereumWe assume that this marks the beginning of a new uptrend for BTC. This setup offers an easy 15:1 risk-to-reward ratio.
Entry: 2534
Stop Loss: 2373.33
Target: 5000
This is for educational purposes only.

Trade setup for SUI 20 R:R. Now or never!!!BTC and ETH are already showing signs of reversal. Do you believe a bull run is coming? This might be a good setup before the market takes off. Risk-to-reward ratio of 20:1 — extremely risky but potentially very rewarding. Only two resistance levels left before reaching the all-time high (ATH).
Entry: 3.3944
Stop-loss: 3.1721
Target: 8.0000
This is for educational purposes only

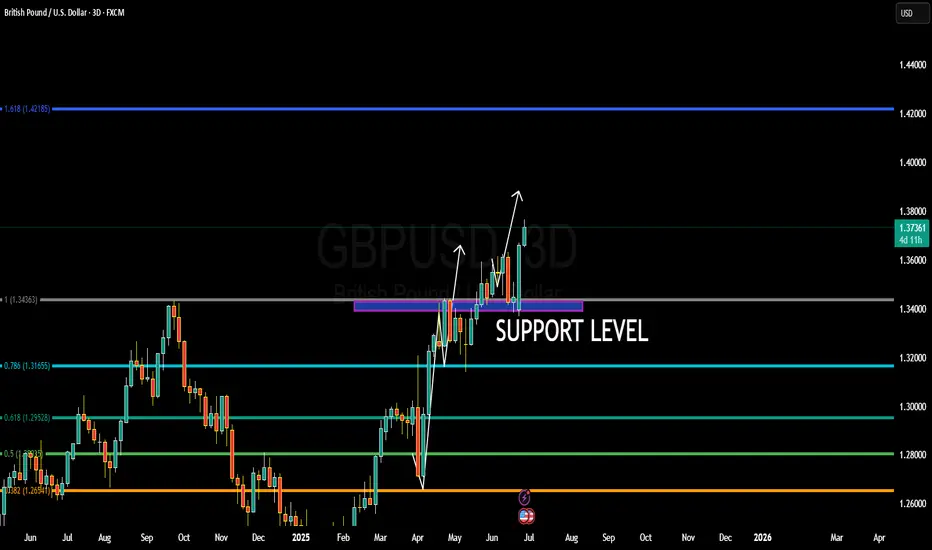
WHY GBPUSD BULLISH ???GBPUSD is unfolding exactly as anticipated, with price now hovering around the 1.3740 region and maintaining strong bullish momentum. Price has successfully bounced from the key support zone near 1.3430, which was previously a major resistance turned into solid demand. This level held firmly during multiple retests, confirming a clean breakout-retest continuation pattern. As long as this structure remains intact, I continue to hold a bullish bias targeting 1.4000 in the coming sessions.
From a fundamental perspective, the British Pound is gaining strength on the back of improved UK economic sentiment. The latest UK inflation data surprised to the upside, pushing annual CPI back above 3%, which reinforces expectations that the Bank of England may need to act sooner rather than later on rate hikes. Markets are now pricing in higher probability of a rate adjustment before the end of Q3 2025. Meanwhile, the US Dollar is under moderate pressure as recent soft labor data and downward revisions in consumer confidence readings have dampened expectations for further tightening from the Fed.
Technically, GBPUSD has cleared major Fibonacci resistance levels and is now forming higher highs and higher lows across the higher timeframes. The current bullish wave is fueled by clean institutional demand and strong price action momentum. If the pair can sustain above 1.3650–1.3680, a swift move toward the psychological 1.4000 handle is highly probable. The 1.4218 Fibonacci extension aligns as a longer-term secondary target for swing traders holding this bullish continuation.
This setup offers a solid blend of macroeconomic backing and technical structure. GBPUSD remains one of the top trending forex pairs right now, favored by strong price action, central bank divergence, and global capital rotation. I'm closely monitoring for intraday pullbacks to add long positions, aiming for extended upside as the market follows through on this bullish breakout continuation.
BTC/USD 1h Chart Analysis: BTFDBitcoin is showing a bullish structure on the 1h timeframe with a potential move towards $109,000.
On smaller timeframes, it exhibits a clear "buy the dip" profile.
Key Levels:
$109,000: Potential upside target.
$107,000: Resistance/Support zone to watch for rejection.
$105,000: Low Volume Node (LVN*) a possible good long entry zone.
$102,000 - $100,000: Support levels to monitor if $105,000 fails.
Currently it have bullish trend with a potential dip near $105,000 showing good entry point.

KAS IS TESTING RED RESISTANCE ZONE🚨 KAS Testing Red Resistance – Waiting for Breakout 📈
KAS is currently testing the red resistance zone.
If breakout is confirmed, the first target could be the green line level! 📊
