Do you want to have glory? Do want to see Valhalla?#HODL
These next few years will could change your life.
#ETHEREUM is cheap right now.
#ETH still can do tens of X's
Crypto

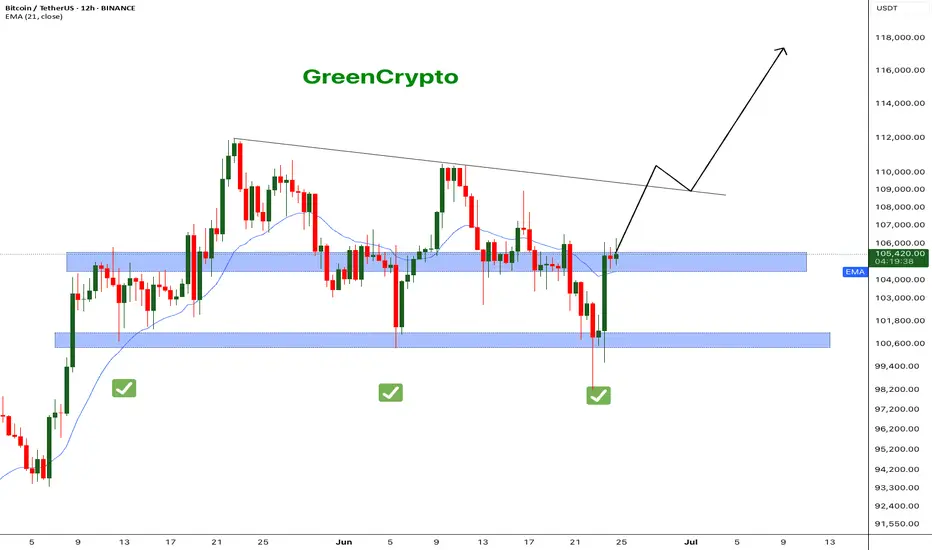
Bitcoin - What's next ? BINANCE:BTCUSDT (12H CHART) Technical Analysis Update
Now that ceasefire is announced, bitcoin price has successfully recovered to the resistance level and currently trading at the resistance zone. It's critical that bitcoin breaks this resistance for it to hit the next resistance around 110K .
I'm expecting price to reach 110k this week and we can see some consolidation in that range before moving further up.
Follow our TradingView account for more technical analysis updates. | Like, share, and comment your thoughts.
Cheers
GreenCrypto
ETHUSD: Waiting for one last breakout.Ethereum remains neutral on its 1D technical outlook (RSI = 48.083, MACD = -39.26, ADX = 21.833), failing so far to close over its 2W MA50, where it's been rejected in the past 3 candles. The last Resistance before the price starts the parabolic rally is the P1 trendline. The price has been trading over it for the majority of this Cycle and only broke under it during the recent Tariff War. A breakout there, extends the Cycle to possibly at least a +346.99% rally from the bottom (TP = 6,200).
## If you like our free content follow our profile to get more daily ideas. ##
## Comments and likes are greatly appreciated. ##

SUI - Only way is up.BINANCE:SUIUSDT (1W CHART) Technical Analysis Update
SUI is currently trading at $2.77and showing overall bullish sentiment
Price has touches the trending support and managed to bounce back from the support, this is a good sign. I see a good opportunity for long trade here with a decent stoploss.
Entry level: $ 2.77
Stop Loss Level: $ 1.77
TakeProfit 1: $ 3.6997
TakeProfit 2: $ 4.2126
TakeProfit 3: $ 5.7785
TakeProfit 4: $ 9.5494
TakeProfit 5: $ 14.1762
Max Leverage: 5x
Position Size: 1% of capital
Remember to set your stop loss.
Follow our TradingView account for more technical analysis updates. | Like, share, and comment your thoughts.
Cheers
GreenCrypto

BTCUSD: Minimum target for this Cycle is 150,000Bitcoin turned neutral again on its 1D technical outlook (RSI = 52.882, MACD = -410.600, ADX = 22.509) as it recovered the losses of the last 2 days thanks to the Truce announcement between Israel and Iran. The long term picture couldn't be more bullish however as it hasn't even hit the bottom red zone of the Logarithmic Growth Curves model. According to the Time Cycles that mark each Cycle High, the Top for this Cycle is estimated to be between October and December. By October 2025, the top of the first profit taking zone (lightest pink) would be $150,000. That is technically the bare minimum of Top that should be expected based on the current LGC model. Technically it can even hit $200,000 but fundamentals have to help a lot in this scenario (adoption, ETFs, rate cuts).
## If you like our free content follow our profile to get more daily ideas. ##
## Comments and likes are greatly appreciated. ##

Toncoin Final Call: Last Chance For Bottom Prices (3-5X Lev Pos)The last 3D session that closed produced a major reversal signal and this is the last chance truly, the last opportunity; the final call. It is the final call to get Toncoin at low prices before a major bull market. It will be a massive bullish wave and this wave will reach new all-time highs and beyond during the price discovery phase.
This chart setup can be traded with leverage. Traders can use 3-5X leverage with very low risk. Spot traders can buy and hold and this will be one of the biggest projects in this cycle.
The pairs that moved weakly in the first bounce, 7-April, will do much better in this second jump. These pairs will also move fast and stronger compared to the ones that already moved strong between April and May.
There are many pairs and many projects. In each wave, a different set of pairs moves strong and becomes top performers. The ones that didn't move last time can move this time. Those that did move can move again but they tend to lag behind. The energy moves around the entire market and never gets stuck in one place.
Adapt and change. The market is always changing... Choose wisely.
This is a huge opportunity. It is time to trade.
Buy the bottom and hold; you will be happy with the results.
Namaste.

Ondo Finance: 290%, 483% & 676% Summer & FallBullish momentum right now is building up so fast that I can hardly share a chart before prices are up 5 to 10%. If you try to buy, prices can runaway from you specially when using leverage. That's what I mean when I say that the bottom, bottom prices, will only last a few days at max. The time is now.
Here we have Ondo Finance with a great pattern, the ascending channel. This chart structure clearly reveals a very strong, long-term bullish bias. And the logical conclusion is always obvious based on price action.
Each time there is a drop, the lowest point is a higher low.
Each time there is an advance, the market ends up producing a higher high...
I know, people are allergic to bottom prices so right now everybody is away but, there is good news; soon the market will be trading really high up and once prices are high, everybody is ready to trade.
Huge potential for growth on this chart. These target can be hit within 1-3 months, 3-6 months with the potential open for higher than what is shown.
Namaste.

LayerZero, Exposing The Bottom, NEW Uptrend in The MakingNotice how a very steep decline suddenly becomes flat. The bottom that is. As ZROUSDT was crashing down from December 2024 we have lower lows. Then something changes; market dynamics, price action, the trend, instead of lower lows the bottom goes flat and yesterday we have a double-bottom. This means that bears are no longer in charge. Buyers were present at support.
Truly, that's all we need to know.
No complexities, no hundreds of indicators, no "fundamentals," nothing, none.
Just this small amount of information tells us that the downtrend is over, with the downtrend being over we know a reversal can happen any day. We are expecting this reversal to start to shape itself now. A new uptrend will show up in the coming weeks. Bullish action will start within days.
LayerZero is going up.
Thank you for reading.
Namaste.

Aptos Bullish, Altcoins BullishThe best is yet to come. Do not despair my dear friend, patience is key.
Aptos is breaking bullish right now after a final low with the highest volume since February. This confirms the latest double-bottom as the market bottom.
The high bullish momentum developing on today's candle, full green, coupled with the fact that a major flush is present on the chart reveals really good news. Today, things might seen down and quiet; everything can change in a day.
The bullish wave is on, it is starting now and it will be strong. Bottom prices will be gone within hours but we will experience long-term growth. Keep in mind that 100%-200% can happen within a matter of days. This is because the market is set to grow in excess of 1,000-2,000%, so the first jump is very strong but only signals the start. Getting bottom prices can be life changing.
This is a friendly reminder; the best is yet to come.
Aptos bullish means the altcoins are bullish.
The altcoins going bullish means that Bitcoin will soon resume with new all-time highs and additional growth.
Trust crypto, trust the market, trust your plan. You will be rewarded long-term.
The time to buy is now. Profits are on their way. To you!
Namaste.

Bitcoin Recovers...What we've learned in the past few years is that Bitcoin's demand is just too strong. Retraces and corrections are no longer wild like before, these are limited and capped. Nobody wants to take the risk of selling too much and being left out or losing their Bitcoins for good, they are just too valuable. Many times more valuable than the USD Dollar or Gold. It is the most valuable asset in the whole digital world.
Other than food and toilet paper, nothing is more valuable than Bitcoin.
Technical analysis
Ok, let's focus on the chart.
The retrace has been ongoing for 31 days, since 22-May.
Total drop amounts to 12.33% (-12%).
The action moved below the 5-June low around $100,400. Bitcoin is now back above this level. Clearly showing that this is a stop-loss hunt event.
Stop-loss hunt and liquidity hunt because thousands, if not millions, of over-leveraged traders have been liquidated. They were betting on the wrong side short-term. Long-term yes, bullish is the trend, the direction and the win. Short-term, it was SHORT but not anymore.
Never trade with 20X that's crazy. Imagine going LONG 20X at the all-time high? Isn't that stupid?
I can bet you the same people didn't want to buy LONG when Bitcoin was trading at $75,000. In fact, I can bet that these people that just got liquidated were selling below $80,000 and buying LONG with 20X at $110,000. A recipe for disaster.
Anyway, I am calling it early. This is it, we are going up.
I got my signals, as you already know, from the altcoins.
If you agree boost and follow.
Thanks a lot for your continued support.
Namaste.

Bitcoin Weekly Ultra-BearishThe 100K support is still valid but the weekly timeframe chart isn't looking good.
Good afternoon my fellow Cryptocurrency trader, how are you feeling today?
Bitcoin peaked the week 19-May. Then we have bearish action only.
The week after 19-May was red, then two neutral weeks and a continuation this week. It looks pretty bad right now, terrible to be honest.
» The main support range sits between $82,500 and $88,888.
Thank you for reading.
This support zone will only become active is 100K breaks on the weekly timeframe.
Namaste.

Bitcoin can correct to support line of channel and start to growHello traders, I want share with you my opinion about Bitcoin. The price was moving inside a strong upward channel, where it managed to break through the support level and then the resistance level, eventually reaching the seller zone. After that, BTC started to turn around and declined, once again breaking through the 109000 resistance level, this time from above. That movement also marked an exit from the upward channel. Following that, the price made a correction move down to the support level — the same zone that previously acted as a breakout area. From there, BTC showed strength again with a bullish impulse upward, returning to the Seller Zone. However, that rally was short-lived. The market started to decline again, this time forming a downward channel. Now the price is approaching the support line of this channel, which coincides with the support level around 100500 and the buyer zone between 99500 and 100500. I think BTC can decline a bit further to test this support line, and then rebound from this area, starting a new upward move toward the channel resistance line. That’s why I’ve set my TP at 106000 points, just below the resistance line. Given the structure and past reactions from these zones, I remain bullish and expect further growth after this local pullback. Please share this idea with your friends and click Boost 🚀
Disclaimer: As part of ThinkMarkets’ Influencer Program, I am sponsored to share and publish their charts in my analysis.

HelenP. I Bitcoin may break trend line and continue to move downHi folks today I'm prepared for you Bitcoin analytics. After testing the resistance area between 107500 and 108200 points, the price started to form a clear descending pattern, respecting the downward trend line with multiple touches. The price consistently failed to break above it, confirming bearish pressure. Eventually, it dropped below the 101500 support level and entered the support zone down to 100700 points, where it found temporary relief. From there, BTC attempted a short-term rebound and moved back toward the 101500 resistance area. However, it now trades just under the trend line again, signaling that the sellers are still in control. The structure suggests a potential pullback toward the trend line or the lower boundary of the resistance zone before further downside continuation. In my opinion, BTCUSD is preparing for another move lower. That’s why I expect a slight upward correction, followed by a new bearish impulse that could push the price toward the 97500 level, my current goal. Given the ongoing pressure from the trend line and the failed breakout attempts, I remain bearish and expect further decline. If you like my analytics you may support me with your like/comment ❤️
Disclaimer: As part of ThinkMarkets’ Influencer Program, I am sponsored to share and publish their charts in my analysis.

XAU/USD 4h chart patternXAU/USD (Gold) 4H Chart, the price has clearly broken below the ascending trendline, indicating a bearish structure.
Visual Targets from My Chart:
1. First Target Zone: Around 3,210 - 3,215 USD
2. Second Target Zone: Around 3,130 - 3,135 USD
Price Action Breakdown:
Current Price: Around 3,310 - 3,335 USD
Trendline break confirmed with strong bearish candles
Momentum suggests price is heading towards the first support zone around 3,210
If bearish momentum continues, price may reach the second target around 3,130
Summary:
✅ First Target: 3,210 - 3,215 USD
✅ Second Target: 3,130 - 3,135 USD
If you want precise Fibonacci or support/resistance levels calculated, I can assist further—just let me know!

Market SIGNALS SHOW THAT BTC CAN FALL TO 85K USDMarket follow-up study shows that there is a good chance BTC can fall to 85K in the coming time period. The market cycle seems to end the green trend and to enter a new red zone.
Time will show what really can happen with BTC.
The market can make a fake trend, with a trend fall on a high time frame.
The crash can also happen on the main markets.
This is not trading advice, trade always only depending on your plan.

USD/JPY.2h chart patternI'm provided for USD/JPY on the 2-hour timeframe, here is a detailed breakdown and target analysis:
---
🔍 Technical Analysis Summary
Pair: USD/JPY
Timeframe: 2H
Current Price: ~144.98
Trend: Bearish
Breakdown Confirmation: Price broke structure support and the ascending trendline.
Indicators: Price is below the Ichimoku cloud, confirming bearish momentum.
---
🎯 Identified Targets (Based on Your Chart)
1st Target Level (Nearest Support Zone):
Price Level: Around 143.50
This is the first horizontal red line marked as a "Target" on your chart.
Likely to act as a short-term support level.
2nd Target Level (Major Support):
Price Level: Around 142.00
This is the second and lower red line marked on your chart.
Strong historical support zone based on previous consolidation.
---
✅ Final Target Levels
Target # Price Level Description
Target 1 143.50 Initial support; take partial profit here
Target 2 142.00 Major target; potential reversal/support zone
---
Would you like a suggested stop-loss level or entry refinement based on candlestick confirmation or indicators (like RSI or volume)?

EUR/USD 1H FLAG CHART PATTERNEUR/AUD 1H (Euro/Australian Dollar), MY analyzing a bullish flag chart pattern, which is a continuation pattern following a strong uptrend. The price has broken out of the flag to the upside, indicating a potential continuation of the bullish move.
📈 Targets Based on the Chart:
1. First Resistance / Target 1:
Price Level: Around 1.78500
2. Second Resistance / Target 2:
Price Level: Around 1.79500
These levels are clearly marked on your chart with arrows pointing upward, showing expected upward movement after the breakout.
✅ Trade Idea Summary:
Pattern: Bullish Flag
Breakout Direction: Upward
Entry Suggestion: On breakout above flag resistance (already occurred)
TP1: 1.7850
TP2: 1.7950
SL (Suggested): Below 1.7730 (previous low or support zone)
Let me know if you want a complete trade setup (entry, SL, TP, risk/reward).

TONUSDT: Short the Rejection,Buy the Capitulation – A Dual-Level
📉 TONUSDT Technical Analysis – Trending in a Long-Term Descending Channel, Is the Ideal Short Entry Coming?
TONUSDT is currently trading inside a long-term descending channel, with clear bearish momentum dominating the structure.
🔻 Scenario 1 (Early & Risky Entry):
Traders may consider opening a short position from the current level, but this setup carries higher risk, as the price could still push upward toward the upper boundary of the channel.
Stop-loss level is clearly marked on the chart.
🧭 Scenario 2 (Smarter, Low-Risk Entry):
A more calculated approach is to wait for the price to revisit the upper resistance zone of the descending channel (marked as Entry 1 on the chart).
This zone offers a clean low-risk, high-reward short opportunity, with a tight stop-loss and excellent setup.
🎯 Defined Targets in This Analysis:
Target 1: The midline of the descending channel
Target 2: The bottom of the long-term descending channel
💎 Important Insight:
If this bearish scenario completes and the price reaches the bottom of the descending channel, that zone could be a prime buying opportunity for long-term holders.
Technically, it's a major support level and psychologically, it's where smart money often steps in.
⚠️ Disclaimer:
This is not financial advice. This analysis is for educational purposes only. Always wait for confirmation and apply strict risk management when trading.
📩 What’s your opinion on this setup? Do you agree with the short plan, or see another scenario unfolding? 👇

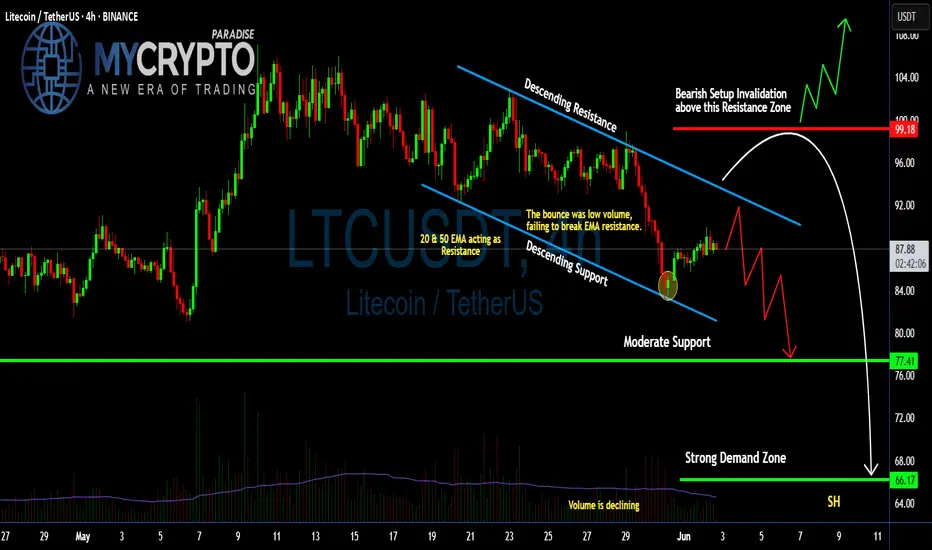
Can #LTC Bulls Make Recovery or Bears will Continue to Dominate?Yello Paradisers! Are you ready for the next wave of #LTC that can catch many traders off guard? Let's see the latest setup of #Litecoin and what can happen next:
💎#LTCUSDT is currently trapped inside a descending channel, signaling sustained bearish pressure. The most recent bounce came with declining volume and failed to reclaim the 20 & 50 EMA — a clear sign that bulls are running out of steam. These EMAs are now acting as dynamic resistance, capping every upward attempt.
💎The #LTCUSD structure remains bearish as long as the price stays below the key resistance zone near $92.00, especially under $99.18, which marks the invalidation of the bearish setup. If that zone is broken convincingly with huge volume, we could see a short squeeze toward $104.00. Until then, the bias will stay on the downside.
💎Support at $77.41 might offer temporary relief, but if sellers break through that level, all eyes will shift to the strong demand zone at $66.17 — a region that has historically attracted high-volume buying and could serve as a potential bounce area.
💎Volume continues to decline, showing that momentum is fading with each bounce. This increases the probability of a breakdown continuation unless the trendline resistance is flipped with strength and backed by volume. Right now, the chart shows weakness, not reversal.
Stay disciplined. The next big opportunity will come to those who wait not those who chase.
MyCryptoParadise
iFeel the success🌴
Something Like ThisI believe the charts are pointing towards the market gearing up for a play somewhat like this.
The timing may well be off, but the levels and sequence seem broadly predictable.

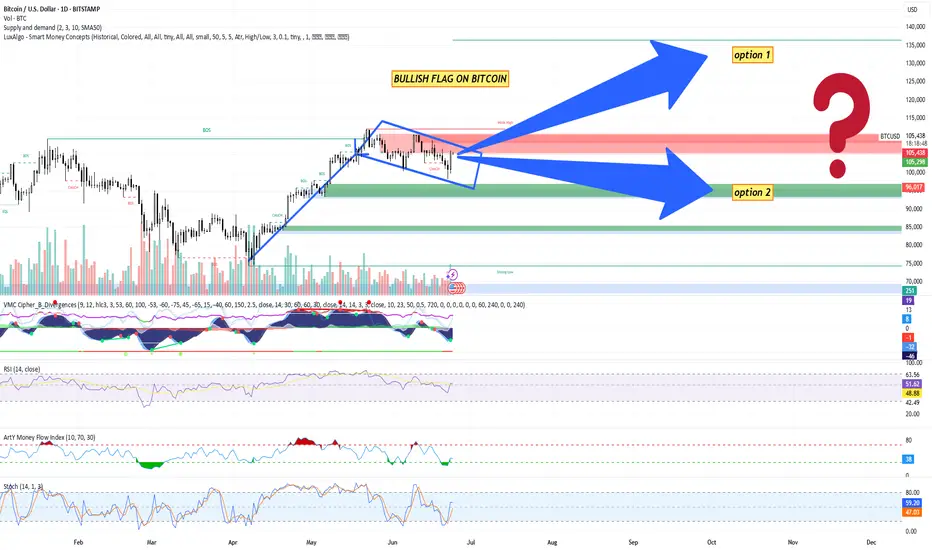
Bitcoin (BTC/USD) Technical Analysis + trade planBitcoin (BTC/USD) Technical Analysis – June 24, 2025
Pattern Identified: Bullish Flag Formation
A clear upward impulse leg followed by a downward-sloping consolidation (flag) indicates a continuation pattern.
The flag is bounded within a descending parallel channel, suggesting a potential breakout to the upside.
Break of Structure (BOS): Multiple BOS signals indicate strong market structure shifts favoring bullish continuation.
Change of Character (CHOCH): Minor CHOCH noted inside the flag, indicating local liquidity grabs but no trend reversal yet.
Key Levels
Current Price: ~$105,126
Flag Resistance: ~$105,291 (watch for breakout)
Major Supply Zone (Resistance): ~$115,000 (red zone)
Demand Zones (Supports):
$96,000 (minor)
$85,000 (medium strength)
$75,000 - $70,000 (strong low / high-confluence area)
Volume Analysis
Declining volume during flag formation supports the bullish flag hypothesis (low-volume pullback).
Anticipate increased volume on breakout for confirmation.
Indicators Summary
1. VMC Cipher B
Green dots signal potential local bottoms.
Wave trends support bullish reversal setup, though momentum still neutral.
2. RSI (14)
Current RSI: ~50.76
Neutral zone; not overbought/oversold – provides room for upside movement.
3. Money Flow Index (Art’y)
Positive inflow recovering, signaling accumulation phase.
4. Stochastic RSI
Blue line crossing above orange around 46. Indicates bullish crossover from the oversold region – early entry signal.
Bitcoin Trading Plan
Trading Bias: Bullish (Contingent on Flag Breakout)
Entry Plan
Breakout Entry: Enter long above $105,300 with confirmation (4H or daily candle close).
Aggressive Entry: Pre-breakout entry inside the flag at ~$104,000–$105,000, anticipating breakout.
Stop Loss
Conservative: Below $96,000 (below key support + 50 SMA).
Aggressive: Below $102,500 (inside flag, tighter stop).
Take Profit Levels
TP1: $110,000 (local high)
TP2: $115,000 (strong resistance zone)
TP3: $123,000–$125,000 (measured move from flag breakout target)
Measured Move Target: Height of the pole ($25K) added to the breakout zone ($105K) = Target zone: $130,000 (theoretical).
Alternative Scenario – Bearish Breakdown
If BTC breaks below $96,000, the bullish structure is invalidated.
In that case:
Look for short entries below $95,500.
Target zone: $85,000 – $75,000.
SL above $98,000.
Risk Management Guidelines
Risk per trade: 1–2% of capital
Use position sizing tools to determine trade size.
Monitor macroeconomic news (Fed, inflation, ETF flows) and crypto market sentiment.
To sum up things:
BTC is consolidating within a textbook bullish flag.
Momentum indicators align with a potential breakout.
Caution warranted until clear breakout occurs – volume confirmation is key.
Keep alert for fakeouts due to low summer volatility.
SuperVerse "Above Water," Higher Highs With A Solid BaseHere we have a really long-term support. In May and June 2021 SuperVerse (SUPERUSDT) found support at the same level as in August 2024 and March/April 2025. Amazing.
Back in 2021 SUPERUSDT was coming down from a high point and this support zone worked to produce a small bounce before a long-term market bottom was established. SuperVerse went 'below water' for 560 days. Once back 'above water' the bulls have the upper hand and this is where the action is happening today.
In simple terms, the bullish zone. SUPERUSDT confirmed recently its long-term support producing higher highs with a solid base. The bottom is flat but the peaks become higher with each bullish wave. This is to say that the next high will be a major new high and the biggest ever for this pair-project.
SuperVerse has never experienced what it is about to experience. It started in a bear market and it did good in late 2023, but 2023 was the recovery year, part of a long-term transition between bear and bull.
Now the year is 2025 and this is the bull market year. Notice that between 2022 and 2023 SUPERUSDT traded below water. In 2024 and 2025 it trades above water. We are about to experience the best yet.
Prepare for maximum growth.
SuperVerse will go higher than the easy target shown on the chart. Much higher.
Namaste.

Jupiter, Mapping A 430% Bullish WaveJupiter is set to grow really strong, we agree correct?
When we agree right from the start, I can skip the technical analysis and move straight to the target. Because everybody knows JUPUSDT is set to grow really strong in the coming months.
Back in early 2024 a market bottom led to growth. A 325% bullish wave developed within 49 days. The bulk of the action happened within 33 days. We can say +100% profits every ten days, sounds good. Looks great.
We know for a fact that this pair can grow more than 300% in a single month. What if the bullish phase is stronger now, longer now... How much growth would be possible if JUPUSDT grows straight up for 3 months? What about six months?
Here I have an easy target at $2.14 with 430% profits potential. This is mid-term, within 3 months.
My ideas and believe project think see much more happening in 2025 than what I am showing on this chart. But this is the start. This is an easy 430% wave. It can start now, soon, within days but once it starts going it will keep on going non-stop until the end. Sorry, no wait; one stop before the final bull run, but the whole process can take more than six months.
Are you ready?
How are you going to maximize profits if you are one of those trading this coin?
What's your plan?
Will you buy and wait for everything to be up in order to sell? Meaning, just securing lower prices now and "let the market take care of the rest"?
Or, are you going to set up your sell orders on target, selling portions at each resistance level as prices grow?
Are you going to buy with leverage? Are you ready to lose everything if the market shakes? Are you going with 2-3X or 10-20X? I would always recommend the lower end because it is better to earn a sure 200% than lose everything looking for an uncertain 10,000%.
What you do is up to you. But here you have this chart; you know what is coming, you have the blessing of knowing ahead of time so you can plan based on your own trading style and goals.
It can be big or it can be small but we are all going to win if we approach the market with the right mindset, and if we keep risk to a minimum. Some people like high risk though and that's ok too. There is something for each and every one of us.
Jupiter will end up going much higher than what is shown on the chart.
Namaste.
