Fun Token: March 2026 New All-Time High? It Will Be FunA very strong bullish signal is present on this chart and we have some interesting price dynamics as well and a time-fractal to consider.
Good evening my fellow Cryptocurrency trader, how are you feeling today?
There was a very strong market flush recently with FUNUSDT (Fun Token), removing all LONGs and all SHORTs between December 2024 and April 2025.
After December, there was a crash producing a major low. The lowest prices in 5 years, since March 2020. Then immediately there was a strong rise producing the highest prices since December 2023. Then a retrace and the action goes back to baseline.
The multiple years long low removes all LONGs. The more than a year strong high removes all SHORTs. A full market flush.
The very strong bullish signal is related to the low point from June 2023. As the present retrace ends, the action is back above this level and this is super-bullish.
From March 2020 through late March 2021 we have 55 candles and 385 days. The same would give us a date of 30 March 2026 for the new ATH. That is if FUNUSDT grows in exactly the same way. This is just an entertaining exercise. This bull market can last 221 days, 180 days, 360 days... Anything goes. It can last 465 days for all I know, but, if the same pattern repeats, we have an entire year to see the market grow.
The exact date? The exact high? Anything goes.
What cannot be doubted is the fact that the Cryptocurrency market is set to produce the strongest growth period since 2021. It will be FUN.
Namaste.
Crypto

Gains Network Consolidation At Market Bottom, 1,176% Profits PotGains Network hit bottom in early February. Consolidation at the lows has been ongoing now for 133 days. This phase is reaching its end.
This is truly a wonderful chart, a great trade-setup. Many altcoins hit bottom in April, some even earlier and did so in March. The earlier the bottom, the stronger the pair. This one hit bottom in February which means that buyers were always present in the ensuing months. As the overall market continued to hit new lows, Gains Network was growing from its base and this is bullish.
This week we have a full green candle after five weeks of bearish-neutral action. The first three weeks were bearish and the last two neutral, a perfect transition. From bearish to neutral, from neutral to bullish. We will now experience very strong wave of growth.
We can expect first an easy target of 339% to hit within 1-2 months. Then we have more and 719% potential profits come into focus, 2-4 months. Last, and it can go higher, a new all-time high at $16 produces 1,176%. It will be fun to watch. We are ready and waiting... Thank you for joining me. Feel free to follow.
Namaste.

HBAR to $1.00If price breaks between the 50%-61.8% retracement I'm looking for a long position to $1.00.

Bitcoin Short-Term Recovery Confirmed Bulls Win!Ranging markets/sideways markets is when traders lose the most money. Always keep this in mind.
» Short-term signals are pointing to a recovery right away.
» Bitcoin's drop wicked below the 13-June low but the RSI produced a higher low and thus we have a bullish divergence.
» Bitcoin's current drop went lower yet the chart reveals lower volume now compared to 13-June. This reveals weakness on the bear camp. This means a recovery will happen next, right away.
These are just a few signals but taken together with the altcoins analysis that I showed you and the bigger picture; Ha ha! The bulls win again.
Namaste.

XDC to $0.35 We have reached in between 50& and 61.8% retracement after breakout from triangle pattern. Looking for XDC to go to 141% price target.

BITCOIN BEARISH SETUPBitcoin (BTC/USDT) – Breakdown from Double Top Confirms Bearish Trend Continuation
The 4-hour chart of BTC/USDT (Binance Perpetual Contracts) presents a textbook double top formation followed by a confirmed breakdown below structural support levels. The bearish trend has already met its first target, and technicals suggest the move could extend lower toward the key demand zone around $96,000.
🔍 Key Technical Highlights:
Double Top Pattern: Clear double top structure formed between $109,000–$110,000, followed by a strong rejection.
Support Break: Price broke down below key support at ~$105,000, triggering a sell-off and validating the bearish reversal.
Bearish Retest: After the breakdown, price retested the broken trendline (highlighted with a red zone) and failed to reclaim the range.
First Target Hit: Price achieved the first projected support zone at around $101,000.
Next Target: Based on measured move projection and previous structure, the next downside target lies near the $96,000 mark.
📉 Outlook:
The structure remains bearish as long as BTC trades below the broken support-turned-resistance zone (~$105,000). Momentum favors continued downside toward the next key zone unless a significant bullish reversal signal emerges.

BITCOIN BEARISH SETUPTechnical Analysis Summary:
Pattern Formation: The chart shows a descending triangle pattern with double tops, indicating bearish pressure at resistance levels.
Breakdown Confirmation: Price has broken below a key ascending trendline (shown in dashed line) and retested the breakdown area, forming a bearish rejection (highlighted red zone).
Key Zone: The price is currently trading around $105,075, just under the previous support-turned-resistance zone (~$106,000). This confirms a failed bullish structure and strengthens the bearish outlook.
Targets:
First Target: Around $101,000–102,000, aligning with the next visible support zone.
Second Target: Around $97,000–98,000, which is a major support / key zone based on prior structure.
Bias: Bearish in the short term, as long as price remains below the $106,000 resistance zone.
Trade Setup Outlook:
A short position is implied by the arrows.
Best entries are around retests near $105,500–106,000 with stops above the recent highs (~$107,000).
Conservative profit-taking at the first target, with extended TP near the key support zone.

FUN/USDT – Triangle Formation Close to Breakout Point
Pair: FUN/USDT
Timeframe: 1H
Pattern: Symmetrical Triangle
FUN is consolidating inside a symmetrical triangle, but recent candles show pressure on the lower trendline. Price is hovering around 0.0070 and just tested the ascending support. This structure usually leads to a breakout — but the direction will depend on how price reacts in the next few candles.
**Bearish Bias:**
If the price breaks and closes below the triangle with volume, we may see a quick move toward the 0.0045–0.0050 support zone. Sellers are trying to push it out of consolidation.
**Bullish Scenario:**
To shift bullish, FUN must reclaim the 0.0075 level and break above the triangle resistance. Only then a trend reversal or new rally can begin.
No confirmed breakout yet — stay patient and let the move confirm itself.

BNB Analysis (Crypto)Here is my analysis on BNB, the native token of Binance. I'll be using ICT concepts, primarily liquidity, efficiency, PD Arrays, and premium/discount/OTE.
Hope you find it insightful in knowing where price is going to go!
- R2F Trading

USDCAD DETAILED ANALYSISUSDCAD has formed a classic falling wedge pattern on the daily timeframe, with price currently pressing against the upper trendline resistance near 1.37300. This is a high-probability bullish reversal setup, and the pair is showing early signs of a potential breakout. The recent bullish momentum from the lows suggests buyers are stepping in aggressively, and if we get a strong daily close above the wedge, it could confirm the start of a new upward leg. My near-term target for this breakout is 1.47300, offering an excellent risk-reward profile.
From a fundamental perspective, the Canadian Dollar is currently under pressure due to weakening oil prices and softening domestic economic data. The Bank of Canada has recently signaled a dovish tilt following its latest rate cut in June, citing slower GDP growth and easing inflation. On the other hand, the US Dollar is finding renewed strength backed by sticky inflation and the Fed’s cautious stance on rate cuts. The divergence in monetary policy between the Fed and BoC is creating a favorable environment for USDCAD bulls.
Technically, the confluence of wedge resistance, bullish divergence on the RSI, and a clear higher low formation all point toward a breakout scenario. A break above 1.37600–1.38000 would unlock the next wave of bullish continuation, potentially accelerating momentum toward the 1.47 handle. This area also aligns with the previous March highs, making it a strong technical magnet.
I remain bullish on USDCAD and will be watching the breakout closely this week. If the pair holds above 1.36800 and breaks structure convincingly, I’ll be adding to longs on confirmation. The current setup presents a textbook breakout opportunity supported by strong fundamentals, technical structure, and market sentiment leaning in favor of the USD.

WINkLink & Bullish AltcoinsYou thought I was a goner? You thought I sold my soul to the bearish side? No way... Consider the chart.
You know my altcoins analyses are good and straight, always right long-term. The macro, the bigger picture. Can't go wrong because there are only two possible directions. Once one is exhausted the market goes the other way. It is very easy when you think about it...
A pair that is trading near its all-time high can easily falter and move lower, I don't see anything wrong with that; nothing strange. A pair that is trading at very low prices near support, I can easily see a recovery around the corner, nothing changes on this front.
I would still recommend now selling those at resistance, buying those at support. Makes a lot of sense to me.
If you are spot, ignore those trading high up and buy those trading low and hold. Everything will be clear in a matter of months because even if the bullish action starts in two to three weeks, it takes months for a bullish wave to develop in full force... Everything can change in a day.
Thank you for reading.
Namaste.

Toncoin, Bullish On Everything; We Will WinSee (or watch), Toncoin is consolidating the higher low. I think I need to use new/different words because repeating the same words will get you bored eventually. Ok, that doesn't matter since we are talking about money right? If my analysis ends up being positive and being a money maker, then we can accept repeating the same terms over and over, what do you say?
Sounds good to me; I hope it resonates with you.
Let us see if you can grasp the situation from my perspective.
When Toncoin peaked in April/June 2024 I told you the thing was going to "go back to baseline" and produce a crash and then consolidate at the lows, etc., before a new wave of growth was possible. This is happening now but the fact that it is happening now also means that the down-wave is over.
After the bearish move comes the bullish move.
You know, this bearish move took more than a year to complete so you might not even remember when I was sharing all those bearish charts. The bullish move is the same, by the time prices go up and the market becomes bearish again, you will forget that I was telling you "it is going up," when the action was happening at bottom prices.
Technical analysis —TONUSDT
Classic price dynamics are present on the chart. The bottom is hit 11-March and there is a very strong reaction supported by high volume. Then the market goes sideways within a higher low.
That's it, this is the last consolidation at low prices before maximum growth. That's just the way it is. The market goes down, the market goes up.
It peaked more than a year ago now, June 2024. That is a long time ago specially in Crypto-terms. Once the bottom is hit, the market recovers and goes on a bullish wave.
How long will it take? 2 months? 1 week? 2 weeks?
Doesn't matter; it is coming, it is sure, it is true, it is easy, we will win.
Namaste.

Solayer, Big Rewards For The Patient, 630% Target ExposedYou could say that this is not an easy one because of Bitcoin's current situation. When Bitcoin is shaky, doubtful, the entire market becomes doubtful and hard to approach, but still, we buy the bottom/support and sell when prices are up.
Solayer produced an uncharacteristic rise previously, it can always repeat a strange behavior, it can detach from the market and move in its own way. There are always pairs that can do anything and do move strangely but also, market conditions can be something today and something different the next day. We shouldn't ignore a good opportunity based on assumptions or something that is not confirmed.
Solayer produced a double-bottom and the volume is good now with the current bounce.
There is also an ending diagonal (blue), which is a reversal pattern.
Say the short-term goes awry and Solayer continues lower, it hits a lower low; how long is it going to take for a reversal to happen? Once we hit bottom, if the bottom is not hit it isn't likely to be far away.
Say things go very bad and we get another low; how long will it take, two months?
That's the beauty of Cryptocurrency trading. Say it does go bad and instead of a reversal we get lower and it takes two months for prices to go up. Guess what? Profits potential would still go beyond 200% within 3 months. That's pretty good for sure no matter how you slice it, think long-term.
On the other hand, one can easy hit the first target for 130% or more within one month, short-term. If it doesn't work, try again, but you can't go wrong if you buy and wait. Notice the difference between current price and the all-time high... It is a nice chart setup, a nice trading opportunity; easy money, depending on your strategy, your thinking, your mindset.
If you are in too much a hurry, ok, you can secure a loss. If you have patience, you can end up with another win in the coming months. It is a great situation. Get ten like these and you set up yourself for success in the short-term. Once your targets hit, can take 3 months or 3 days, find a new set of charts. New opportunities are available every single day.
Take the time to take action. Take the time to choose; choose wisely, and the market will reward you with tons of profits; Crypto is here to stay.
Thank you for reading.
Your support is appreciated.
Namaste.

BITCOIN Free Signal! Buy!
Hello,Traders!
BITCOIN is retesting a
Horizontal support level
Around 101,288$ from
Where we will be expecting
A local rebound so we can
Go long with the Take Profit
Of 104,324$ and the Stop
Loss of 100,300$
Buy!
Comment and subscribe to help us grow!
Check out other forecasts below too!
Disclosure: I am part of Trade Nation's Influencer program and receive a monthly fee for using their TradingView charts in my analysis.

ETHUSD Break- Test- GO!!! Nothing Changed!I have to repost this bc TV only gives me limited updates before it forces "target reached." Here is my previous post.
Nothing has changed. Just as I expected. If anything, it looks even more bearish now. As always, wait for the hook!
Click Boost, and follow Let's get top 5,000!

SOLANA MARKETCAP LOOKS COOKEDIs that a Head and Shoulder's top?
Is #crypto about to endure a Iron dome penetration event?

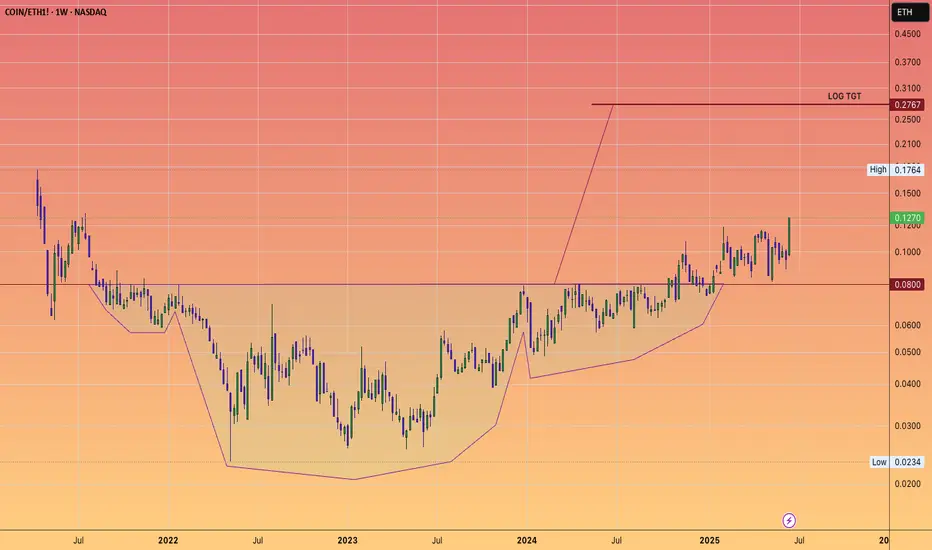
The Chart you don't want to see: Coinbase Vampire attacked ETHBrian Armstrong is a significant influencer in both Silicon Valley and now Washington, D.C., where he is instrumental in shaping legislation and attracting investments that benefit Coinbase and its shareholders.
Vitalik writes blogs and appoints EF directors who appear to have ambiguous gender identities and are quite out there on the spectrum.
Jesse Pollak is yet another astute player who has leveraged ETH's technology to transform BASE into a powerhouse integrating neatly into Coinbase platform for payments and now DEX trading within app.
ETH will thrive.
However, as we've observed, Joe Lubin's return as a public figure to advocate for and steer the future of Ethereum has never been more crucial.
But will it be sufficient to compete with Brian and Jesse? They seem to be operating on a significantly higher plane.
Bitcoin CME Gap June 21thBitcoin has a CME gap at $103.292 . Historically, these gaps tend to get filled and if it happens again, it could mean a short-term move before continuation.

AERO: Clears the Runway! Can it gain altitude!?AERO gave a valid long setup
We were eye a possible retrace of an impulsive move and it displayed enough to trigger a rules-based entry.
Technical Breakdown
Key structural elements supported the setup:
Initial leg up showed impulse-like behavior
Pullback found support at a clearly defined AOI
Multiple MLT levels aligned with a common zigzag framework
Swift bounce off the Golden Corner Pocket (GCP)
Break and close above 0.54 completed the impulse structure
Prior resistance flipped into support
Volume confirmed the move, and price reached the first algo target, producing a reactive wick and confirming potential of algo activity.
This created a textbook TDU-style GCP/Algo/C-3 setup with measured entry and exit.
Risk Management
Partial profit was taken at the first MLT zone
Stop loss was moved into profit post-structure break
Scenario planning:
If move continues: positioned
If move stalls as a larger zigzag: no loss
Outlook
Attention now shifts to the next actionable level, possible second entry long
0.62 is the AOI for re-entry atm
Ideal scenario = Continuation in a wave 3, obvi
Alt scenario = Clean corrective to AOI + long
Bear scenario = Zig Zag complete
Conclusion
The trade played by the book!
Confluence across AOI, GCP, MLT, and volume created a qualified entry — not a guess.
This remains a great example of structure over sentiment and waiting for the market to meet criteria before engaging.

BRIEFING Week #25 : Heading into Summer ModeHere's your weekly update ! Brought to you each weekend with years of track-record history..
Don't forget to hit the like/follow button if you feel like this post deserves it ;)
That's the best way to support me and help pushing this content to other users.
Kindly,
Phil

BTCUSD – At a Make-or-Break LevelBTCUSD – At a Make-or-Break Level: Will Bitcoin Rebound or Slide Further?
Bitcoin continues to hover near a critical support level after last week's sharp drop. With rising macro uncertainty, shifting institutional flows, and growing interest in crypto regulation, BTCUSD is showing signs of a potential reversal — but traders should proceed with caution.
🌐 Macro Outlook – Debt Pressure, ETFs & Election Talk Fuel Uncertainty
US fiscal stress is building: Analysts warn that the United States could see interest payments exceed $1 trillion in 2025 — more than its defense or healthcare budget. This puts pressure on the Federal Reserve to consider fiscal tightening instead of rate cuts.
Spot Bitcoin ETF inflows are slowing: After a strong start in early 2024, institutional flows into spot BTC ETFs have cooled down recently. Hedge funds and asset managers are waiting for more clarity on economic policy.
Pro-crypto narratives gaining traction in US politics: With elections approaching, political figures are floating proposals to use Bitcoin as a strategic reserve asset and encourage crypto-based financial infrastructure.
Meanwhile, the US Dollar Index (DXY) remains volatile. A weaker dollar could support crypto, but stronger-than-expected inflation data may fuel further caution.
📉 Technical Analysis (BTCUSD – H1 to H4)
BTC is currently trading within a medium-term descending channel, and has recently tested the key support zone near 103,108.
A potential V-recovery pattern is forming. If buyers can hold this zone and break above 104,184, the price may target 106,047 and eventually 107,586.
However, EMA clusters (50–100–200) on the H1 chart are still pressing downward. A confirmed bullish reversal would require a breakout above 105,200 with strong volume.
✅ Suggested Trade Plan
🟢 BUY ZONE: 103,100 – 103,300
Entry: On price reaction with confirmation candlestick
SL: 102,600
TP: 104,184 → 106,047 → 107,586
🔴 SELL ZONE: 107,500 – 107,800
Entry: Only if price rejects resistance at upper channel
SL: 108,200
TP: 106,000 → 104,500
⚠️ Avoid aggressive shorting in the current range to reduce false breakout risk.
💬 Final Thoughts for Indian Traders
The current market is caught between macroeconomic caution and long-term crypto optimism. Bitcoin is holding near its lower range — a zone that historically triggers upward momentum.
For Indian traders, the key is to wait for clear structural confirmation and respect technical levels. Let price and macro alignment guide your decisions, not emotion or hype.
Plan the trade. Trade the plan. Protect your capital.

Stablecoin Market: A Clear Path to Bitcoin Over $700k?I've been following the strong correlation between stablecoin liquidity ( CRYPTOCAP:USDT , CRYPTOCAP:USDC , etc, here represented by CRYPTOCAP:STABLE.C ), and the Bitcoin price, and there's a very clear correlation between both.
Why is there a correlation between the stablecoin market and BITSTAMP:BTCUSD ?
An increase in stablecoin market cap means that more money is available to be invested in crypto and Bitcoin.
The more stablecoin liquidity exists, the easier it is for investors to invest in crypto. That's why we see a very strong correlation between the stablecoin liquidity and Bitcoin: the long-term correlation is 86%.
So now we know that BTC price follows the stablecoin liquidity.
The GENIUS Act and the stablecoin market
Treasury Secretary Scott Bessent recently posted that the stablecoin market could grow from the current $263 billion to $3.7 trillion. the data comes from a BIS report.
Why does this matter?
If the stablecoin market grows to $3.7 trillion and we continue to observe the high correlation with Bitcoin, the Bitcoin price would land between $700k and $1 million by 2030.
Let me know your thoughts!

Bitcoin Could Hit as High as $400KWhen comparing our macro cycle to the 2017 cycle, we see the potential for a very parabolic run on Bitcoin. I believe Bitcoin could hit as high as $400K by 2029. This is because Bitcoin tends to follow the stock market, and I anticipate a major blow-off top coming for the stock market. I expect one more big parabolic run on the Dow Jones leading up to 2029, which would fuel Bitcoin’s rise to $400K.
The lowest I see Bitcoin going during this parabolic run is $250K. On the higher end, I could see it hitting $400K or even more. Big things are coming.
As always, stay profitable.
— Dalin Anderson
