ALTCOINS: Market bottomed and about to surge.The Altcoin market is almost oversold on its 1W technical outlook (RSI = 30.160, MACD = -0.160, ADX = 18.210) but this very same 1W RSI pattern has emerged numerous times before an altcoin market surge (Altseason). How high it can go depends on whether the Fed will cut on its next meeting or not. Nevertheless, this level is an excellent opportunity to start investing in altcoins.
## If you like our free content follow our profile to get more daily ideas. ##
## Comments and likes are greatly appreciated. ##
Crypto

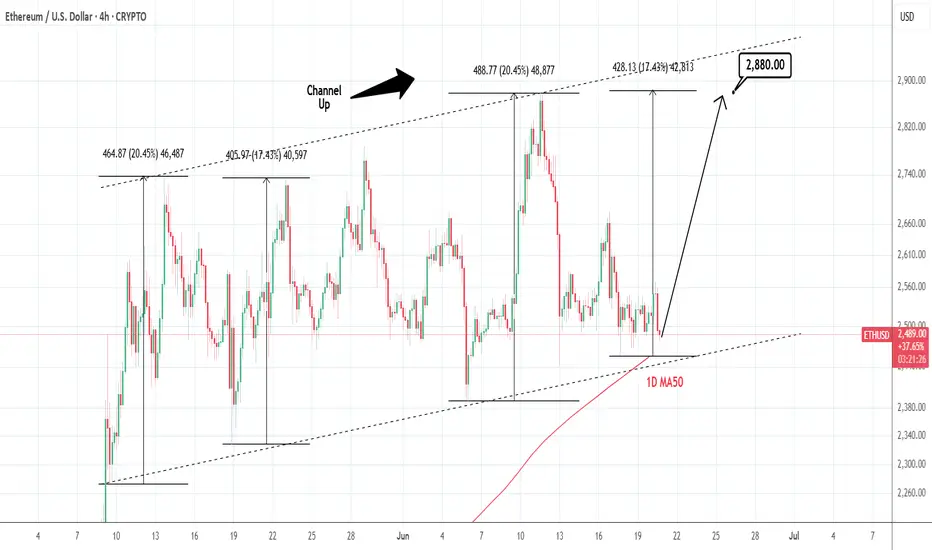
ETHUSD: Channel Up testing 1D MA50. Optimal buy.Ethereum is neutral on its 1D technical outlook (RSI = 47.020, MACD = 17.220, ADX = 20.205), consolidating for the past 3 days. This time it is about to test the 1D MA50, which is technically the long term Support. Since it is also almost at the bottom of the Channel Up, we see this as the most optimal level to buy and aim for the same +17.43% rise (TP = 2,880) it did in May.
## If you like our free content follow our profile to get more daily ideas. ##
## Comments and likes are greatly appreciated. ##
HelenP. I Bitcoin can correct to trend line and start move upHi folks today I'm prepared for you Bitcoin analytics. In this chart, we can observe how the price developed a gradual upward trend, respecting the trend line as dynamic support multiple times. After each interaction with this line, the price showed a consistent pattern of rebounding and continuing its upward movement. Recently, the price faced a notable correction, which pushed it back toward this trend line once again, a critical zone that has proven its relevance as a support area. Upon touching the line, the market reacted with a bounce, signaling that buyers are still active and defending the structure. The price began to climb again, regaining some momentum, though it hasn’t yet managed to break the previous highs. Now BTCUSD is hovering near the ascending trend line, preparing for what could be another retest. If the trend holds, we may see a short-term decline toward this line, followed by a bullish rebound. I expect the price to push higher from this level, targeting the resistance zone near 108300, which also acted as a rejection area in the past. If you like my analytics you may support me with your like/comment ❤️
Disclaimer: As part of ThinkMarkets’ Influencer Program, I am sponsored to share and publish their charts in my analysis.

Bitcoin may rebound from support line of wedge and start to growHello traders, I want share with you my opinion about Bitcoin. Initially, the price was trading inside a well-defined range, moving sideways with repeated rejections from both support and resistance. After several attempts to stay above the support zone, BTC finally broke down and sharply declined below the 104000 level, entering the buyer zone. However, the decline was short-lived. Price quickly rebounded from the lower boundary and formed a strong bullish candle, suggesting that buyers were still active. After this recovery, BTC began forming a wedge pattern, with a gradually narrowing structure between the resistance line and the ascending support line. This kind of price action typically signals a buildup of pressure and potential breakout. Currently, BTC is once again testing the support line of the wedge and hovering near the buyer zone, where it previously reversed. This level has proven significant and is now being retested. Given the current structure, the wedge formation, and price behavior near the support, I expect BTC to rebound from this zone and start climbing back toward the upper resistance area. My current TP 1 is set at 106800 points, which aligns with the mid-level of the previous impulse zone and the inner resistance of the wedge. Please share this idea with your friends and click Boost 🚀
Disclaimer: As part of ThinkMarkets’ Influencer Program, I am sponsored to share and publish their charts in my analysis.

HYPER ANALYSIS🔮 #HYPER Analysis - Update 🚀🚀
💲 We can see that there is a formation of Falling Wedge Wedge Pattern in #HYPER and we can see a bullish movement after a good breakout. Before that we would see a little retest and and then a bullish movement.
💸Current Price -- $0.1087
📈Target Price -- $0.1358
⁉️ What to do?
- We have marked crucial levels in the chart . We can trade according to the chart and make some profits. 🚀💸
#HYPER #Cryptocurrency #Breakout #DYOR

ETH - Do you Notice a Pattern here? I DO...Hello TradingView Family / Fellow Traders. This is Richard, also known as theSignalyst.
📈I find ETH 4h chart as it looks like history repeating itself.
Previously in 1 to 5 June, it formed a slight lower low before starting the next big bullish impulse leading towards the upper bound of the channel.
📚 Today, ETH just formed the slight lower low we are looking for.
Is it time for the next bullish impulse to start? well it will be confirmed after breaking above the last major high at $2,600.
What do you think?
📚 Always follow your trading plan regarding entry, risk management, and trade management.
Good luck!
All Strategies Are Good; If Managed Properly!
~Rich

ETH/USDT Key Levels Reclaimed on 4HOn the 4H, price has closed above the 5D + 3D, and W resistance levels.
Will these levels hold and become a launchpad for new higher highs—and possibly counter the 200MA?
We can’t know for sure, but we can make educated guesses.
Always take profits and manage risk.
Interaction is welcome.

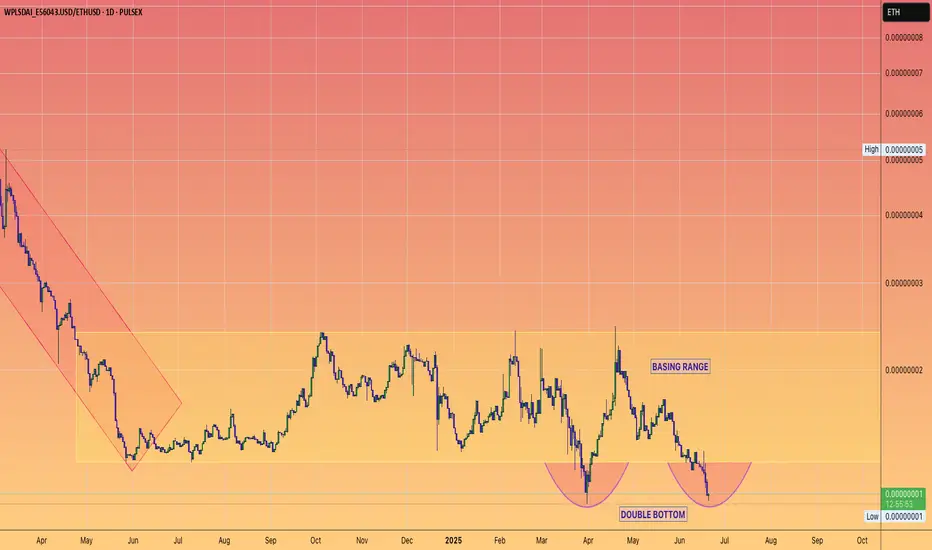
PULSECHAIN v ETHEREUMFirst objective: To get back in the Yellow basing range.
Second objective: Test the upper boundary of the Yellow range.
Third objective: Breakout
Pulsechain's marketcap is less than the ETH that is publicly held by Richard Heart from the PLSX public raise.
Reminder RH beat the SEC
Funds are clear.
Tickers have regulatory clarity as deemed non securities.
Mid July Richard can talk freely if he so wishes.
Irrational prices right now.
Signs of capitulation on Twitter and on chain.
Bitcoin– bearish momentum builds after rejection at $109KIntroduction
Bitcoin (BTC) is currently showing weakness after forming a lower high at $109,000. This level acted as a significant point of rejection, and since then, BTC has been moving lower. The price has broken through key support areas, indicating a possible shift in market structure. In this analysis, we’ll break down the recent price action, explain the technical signals behind the move, and discuss what could be expected in the short term.
Rejection from the 0.786 Fibonacci Level
The rejection at the $109,000 level aligns perfectly with the 0.786 Fibonacci retracement on the 4-hour timeframe. This level is often seen as a strong resistance point during corrective moves, and in this case, it held firmly. The precision of this rejection gives it more weight, and since hitting that point, BTC has been steadily declining. This move down suggests that buyers were unable to push through the resistance, leading to increased selling pressure.
Break of the 4H Bullish FVG
As BTC started its decline from $109,000, it broke through the bullish Fair Value Gap (FVG) that had formed earlier on the 4-hour chart. This gap previously served as a support zone but has now been decisively broken with strong volume. The loss of this level is significant, as it marks a breakdown of the bullish structure and opens the door for further downside movement. In the process of this move lower, BTC has created a new bearish FVG on the 4-hour timeframe. This gap remains open and could potentially act as a magnet for price to revisit, offering a possible short entry if price retraces into that zone. However, the clear break below the previous bullish FVG indicates a shift in momentum and supports a more bearish bias for now.
Downside Target at $102.7K
Given the recent breakdown, the next key level to watch is around $102,700. This area marks the wick low on the 4-hour timeframe and stands out due to the size and sharpness of the wick. Such large wicks often leave behind unfilled orders, which markets tend to revisit over time. The presence of these resting orders makes this level a likely target for the ongoing move down. It also acts as a strong area of potential support, where buyers might step back in if the price reaches that point.
Conclusion
With the rejection from the 0.786 Fibonacci level and the failure to hold the bullish 4H FVG, BTC has shown clear signs of weakness. The breakdown in structure suggests a continuation to the downside is likely, with $102.7k being the most immediate target. This level could serve as a strong support zone due to the unfilled orders left behind by the previous wick. Until BTC reclaims key support levels or shows a shift in momentum, the bias remains bearish in the short term, and traders should remain cautious while expecting further downside.
Thanks for your support.
- Make sure to follow me so you don't miss out on the next analysis!
- Drop a like and leave a comment!

HolderStat┆AVAXUSD held the trend lineBINANCE:AVAXUSDT is rebounding from the 19 support after a falling-wedge break, flipping the pullback into bullish continuation. Holding the trend-line keeps Avalanche pressed north; clearing 22.8 unlocks 25 and fresh-highs narrative 📈

BITCOIN (BTCUSD): Strong Bullish Confirmation?!
Bitcoin has a high chance to rise more, following
a strong bullish reaction to a rising trend line on a 4H.
Goal - 108000
❤️Please, support my work with like, thank you!❤️

AAVE/USDT – Symmetrical Triangle Squeeze on 4HAAVE/USDT – Symmetrical Triangle Squeeze on 4H
Chart Pattern: Symmetrical Triangle
Timeframe: 4-Hour
Published: June 20, 2025
AAVE/USDT is currently consolidating within a symmetrical triangle. Price is respecting the rising support near the 243–245 zone, while being squeezed by a descending resistance around 263–265. This pattern typically leads to a breakout as volatility compresses.
Bullish Scenario
Entry: On a 4H candle close above 265 with volume
Target 1: 278
Target 2: 290
Stop-loss: Below 242
Bearish Scenario
Entry: Close below 243
Target 1: 230
Target 2: 215
Stop-loss: Above 260
Let the breakout confirm with strong volume before taking a position. Patience is key as AAVE approaches the apex of this formation.

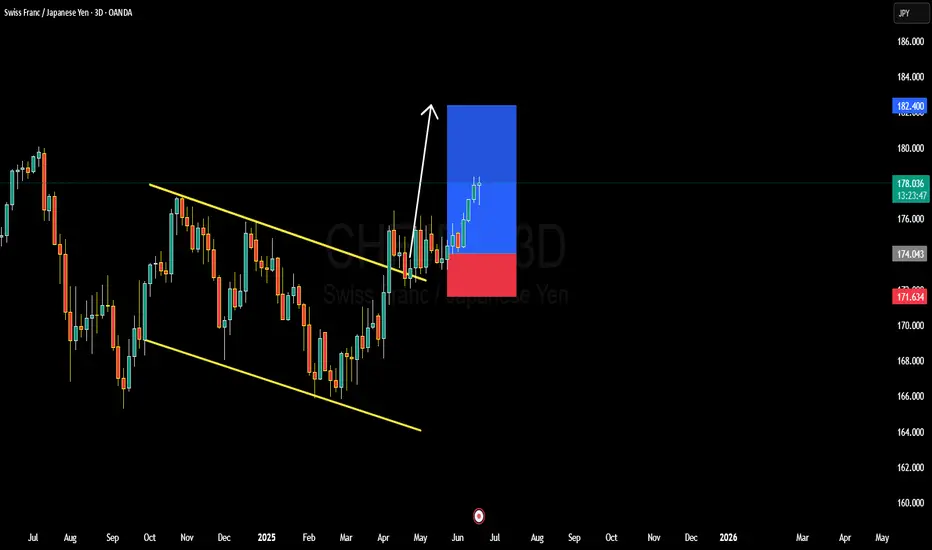
CHFJPY BULLISH OR BEARISH DETAILED ANALYSISCHFJPY has continued to play out exactly as forecasted, breaking out cleanly from the descending channel on the 3D timeframe and rallying strongly above key structure. Price is currently trading around 178.00, already delivering solid upside from the breakout zone. The bullish breakout was confirmed by consecutive impulsive candles with minimal retracement, a clear sign of institutional strength behind this move. As long as this momentum holds, the next major target is 182.00 – a psychological level and previous structure high, now acting as a magnetic zone for price.
On the fundamental side, the Swiss Franc continues to enjoy safe-haven flows as global macro uncertainty persists. The Swiss National Bank has maintained a relatively tight stance, with inflation staying stable and CHF demand picking up. On the flip side, the Japanese Yen remains broadly weak due to ultra-loose monetary policy from the Bank of Japan. BOJ’s reluctance to shift away from yield curve control and negative interest rates makes JPY one of the most attractive funding currencies, driving consistent CHFJPY upside.
Technically, this move is supported by a textbook breakout from a falling wedge pattern, which historically has a high probability of bullish continuation. The volume and momentum on the breakout were strong, and we have a clean higher high and higher low structure forming. This confirms the end of the correction phase and a transition into a trending bullish cycle. With the current risk sentiment leaning toward CHF strength and JPY weakness, I’m confident in further upside toward my 182.000 target.
I’ll continue to trail stops below 174.00 to lock in profit while giving the trade room to breathe. If price consolidates near 179.50–180.00 with low volume, I may look for re-entry setups on pullbacks. As of now, CHFJPY remains one of the strongest trending pairs on the board, and I’ll stay long as long as the structure holds.
XAU/USD 2h chart pattern.I'm provided for XAUUSD (Gold Spot / U.S. Dollar) on the 2-hour timeframe, here's the analysis:
---
📉 Chart Pattern Insight
A clear ascending channel was forming.
Price broke below the lower trendline (highlighted in orange), signaling a potential bearish breakdown.
The price is currently retesting the broken trendline and starting to reject it — a bearish sign.
---
🎯 Target Levels Identified on Chart
You’ve marked two bearish targets with arrows:
1. First Target: Around $3,280
This aligns with a previous minor support area.
A reasonable short-term target after the trendline break.
2. Second (Deeper) Target: Around $3,245
Likely based on the full height of the channel projected downward (measured move).
This level could be the next major support.
---
📌 Summary:
Target Price Level Confidence
First Target ~$3,280 Medium-High
Final Target ~$3,245 Medium
---
Let me know if you'd like help setting stop-loss levels, trade management tips, or a risk-reward calculation based on your entry.

XAU/USD,15M CHART PATTERN.gold at 3412, and im listed the following targets:
Target 3482 → This is above your entry price, so it looks like a mistake if you're in a sell position.
Target 3340 → Logical downside target.
Target 3320 → Another lower target, continuation of bearish momentum.
Corrected View (Assuming SELL from 3412):
Type Level
Entry 3412
TP1 3340
TP2 3320
SL (suggested) 3445–3450 (above recent highs)
Let me know if the 3482 was meant to be your stop loss instead — that would make more sense in this context.

XAU/USD.4h chart pattern.XAU/USD (Gold vs US Dollar) on the 4-hour timeframe, and it indicates a bearish breakdown from an ascending triangle or wedge pattern. The trendline has been broken, and the price has moved below the Ichimoku cloud, supporting a bearish outlook.
📉 Bearish Targets Identified:
1. First Target Zone (Minor Support):
Price Level: Around 3,300 – 3,310
This is the first horizontal support area after the breakdown.
2. Second Target Zone (Major Support):
Price Level: Around 3,250 – 3,260
This is the second marked target and more significant support zone based on past price action.
🔻 Summary:
Pattern: Rising wedge / ascending structure breakdown.
Breakdown Confirmed: Price below trendline and Ichimoku cloud.
Target 1: 3,300 – 3,310
Target 2: 3,250 – 3,260
Stop Loss (Suggested): Above 3,380 (cloud resistance / previous high).
Let me know if you'd like entry/SL/TP levels or a written analysis for posting.

ETHEREUM Risky Long! Buy!
Hello,Traders!
ETHEREUM is consolidating
Above the horizontal support
Area around 2360$ and we
Are already seeing a local
Rebound from the level
So as we are bullish biased
A further price growth
Is to be expected
Buy!
Comment and subscribe to help us grow!
Check out other forecasts below too!
Disclosure: I am part of Trade Nation's Influencer program and receive a monthly fee for using their TradingView charts in my analysis.

Sei Goes Bullish, Same Pattern & SequenceIt is the same price pattern and sequence. A bullish wave ends December 2024 and leads to a correction. The correction ends with a bottom 7-April. This bottom marks the start of a new phase, the bullish cycle. Recently, SEIUSDT produced a higher low and this higher low marks the start of the next advance, a bullish continuation.
Makes sense?
Bullish action already confirmed —The bigger picture
Today we have three green candles and the most bullish since the end of the initial bullish breakout. If you take this chart together with my other recent publications: COIN, ETH, DOGS, NOT and BCH, you can start to decipher the bigger picture. It is already confirmed.
A great opportunity
I am here to alert you of the event before it happens. Taking action now can be life changing or simply put, taking action now can translate into huge profits; the best possible entry after the 7-April low.
Don't worry, even if this opportunity gets away from you, the market will continue to produce countless more; endless opportunities the Cryptocurrency market has to offer for sure.
Thanks a lot for your continued support.
Namaste.

Bitcoin Cash, Anomaly or Predictive Signal?Some people can say that Bitcoin Cash right now is simply an anomaly, nothing to see here. But a closer look reveals nothing abnormal, more likely a very strong predictive signal that supports what we saw happening with the COIN stock and what was predicted recently to happen with ETHUSDT (Ethereum), that is, a very strong bullish breakout is the next main major market move.
Good morning my fellow Cryptocurrency trader, I hope this day finds you well.
How are you feeling?
Introduction —The market is one
In isolation, the market is tricky and hard to predict. Within a bigger context, we can easily predict what will happen next. Just look at Bitcoin Cash, it shows exactly what will happen because it has been being in perfect syntony with the rest of the market.
Many pairs are consolidating or retracing. My view is that a bullish move comes next.
Let's see how Bitcoin Cash has been behaving lately and compare this to the rest of the market. The fact that it is bullish now predicts that also the other pairs will be bullish because they are moving in the exact same way.
Price action —Past history
A crash ends in early August 2024. By late 2024 the action goes bullish. November 2024 marks the start of a month long advance that ends December 2024. This is true for most of the altcoins market.
The December 2024 peak leads to a correction with the main low happening 3-February. Another low and market bottom happens 7-April 2025. From this point on, we have a recovery and after a high in late May, the market goes into retrace.
Present day
This retrace is where we are today for most of the pairs. 100% of these are trading within a higher low compared to 7-April. Here BCHUSDT ended its retrace and moved ahead of the pack to hit a higher high compared to May. It also produced the highest price since January 2025.
The future
This is not an anomaly. Bitcoin Cash's price action simply reveals what is coming to the rest of the market. As it moved in perfect synchrony with other projects for months or even years, it will continue to do the same. The fact that it is trading higher now, means the other pairs will follow, in fact, some other pairs are already there; a bullish continuation.
Soon everything will grow.
Thank you for reading.
Namaste.

Notcoin, Get Ready For A New Bullish Wave; Never Give Up!You know these two tend to move together, Dogs and Notcoin. Also notice the strong similarities between the two charts.
Just for reference, DOGSUSDT I shared just a few minutes ago.
Past action
NOTUSDT (Notcoin) grew 125% as the initial bullish breakout in less than 1 month, 28 days. After the 7-April bottom. Here there was a double-bottom with the exact date being 16-April for the start of the last bullish move. The peak happened 14-May.
Back to basics
Current price action is trading within a strong higher low and the timing is right, the market is red.
Notice the need, the compulsion almost to buy when prices are low. Ahhhh, low, that's awesome. It is the best time to buy if what you want is profits, money, success. If you want the rush, losing money and stress, buy when prices are high and there is lots of hype.
If you want profits, success and growth, buy now when prices are low. I cannot stress this enough.
Where to next?
Very easy targets here we have 155% and 261%. Notcoin already grew 125% and remains within a strong higher low, this means that a higher high is mandatory next and it will happen, with a high level of certainty; this is sure, this is easy, it is just the way it is, it is how the market works.
First, you get a downtrend and there is always tons of red. Second, the market turns green and it always goes up. Both within the uptrend and downtrend you have bearish and bullish moves, only the bigger picture doesn't change. So you do get corrections in a bull market, periods of red but these tend to end just to produce more growth. This is what we are seeing today but only the start.
I can understand that many people are new to this market, to these pairs, to these charts; and so, there isn't much to go by. Notcoin has been trading only for a few months. But trust from someone with more than 10 years of experience in this market, since 2013, the next market phase is a major advance and it will be something like you've never experienced before.
In short, we are going up.
The time is right, the time is ripe. Prices are great.
Never give up
Genius and successful traders tend to buy when prices are low. Prices are low now.
I know it is hard to take the plunge, to move forward, to go ahead; but that is how it works.
If you want easy profits, sure profits and winning long-term, you have to detach from the herd mentality and move according to tested knowledge rather than impulsive buying.
How easy is to buy when everything is up?
Right now, instead of buying some people are actually thinking of selling, giving up. Never give up.
If you didn't sell when prices were high, why would you sell when prices are low?
Buy and hold
Better yet, buy and hold.
If you miss the next top, that's ok, keep holding long-term. But never sell at the bottom, it is a recipe for disaster; we all make mistakes.
If you are plagued by mistakes and you can't seem to get it right, never give up.
Go out and do some walking, running or whatever, when you comeback, you will be ready for more.
The market is not going away, there is a fortune here waiting for you, you have to prepare and the market will give you as much as you can take.
Thank you for reading.
Namaste.

Dogs, A New Round Of Growth, Easy 385% Target (1,045% Strong)Good afternoon my fellow Cryptocurrency trader, how are you feeling today?
Dogs has been bearish for more than a month after producing a nice ~150% jump after the market bottom. Would you say, 150% is big or small? Is this good or not good enough?
I say it all depends on how you approach the market. This type of move is awesome for short-term traders as well as leveraged traders, good profits can be made.
Long-term traders, well, they trade long-term so short-term moves make no sense. They don't make any difference.
Profits potential
The good news for long-term traders is that the "strong target" for DOGSUSDT is also an easy target and goes beyond 11X, 1,045% profits potential (PP).
The easy target is 385% and for a leveraged trader, with as little as 5X this can translate into 1,925%, but the risk is higher. Higher rewards potential but also higher risk. How you choose to trade depends on your risk tolerance, your capital, your goals.
I think this is a good chart setup, timing is great.
Market conditions and sentiment
Notice something, the market is quiet.
Notice something, there is no hype and no major event. People are not rushing to buy either. This means we are witnessing a market low. This is the exact-perfect time to buy and hold. When people are not watching or distracted doing other things, that's when the market grows. When the market has been growing for a long time, watch out because a correction tends to follow.
Now DOGSUSDT, and many other projects, have been bearish, or sideways, for more than a month. You see? After a month of rising prices you get a correction; April-May. After a month of bearish action you will get a bullish wave; May-June. The proof will come based on the results.
Timing is right, it should only take a few days. And the price is awesome. The downside is very limited almost fully exhausted.
Risk tolerance and trading approach
With all that said, be careful how you enter and how you trade. The market is tricky and tends to shake you out even if you hold a strong hand. Your position might not be at risk but with a sudden move, if you are unprepared, you can become anxious and fold at a loss. That is why planning is of the utmost importance. Just answer the question, how long am I willing to wait holding this pair? If it moves down, will I hold long-term or should I set a stop-loss?
Some people give up after 20%, that's ok. Because if you cap all your loses at 20%, then you cap your wins at 100% and 200%. You can end up winning long-term if you pick more winners than losers and that's easy with spot trading and the charts that I share daily.
Thank you for reading.
Namaste.

Bitcoin Short-Term 1H Timeframe, Next Target ConfirmedWe have two drops on this chart. The one of the left is more extended and long lasting compared to the one on the right. When a move is sudden with major force, it tends to end suddenly as well.
The recent drop was very steep and the force needed to keep pushing prices lower cannot be maintained, it requires too much energy; for this reason, a higher low is in place and the bulls win the game.
The action is happening above the blue line and space on the chart, this is the 0.618 Fib. retracement support. This is the most important level and so far it holds. Prices went below just to recover. Can be called a failed signal or a bear-trap, whichever you choose, the action is bullish above this level and bearish below.
Bitcoin's main support stands around $102,663, this level was not challenged. Since bears failed to push prices lower, the next logical move is a challenge of higher resistance. And the same pattern repeats, up and down, up and down... This is the short-term noise. When all is set and done, Bitcoin will resolve going up.
Patience is key.
Thank you for reading.
Thanks a lot for your continued support.
Namaste.

Ethereum, Bullish Breakout Expected Any Moment Now!Look at this, the first peak for Ethereum happened 13-May after the start of the recovery and the end of the downtrend. The lowest point happened five days later on 18-May and there has been no new lows since. Ethereum has been in a bullish consolidation pattern, a classic bullish flag.
This kind of dynamic clearly reveals a bullish bias and certainly, Ethereum is already trading pretty low compared to its last high.
A new and most interesting signal comes from the stock COIN, for Coinbase. This stock went ahead and produced a very strong bullish breakout yesterday with a green candle reaching +16%. COIN's chart and ETH are almost identical, exactly the same. Since these two move together, we can expect Ethereum to follow suit and do the same. We can expect a bullish breakout to happen any day now. Consolidation has been going long enough. It is time for the market to grow.
Some of the smaller altcoins continue to move forward, this is a signal that should not be ignored.
Namaste.
