BTCUSD: Israel-Iran conflict like October 2024.Despite the Middle East tension, Bitcoin remains long term bullish on its 1W technical outlook (RSI = 63.167, MACD = 6883.200, ADX = 33.150). It remains supported on its 1D MA50, in fact in the same manner it was during the previous Israel-Iran conflict. I was on October 26th 2024, when Israel launched three waves of strikes against 20 locations in Iran and other locations in Iraq, and Syria. Simila to the June 13th 2025 attacks. It is more than striking how similar the two price patterns are. Assisted by the U.S. elections on November 5th 2024, a massive rally followed the Middle East conflict. A repeat of that may very well send Bitcoin to $150,000 and above.
## If you like our free content follow our profile to get more daily ideas. ##
## Comments and likes are greatly appreciated. ##
Crypto

Long White Rock CryptoWhite Rock reached the 61.8% retracement. FOMO and dumb money has been shaken out. Looking for a long to new high at the 141.40%


#BSVUSDT #1D (ByBit) Falling wedge breakoutBitcoin Satoshi Vision is pulling back to 100EMA daily support where it seems likely to bounce and resume bullish, mid-term.
⚡️⚡️ #BSV/USDT ⚡️⚡️
Exchanges: ByBit USDT
Signal Type: Regular (Long)
Leverage: Isolated (2.0X)
Amount: 4.5%
Entry Targets:
1) 38.05
Take-Profit Targets:
1) 63.54
Stop Targets:
1) 29.54
Published By: @Zblaba
AMEX:BSV BYBIT:BSVUSDT.P #BitcoinSatoshiVision #PoW
Risk/Reward= 1:3.0
Expected Profit= +134.0%
Possible Loss= -44.7%
Estimated Gain-time= 2 months

ADAUSDT IDEAlower lows and a flat. Seems to be a trade opportunity which ever side it goes off breaking its current structure.

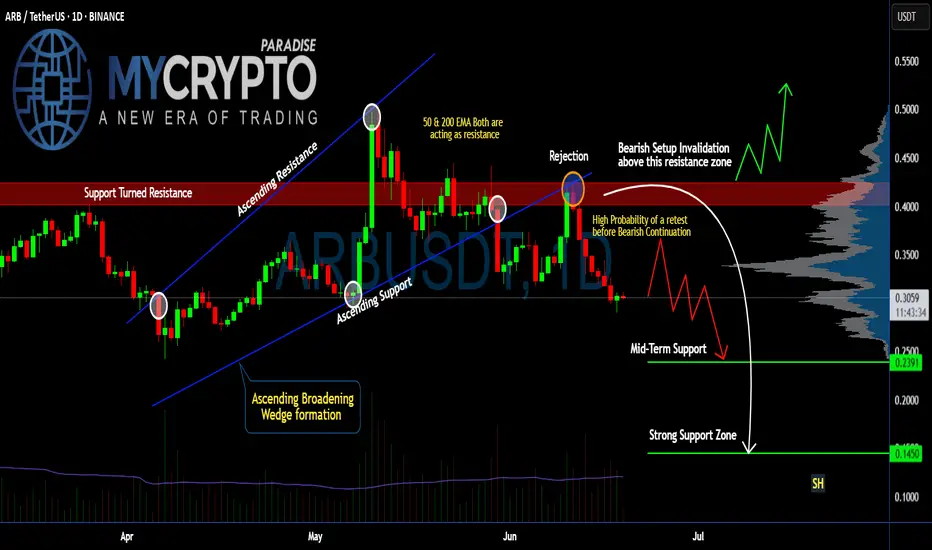
Is #ARB Ready For a Recovery or will it continue to Fall? Yello Paradisers! Are you watching #ARBUSDT closely or not? Let's look at the latest #Arbitrum trading setup and what could be next for it:
💎#ARB just completed a breakdown from an Ascending Broadening Wedge. This breakdown has made the previous support into the resistance after the price rejection. Currently, there is a high probability that #ARBUSD might do a retest before continuing downward.
💎After the wedge breakdown, price got rejected hard from the $0.39–$0.42 resistance zone, where both the 50 EMA and 200 EMA are now stacked against the bulls, acting as strong dynamic resistances. This confluence of resistance increases the probability that this level won't be reclaimed easily. The setup is clearly bearish unless invalidated above $0.42.
💎We’re seeing a lack of follow-through on the bounces, which signals hesitation and likely a trap for late buyers. As long as we remain below the resistance block, the next logical move is a retest of mid-term support at $0.2391.
💎But it doesn't stop there. If this mid-level gives in — and the structure suggests it might — the next area to watch is the $0.1450 zone, a strong historical support and the first place we expect real buyers to step in. This could be the level where a high-probability reversal finally sets up.
Trade smart, Paradisers. This setup will reward only the disciplined.
MyCryptoParadise
iFeel the success🌴
HolderStat┆BTCUSD forms a triangleBYBIT:BTCUSDT trades inside a narrowing flag between 104 k and 108 k. A push past 108 k activates the pole projection toward 112–114 k and possibly the ATH rail; rejection sends price to retest 102 k support before the next offensive.

HolderStat┆ETHUSD accumulationBYBIT:ETHUSDT is compressing in an ascending triangle, pivoting around 2 500. A decisive break above 2 520 tees up 2 800–2 900 continuation, while closing back under 2 430 would negate the immediate setup but leave macro structure bullish.

HolderStat┆XRPUSD correction from the trend lineOKX:XRPUSDT found footing at 2.09 and now grinds beneath descending resistance. Regaining 2.18 should unlock a glide toward 2.25-2.35 inside the larger bull channel, whereas failure to defend 2.05 risks a trip to 1.95 reload territory.

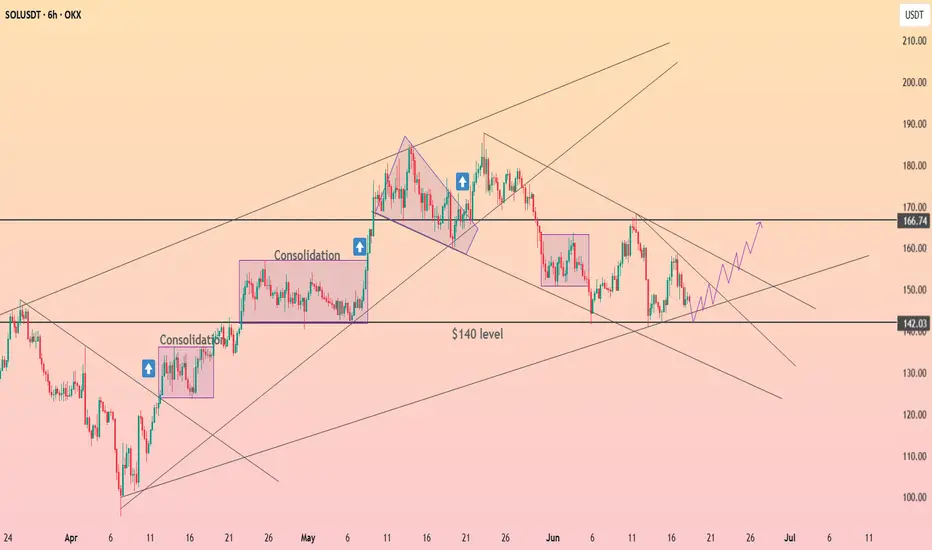
HolderStat┆SOLUSD accumulation before growthOKX:SOLUSDT respects the $140 axis and tests the roof of its falling channel. Holding that shelf lets bulls aim for 160-170 and keeps the broader up-channel alive; a dip under 135 would postpone the rally but not derail the long-term trend ⚡️
HolderStat┆BNBUSD held supportKUCOIN:BNBUSDT keeps coiling inside a contracting wedge above the $639 launchpad. A 4-h close over 650-655 can spark a thrust to 680 and revive the 700–710 “new-high” box; slip-back under 630 delays the breakout but leaves the structure intact 🚀

HolderStat┆ADAUSD retesting of the $0.6 levelBINANCE:ADAUSDT is orbiting the major $0.6000 shelf inside a fading down-channel. A lift through 0.63-0.64 would flip short-term momentum and open a swift path toward the mid-$0.70s, while a daily close below $0.58 cancels the run-up thesis 📈

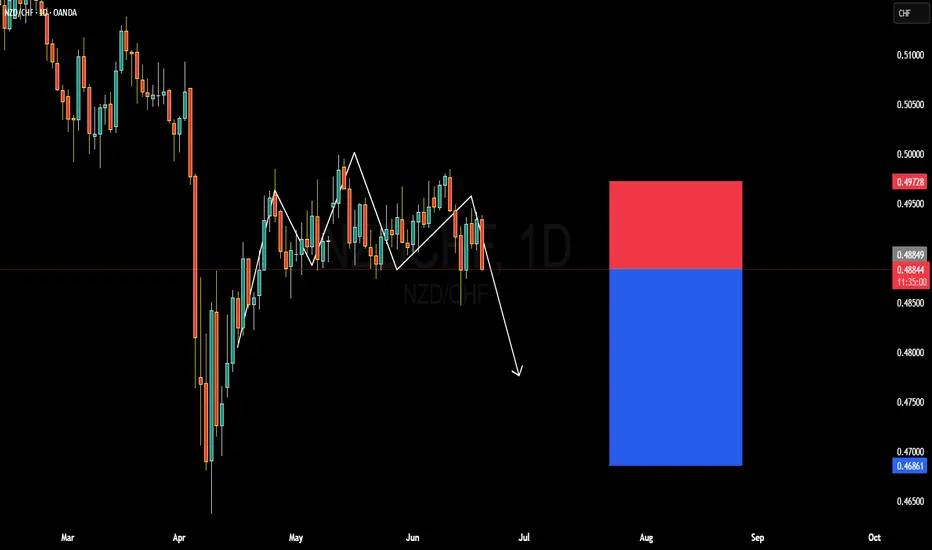
NZDCHF BULLISH OR BEARISH DETAILED ANALYSISNZDCHF is currently trading around the 0.4880–0.4900 zone, and on the daily timeframe, the pair appears to be completing an inverse head and shoulders pattern. However, unlike the typical bullish nature of this pattern, price has failed to break above the neckline and is showing early signs of bearish continuation. The right shoulder has already failed to create a higher high, and recent bearish candlesticks with strong wicks to the upside suggest rejection and downside momentum building. My short bias is supported by this structural weakness and loss of bullish steam.
From a fundamental perspective, the Swiss Franc remains strong due to its safe-haven demand amid lingering global risk aversion and slowing global growth expectations. The Reserve Bank of New Zealand, while on hold recently, has adopted a relatively dovish tone as domestic inflation trends soften. This diverging policy stance between the SNB and RBNZ provides a macroeconomic tailwind favoring CHF strength and NZD weakness. In today’s session, CHF also gained modestly following stronger-than-expected CPI revisions and cautious risk flows in the Asian and European sessions.
Technically, we’ve seen a clean break of the recent support zone near 0.4890, and the market structure has flipped bearish on both the daily and H4 charts. I expect further downside continuation toward the 0.4680–0.4700 range, especially if the current lower highs pattern persists. The bearish flag breakdown and consistent lower closes support continuation toward my 0.46 target. This offers a solid short setup with a favorable risk-reward ratio in play.
I’ll continue monitoring for any pullback toward the 0.4920–0.4950 area for potential re-entries on weakness. Momentum and volume indicators also point lower, aligning with the price action thesis. As long as we stay below 0.4970, the bearish scenario remains active, and I’m looking to capitalize on this developing bearish cycle in NZDCHF.
Volume spikes on down moves add to selling pressure.📉 BTCUSDT – 1H Chart Technical Outlook
🔍 Structure Insight:
Bitcoin is currently trading within a descending channel, forming lower highs and lower lows, indicating persistent bearish pressure. Price action appears compressed between key trendlines, hinting at an imminent breakout.
---
🔻 Scenario 1: Bearish Breakdown (Primary Bias)
If BTC fails to hold above the lower boundary of the range, a decisive break below could trigger a sharp move toward the 103,650–103,000 demand zone. The structure supports continuation to the downside if the price rejects resistance again.
🧊 Bearish Confluence:
Price is unable to break above dynamic resistance.
Momentum remains weak near the mid-range.
Volume spikes on down moves add to selling pressure.
---
🔼 Scenario 2: Bullish Breakout (Alternative View)
A breakout above the descending trendline and confirmation candle could flip bias short-term bullish. This would target the 105,400+ region as the next liquidity area.
⚡ Bullish Signs to Watch:
Break and retest above trendline resistance.
Bullish engulfing or breakout candle with volume.
---
🔍 Key Levels to Monitor
Support: 103,650 / 103,000
Resistance: 105,000 / 105,400
Breakout Zones: Watch for clean breaks and retests outside the wedge pattern.
---
📌 Conclusion:
BTC is coiling within a tightening range. The breakout direction will likely dictate the next short-term trend. Maintain flexibility — breakout confirmation is key before positioning.
🚨 Not financial advice — always DYOR before trading!

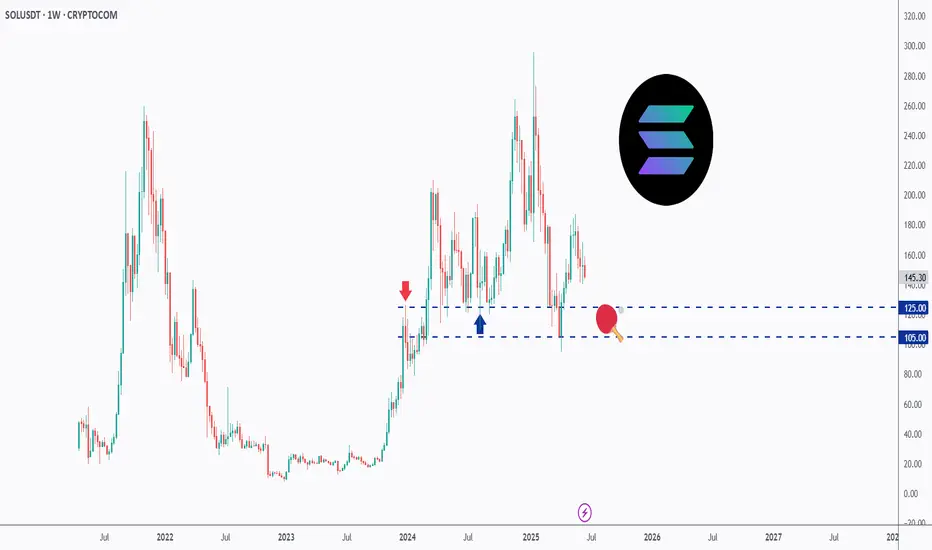
Short on SOL Here is a short idea on SOLUSDT perpetual contract on Binance.
I also include my overall analysis. I hope you find this useful.
Thank you!
- R2F Trading

SEI Rebound or Final Trap?Yello Paradisers, have you considered that this little bounce might be the last trap before a brutal selloff? SEIUSDT is giving us strong signals that most retail traders are missing and if you’re not reading the structure clearly, you’re walking straight into a setup designed to clean you out.
💎The recent price action shows a clear rejection from the $0.22 level, which has now confirmed itself as a strong resistance zone. What’s more concerning is that this resistance rejection comes right after the price broke down from an Ascending Broadening Wedge. This is not a random pattern it’s a classic formation that tends to attract breakout buyers and then punishes them with aggressive downside moves once the structure fails.
💎Currently, the market is drifting just below that resistance, attempting weak bounces. However, there is a clear lack of bullish momentum. If this weakness persists, the next stop is around the $0.16 region, where moderate support is likely to be tested.
💎If sellers get aggressive, that level might not hold, and we could head lower into the $0.13 area still not where true value lies. The major support zone sits far below, around the psychological $0.10 level, and that’s where the real high-probability bounce setup is likely to occur.
MyCryptoParadise
iFeel the success🌴

SOL - Playing Ping Pong!Hello TradingView Family / Fellow Traders. This is Richard, also known as theSignalyst.
📈SOL has been trading within a range between $100 and $200 round number.
And it is currently retesting the lower bound of the range which has been acting as a magnet lately.
As SOL approaches the $105 - $125 support zone, and as long as the $105 support holds, we will be looking for longs targeting the $200 round number.
📚 Always follow your trading plan regarding entry, risk management, and trade management.
Good luck!
All Strategies Are Good; If Managed Properly!
~Rich
BTCUSD: Nowhere near a top yet.Bitcoin remains neutral on its 1D technical outlook (RSI = 47.257, MACD = 443.000, ADX = 29.912) due to high volatility recently but the bullish long term trend is intact and even more so, hasn't yet started the year-end rally. The Mayer Multiple Bands have always priced a Cycle's Top on their red trendline so no matter how high that may seem from the current market price, the TP zone should be between the orange (2 Stdev above) and red (3 Stdev above) trendines. Minimum TP = 200,000 for this Cycle.
## If you like our free content follow our profile to get more daily ideas. ##
## Comments and likes are greatly appreciated. ##

SUI Long Swing Setup – Confluence of Support and Fibonacci LevelSUI has pulled back into a key confluence zone, aligning with both the 61.8% Fibonacci retracement and horizontal support. We’re now eyeing the $2.70–$2.80 area for a potential long entry.
📌 Trade Setup:
• Entry Zone: $2.70 – $2.80
• Take Profit Targets:
o 🥇 $3.40 – $3.60
o 🥈 $4.00 – $4.20
• Stop Loss: Daily close below $2.65

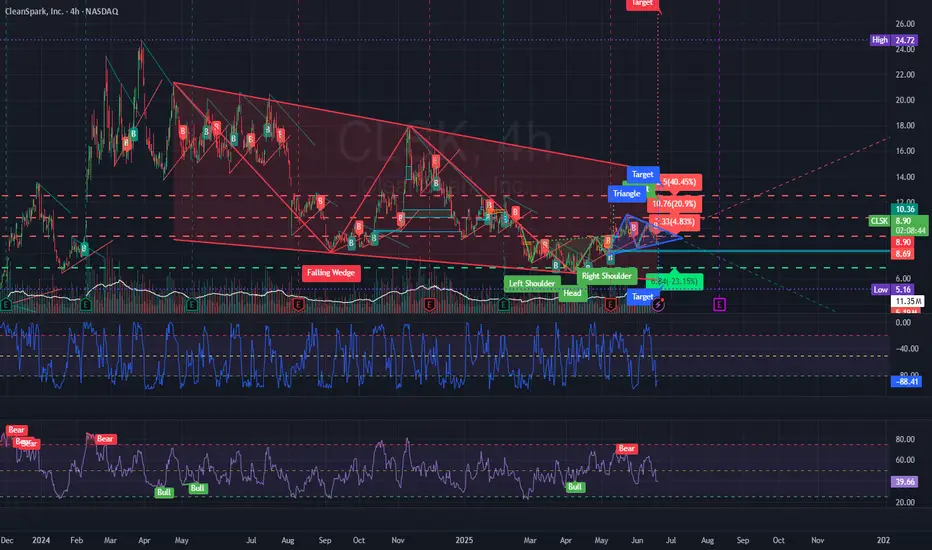
CLSK Going to $27There is always a downside, but I believe Risk vs Reward is here. It's not if, it's when. If we breakout to the downside of the triangle then we will test the support and the bottom of the wedge. If we break to the top of the triangle then we go for the breakout of the wedge and on the way to $27. I am adding at these levels and of course if it goes down, I am adding more.
TAO 4H - Downtrend bottom? Altcoins have certainly taken a backseat to BTC this cycle with Bitcoin dominance holding around 65%. Despite this, there are still some good setups in altcoins presenting themselves each day, one of which is TAO on the 4H.
To me it looks to be in a clear downtrend respecting the upper and lower limits while reacting off of support levels on the way down. As it stands price has reached a key S/R level that has proven to be support in the past and is in conjunction with the lower end of the trend channel.
With FOMC only hours away and TAO being at such a critical level this would be an interesting place to do business. A good reaction off the level would kickstart a move towards the trends upper limits. A loss of this level and it's very possible what has been support can turn into resistance.
To me the R:R here is good for a long position, the threat to the trade is bearish reaction to FOMC, escalation geo-politically which effects risk-on assets and therefor overalls TA.

BTC on the Daily: Bearish Structure Locked In?So, on the daily, price is in a clear bearish context.
PSAR is bearish
MLR < SMA < BB center
We're about to close below the 50MA
Price already broke below the Higher Lows trendline and the December 2024 top
At this point, it all depends on the macro situation and the FOMC tone tonight.
If the outcome is positive, there's a chance price rebounds.
If not, the chart looks ready to dive.

EUR/USD.1h chart pattern.Based on My target EUR/USD 1H, the price has broken down from the ascending channel and formed a Double Top, confirming a bearish structure. Here's the analysis based on the marked zones:
Bearish Targets:
1. First Support / Target 1: Around 1.13500
This aligns with a previous structure level and is the first potential bounce zone.
2. Second Support / Target 2: Around 1.12000
This is a deeper support zone where price may head if the bearish momentum continues.
The structure also shows a clear CHoCH (Change of Character) which supports the downside bias.
Let me know if you want entry and stop-loss suggestions for this setup.
