BTC/USD.4H CHART PATTERN.Based on MY BTC/USDT 4H chart the following analysis and price targets apply:
---
📉 Chart Pattern:
A symmetrical triangle pattern is visible, with price nearing a potential breakdown.
You’ve marked a breakdown scenario, supported by the Ichimoku cloud turning bearish and resistance rejection.
The market has respected both support and resistance trendlines multiple times, increasing pattern validity.
---
🎯 Bearish Targets After Breakdown:
1st Support Target:
Level: Around $98,000
This is the first zone where buyers might step in. It aligns with previous consolidation and structural support.
2nd Support Target:
Level: Around $94,000
This is a deeper support level and likely final target if selling pressure continues.
---
🔍 Summary:
Sell below: ~$104,000 (on breakdown confirmation)
Target 1: ~$98,000
Target 2: ~$94,000
Stop-loss suggestion: Above upper triangle trendline (~$106,500 or above recent high)
Let me know if you want a trading strategy with risk/reward ratio or SL/TP management tips.
Crypto

GBP/USD 3H CHART PATTERN.GBP/USD on the 3-hour timeframe, here’s the analysis and potential target zones derived from the chart:
📉 Current Trend:
The market has broken down from an ascending channel.
Price retested the support-turned-resistance zone around 1.35060, confirming bearish momentum.
Ichimoku Cloud is above price — supporting bearish bias.
---
🎯 Targets Based on the Chart:
1. First Target (1st Support Zone):
Level: Approximately 1.33449
This is your first major support zone marked on the chart — expect a possible reaction or consolidation here.
2. Second Target (2nd Support Zone):
Level: Approximately 1.32800
This is the second support zone — if price breaks below 1.33449, this becomes the next logical bearish target.
---
🔍 Summary:
Sell below: 1.3450
Target 1: 1.3345
Target 2: 1.3280
Stop-loss suggestion: Above the resistance zone ~1.3506
Let me know if you want SL/TP values based on pips, risk %, or a strategy adjustment.

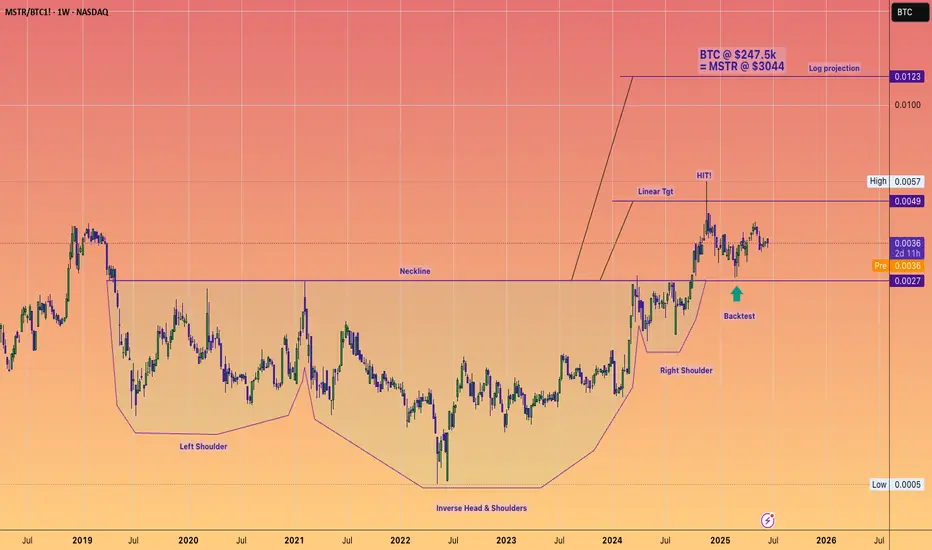
Could Microstrategy be a 1 Trillion dollar mcap company?!Microstrategy and Michael Saylor evoke a spectrum of opinions, with analysts offering a diverse range of potential future valuations.
High risk, high reward!
The destiny of Microstrategy’s market capitalization is clearly linked to Bitcoin’s performance. The company has been utilizing debt to acquire the cryptocurrency, aiming to create significant spreads. This leverage is the reason why the stock has significantly outperformed Bitcoin throughout 2024.
I am confident that Bitcoin can indeed reach $200k, with a potential upper price target of $250K for this cycle, indicating a potentially explosive Q3 and Q4.
The lingering question is how much additional FOMO and premium Saylor can cultivate for his leveraged vehicle in such an environment?
That's why charting is such a key component to any personal investing strategy IMHO, as we navigate these markets.
USOIL FUNDAMENTALS AND TECHNICALS USOIL (WTI Crude) is currently trading near the 72.00 level and is setting up for a potential breakout from a long-standing descending channel on the higher time frame (3D chart). Price has approached the upper boundary of this bearish channel after a strong bullish rally in recent sessions. This indicates growing bullish momentum, and any sustained breakout above the descending trendline could open the path toward the 98.00 zone, a major structural target based on previous price action and Fibonacci projections.
The recent bullish surge in crude oil prices has been fueled by a combination of supply-side constraints and renewed optimism around global demand. OPEC+ continues to show discipline in supply management, and geopolitical tensions in oil-producing regions are adding risk premiums. Furthermore, the Fed’s recent signals of a potential pause in tightening, combined with an improving outlook for Chinese demand recovery, are creating a supportive environment for commodities, particularly oil. These fundamental tailwinds align with the technical structure hinting at an upside breakout.
Technically, USOIL has broken back above a critical mid-channel support level and is now challenging the descending resistance line. The most recent impulsive candles suggest strong buyer conviction. If this momentum holds, we could see a retest followed by continuation toward the 98.00 psychological level. The structure also supports a higher low formation, which is another bullish signal for long-term traders watching the macro channel breakout.
From a trading standpoint, this setup is high probability with a well-defined invalidation zone below 65.00. The confluence of macro catalysts, technical breakout formation, and seasonal demand trends makes this a compelling bullish opportunity. I am closely monitoring price action for confirmation to go long on the breakout and ride the potential wave toward the upper supply region near 98.00.
U

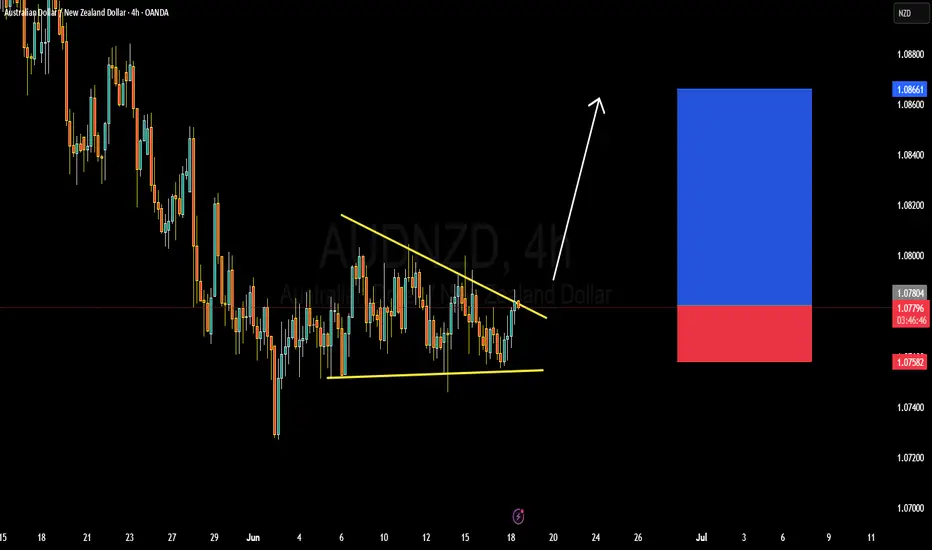
AUDNZD BULISH OR BEARISH DETAILED ANALYSISAUDNZD is currently trading around 1.078 and is on the verge of a classic falling wedge breakout, which is a bullish reversal pattern typically seen after a downtrend. Price action has been compressing within this wedge formation, suggesting an imminent breakout as market pressure builds. A decisive close above the descending trendline would be a powerful signal of bullish continuation, with a near-term upside target of 1.086. The structure has held multiple rejections at both resistance and support, highlighting strong accumulation behavior from institutional participants.
Fundamentally, the Australian dollar is gaining relative strength due to the Reserve Bank of Australia maintaining a hawkish tone, supported by persistent inflation and labor market resilience. In contrast, the Reserve Bank of New Zealand recently surprised the market by signaling a potential end to its hiking cycle, citing slower growth and inflation moderation. This divergence in monetary policy outlook is creating favorable conditions for AUDNZD bulls, particularly as global risk appetite improves and commodity-linked currencies gain traction.
Technically, this 4-hour chart pattern aligns perfectly with recent AUD strength across the board, particularly in pairs like AUDUSD and AUDJPY which have broken key resistance levels. The tight consolidation near the wedge’s upper boundary, coupled with bullish candlestick formations, suggests buyers are stepping in ahead of the breakout. With a clean invalidation below 1.075, the risk-reward ratio here is compelling, especially for momentum traders looking to catch an impulsive leg higher toward 1.086 and beyond.
This setup is high-conviction. AUDNZD is poised for a breakout that aligns with both technical and macro fundamentals. As a professional trader, I’m tracking this setup closely, and any confirmation candle above the trendline will trigger my entry. I expect bullish continuation in line with AUD’s broader strength and NZD’s underperformance.
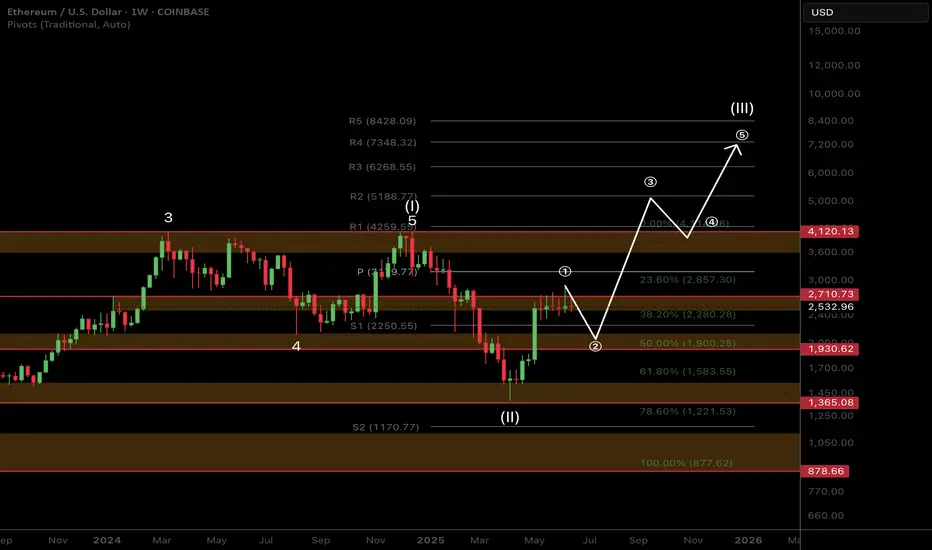
ETH Macro Analysis☕ 𝙂𝙈. CRYPTOCAP:ETH Macro analysis update...
📈 𝙇𝙤𝙣𝙜 𝙩𝙚𝙧𝙢 outlook remains unchanged and recent price action printing a doji. Target is still $7k for this cycle.
📉 𝙎𝙝𝙤𝙧𝙩 𝙩𝙚𝙧𝙢 outlook has investors looking lower towards the $1900 target but this isn't guaranteed to be reached and price action may front tat $2200.
War escalation's and retail selling are keeping price suppressed. ETF inflows and staking continue to grow!
The time for patience continues. Money is made in the sitting, weathering volatility, not flipping in and out of trades on every bit of news and price movement
𝙏𝙚𝙘𝙝𝙣𝙞𝙘𝙖𝙡 𝘼𝙣𝙖𝙡𝙮𝙨𝙞𝙨
Price is consolidating at its recent highs. Consolidation under resistance has high probability of breaking out, the longer it remains the higher the probability.
Elliot Wave (EW) analysis suggests a motif wave ended at the $2700 resistance, with a wave 2 retracement underway, likely a shallow one.
Safe trading
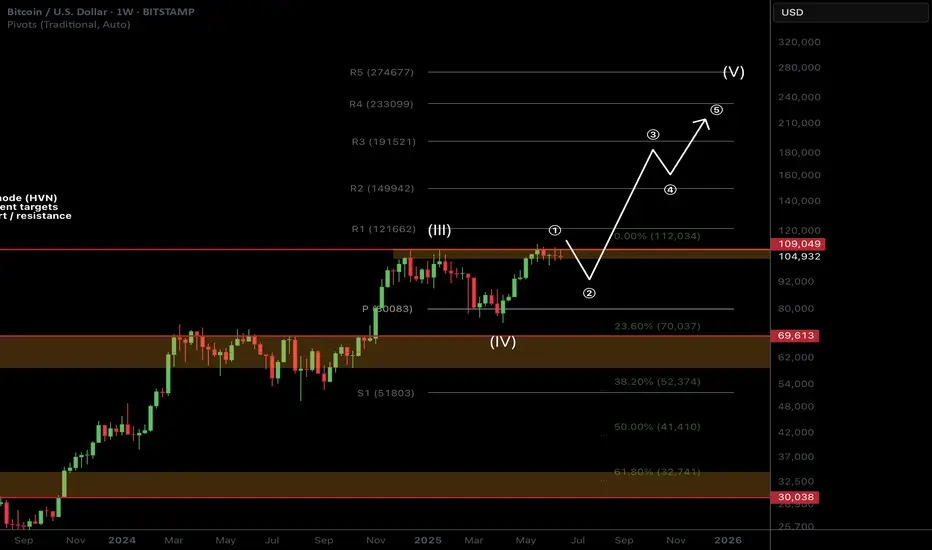
BTC Macro Analysis☕ 𝙂𝙈. CRYPTOCAP:BTC macro analysis update...
📈 𝙇𝙤𝙣𝙜 𝙩𝙚𝙧𝙢 outlook remains unchanged and recent price action is barely a blip on the weekly chart. SD+2 target is still $211k as a blow off top.
📉 𝙎𝙝𝙤𝙧𝙩 𝙩𝙚𝙧𝙢 outlook has investors looking lower towards the $92K target but this isn't guaranteed to be reached and price action may front those who wait.
War escalation's and retail selling are keeping price suppressed as price changes hands to private companies and large wallets.
The time for patience continues. Money is made in the sitting, weathering volatility, not flipping in and out of trades on every bit of news and price movement
𝙏𝙚𝙘𝙝𝙣𝙞𝙘𝙖𝙡 𝘼𝙣𝙖𝙡𝙮𝙨𝙞𝙨
Price is consolidating under all time high resistance. Consolidation under resistance has high probability of breaking out, the longer it remains the higher the probability.
Elliot Wave (EW) analysis suggests a motif wave ended with the poke above all time high (per the EW rules), with a wave 2 retracement underway. Price remains above the daily pivot (bullish) but below the DEMA (bearish). A triangle could still be forming but this is not my preferred EW count.
Safe trading
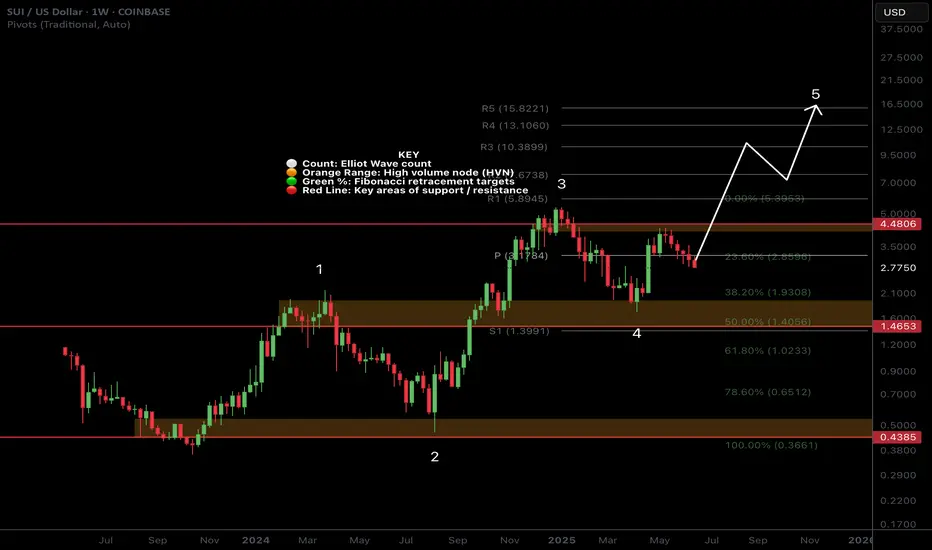
SUI Macro AnalysisCRYPTOCAP:SUI macro analysis update...
📈 𝙇𝙤𝙣𝙜 𝙩𝙚𝙧𝙢 outlook shows price action still outperforming most alts with a great rally recently. Target remains the R5 weekly pivot at $15
📉 𝙎𝙝𝙤𝙧𝙩 𝙩𝙚𝙧𝙢 outlook has price pulling back, looking to find a bottom between $2.3-2.65
War escalation's and retail selling are keeping price suppressed as price changes hands to private companies and large wallets.
The time for patience continues. Money is made in the sitting, weathering volatility, not flipping in and out of trades on every bit of news and price movement
𝙏𝙚𝙘𝙝𝙣𝙞𝙘𝙖𝙡 𝘼𝙣𝙖𝙡𝙮𝙨𝙞𝙨
Price is testing the weekly pivot and daily S1 pivot as support
Elliot Wave (EW) analysis was a strong, textbook motif wave with a wave 2 retracement underway. Wave 2 often extends to the 61.8 Fibonacci retracement of $2.4 but the alt-coin golden pocket is the 78.6 at $2.03. No surprises if we see that area revisited and could be a great buying opportunity.
Price has lost the daily 200EMA and DEMA which is bearish short term.
Safe trading
weekly BULL-FLAG!it looks like after the rally bitcoin had since early April, now this is a bull-flag pattern on weekly and that can push bitcoin to $140k.

XRP: You Have What it Takes, Success is Yours!It seems XRP has been trading at the same price for more than 7 months. The mean price since XRP broke above $2 back in December 2024.
Can you see what I am referring to? Good if you do.
If you don't, continue reading, everything will be clear in a few seconds.
Price action
Is neutral price action at this point bearish or bullish?
Bullish.
Most of the action has been happening above $2 and this is clearly bullish.
The upswings are bigger than the down-swings.
Buy volume is higher than sell volume.
The main move is an advance that started in November 2024.
The bigger picture and major trend is bullish.
The fundamentals are getting better everyday; there is nothing bearish on this chart.
Where to next?
New all-time high and higher prices.
How to approach the market
Start with 3-5X. When the bullish action is fully confirmed, the market starts to move higher supported by high volume and marketwide wide action, go all-in. That's the only way to win.
Make the winners pay big. Keep the losers small.
If you don't take risk you can't win in this or any other game.
Thanks a lot for your continued support.
Trading tips
Only risk money you can afford to lose and make sure to do a calculated risk. Not crazy risk nor gamblers risk. 2-3X. As the market advances, 3-5X. When the trend is confirmed, go higher and continue to increase until you max everything out. When our target hits sell everything and never look back. You can buy again when there is a crash or a retrace. Opportunities are endless.
If you secure profits and the pair continues to grow; who cares! Buy one that is safe and secure. Buy a new one that is trading low. Don't go back to the same pair just because you won. Detach. Take some time out. Secure profits. Comeback refreshed and the market will bless you with endless opportunities, it is not going away.
Motivation
Just make sure to win-win-win.
If you can win small, you will eventually win big.
Win, win, win. Make a habit of winning.
Go step by step.
Many people overestimate what they can do in a year but underestimate what they can achieve in a decade. Think long-term.
Instead of tomorrow, next week or next month, think how much money you are going to make in a decade if you start preparing now. What if everything you are doing does not need to yield an instant result? Now you can relax your mind. It will all come to you, but let it come, there is no rush.
Even if you hurry, life will continue to give you what you need, what you earned and not what you think is best. Whatever situation you are in right now is the result of past action. Take responsibility and watch everything grow.
Your future can change if you make the right choices today. You can change everything, start now; what can I do today to make my day better? What is the best action to take? Should I go out and get drunk, sniff a bunch of drugs, or, should I exercise and eat clean, do what it takes to reach my goals?
Choose wisely and watch your profits grow.
Whatever results you get when trading is just a reflection of your mind and the choices you make in your day to day live. Belief and take control.
You have what it takes.
Success is yours.
Namaste.

Dogecoin: Small Move, Big Move, What Will You Do?All gains have been removed, most of them. Dogecoin hit yesterday the same level from 6-May. This level was the base that propelled prices to 0.26000. From this high point 11-May, we witnessed a correction lasting more than a month. Total drop amounts to 36.9% (-37%).
Size and duration
» From 6 to 11-May we have 5 days.
» From 7-April to 11-May we have 34 days (bullish).
» From 11-May to 17-June we have 37 days (bearish).
I am making the case that the correction is over. Follow me a little longer and you will be convinced. If you are not convinced by my analysis, you will be convinced when prices start to increase.
Drop vs rise
» The 7-April low was 0.12986.
» The 6-May and 17-June lows was around 0.16400.
While the drop is bigger than the rise, in time duration, the action did not produce new lows (a lower low). Instead, prices remain strong as a higher low.
The low 17-June (yesterday) is 26% higher compared to the low that was hit 7-April.
Now I will make my case stronger.
Past action
Dogecoin peaked 8-December 2024. After this peak, bearish action is really strong and every few weeks we see a new low. Total drop from top to bottom amounts to more than 73%. But here is the thing, the final low in 7-April is still higher compared to the low in early August 2024.
» What you are seeing now is a "small move," (1).
» What comes next is a "big move," (2).
Now you know what is coming to Dogecoin—the altcoins market—what will you do?
Namaste.

Theta Fuel Whale Mistake Bullish Signal RevealedLook at this... The charts reveal everything always before the event takes place.
This happened yesterday on KuCoin, TFUELUSDT grew 185% but all the gains were removed.
The peak happened at 0.09500. This means one thing and one thing only, there is no longer any resistance all the way up to that price. All the sell orders that were placed have been filled. This means that once the market turns bullish, this pair will move straight up. That's the proof, right there, yesterday's candle.
This signal can be read in many different ways but they are all bullish, so, what will you do?
Theta Fuel is going up. You read about it here first.
Thanks a lot for your continued support.
I am keeping it simple; simple is best.
Namaste.

Ethereum H1 | Potential bearish reversalEthereum (ETH/USD) is rising towards a pullback resistance and could potentially reverse off this level to drop lower.
Sell entry is at 2,543.15 which is a pullback resistance that aligns with the 38.2% Fibonacci retracement.
Stop loss is at 2,625.00 which is a level that sits above the 61.8% Fibonacci retracement and a swing-high resistance.
Take profit is at 2,451.35 which is a multi-swing-low support.
High Risk Investment Warning
Trading Forex/CFDs on margin carries a high level of risk and may not be suitable for all investors. Leverage can work against you.
Stratos Markets Limited (tradu.com ):
CFDs are complex instruments and come with a high risk of losing money rapidly due to leverage. 63% of retail investor accounts lose money when trading CFDs with this provider. You should consider whether you understand how CFDs work and whether you can afford to take the high risk of losing your money.
Stratos Europe Ltd (tradu.com ):
CFDs are complex instruments and come with a high risk of losing money rapidly due to leverage. 63% of retail investor accounts lose money when trading CFDs with this provider. You should consider whether you understand how CFDs work and whether you can afford to take the high risk of losing your money.
Stratos Global LLC (tradu.com ):
Losses can exceed deposits.
Please be advised that the information presented on TradingView is provided to Tradu (‘Company’, ‘we’) by a third-party provider (‘TFA Global Pte Ltd’). Please be reminded that you are solely responsible for the trading decisions on your account. There is a very high degree of risk involved in trading. Any information and/or content is intended entirely for research, educational and informational purposes only and does not constitute investment or consultation advice or investment strategy. The information is not tailored to the investment needs of any specific person and therefore does not involve a consideration of any of the investment objectives, financial situation or needs of any viewer that may receive it. Kindly also note that past performance is not a reliable indicator of future results. Actual results may differ materially from those anticipated in forward-looking or past performance statements. We assume no liability as to the accuracy or completeness of any of the information and/or content provided herein and the Company cannot be held responsible for any omission, mistake nor for any loss or damage including without limitation to any loss of profit which may arise from reliance on any information supplied by TFA Global Pte Ltd.
The speaker(s) is neither an employee, agent nor representative of Tradu and is therefore acting independently. The opinions given are their own, constitute general market commentary, and do not constitute the opinion or advice of Tradu or any form of personal or investment advice. Tradu neither endorses nor guarantees offerings of third-party speakers, nor is Tradu responsible for the content, veracity or opinions of third-party speakers, presenters or participants.

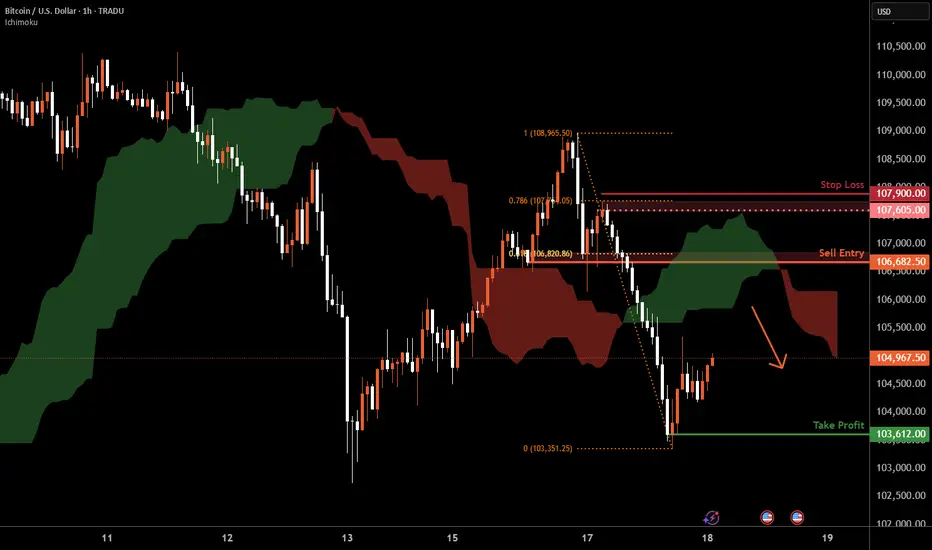
Bitcoin H1 | Pullback resistance at 61.8% Fibonacci retracementBitcoin (BTC/USD) is rising towards a pullback resistance and could potentially reverse off this level to drop lower.
Sell entry is at 106,682.50 which is a pullback resistance that aligns with the 61.8% Fibonacci retracement.
Stop loss is at 107,900.00 which is a level that sits above the 78.6% Fibonacci retracement and a swing-high resistance.
Take profit is at 103,612.00 which is a swing-low support.
High Risk Investment Warning
Trading Forex/CFDs on margin carries a high level of risk and may not be suitable for all investors. Leverage can work against you.
Stratos Markets Limited (tradu.com ):
CFDs are complex instruments and come with a high risk of losing money rapidly due to leverage. 63% of retail investor accounts lose money when trading CFDs with this provider. You should consider whether you understand how CFDs work and whether you can afford to take the high risk of losing your money.
Stratos Europe Ltd (tradu.com ):
CFDs are complex instruments and come with a high risk of losing money rapidly due to leverage. 63% of retail investor accounts lose money when trading CFDs with this provider. You should consider whether you understand how CFDs work and whether you can afford to take the high risk of losing your money.
Stratos Global LLC (tradu.com ):
Losses can exceed deposits.
Please be advised that the information presented on TradingView is provided to Tradu (‘Company’, ‘we’) by a third-party provider (‘TFA Global Pte Ltd’). Please be reminded that you are solely responsible for the trading decisions on your account. There is a very high degree of risk involved in trading. Any information and/or content is intended entirely for research, educational and informational purposes only and does not constitute investment or consultation advice or investment strategy. The information is not tailored to the investment needs of any specific person and therefore does not involve a consideration of any of the investment objectives, financial situation or needs of any viewer that may receive it. Kindly also note that past performance is not a reliable indicator of future results. Actual results may differ materially from those anticipated in forward-looking or past performance statements. We assume no liability as to the accuracy or completeness of any of the information and/or content provided herein and the Company cannot be held responsible for any omission, mistake nor for any loss or damage including without limitation to any loss of profit which may arise from reliance on any information supplied by TFA Global Pte Ltd.
The speaker(s) is neither an employee, agent nor representative of Tradu and is therefore acting independently. The opinions given are their own, constitute general market commentary, and do not constitute the opinion or advice of Tradu or any form of personal or investment advice. Tradu neither endorses nor guarantees offerings of third-party speakers, nor is Tradu responsible for the content, veracity or opinions of third-party speakers, presenters or participants.
Tranchess Bull Flag... Do You Agree?This one here is also a bull flag, a wide one and you know where prices are headed next.
Let me ask you a question and be honest; do you have any doubts about what I am saying? You can answer in your own mind of course but just think about it.
I say the market is bullish but consolidating.
I say the market produced a retrace, in some cases a correction, which will only lead to higher prices.
I say this based on the information that is available through the charts and I share all the charts with the evidence.
Do you agree?
I am an optimist.
To me, I have 100% level of certainty but what about you?
I was right about the rise from April but that seems already to be far away. Do you believe me? Do you trust me? Do you know what will happen next? It is written all over the charts.
If you do, then you have to take action.
Money is on the table, and this is a money game.
If you agree and you can see what I see, how will you proceed to maximize profits?
What actions can you take now to maximize your earning potential and increase your trading success?
If you know the market is going up, then, you have to take action that goes in accordance with what you know.
First you read.
Through reading we learn.
We use the gained knowledge to achieve our goals.
Thanks a lot for your continued support.
Oh, and by the way, Crypto is going up.
Namaste.

BTC USD 180K BIG HOW?Trends and price targets is how, but realistically, it looks like 134k in the short term.
Drop is wicked if it were to occur, takes price to literally 12k, which you want to go all in if that occurs.
55k is another drop zone.
Otherwise, it looks fairly bullish.
buy zone marked in green,
sell in red.
watch the trends
and price targets are pretty accurate usually.
good luck!!
Custom charts by request.

BTC 4H Analysis📈 BTC 4H Analysis – Symmetrical Triangle Breakout Loading
Bitcoin is currently consolidating inside a Symmetrical Triangle, forming higher lows and lower highs – a classic sign of volatility compression.
🔹 Structure: Symmetrical Triangle
🔹 Support Holding Strong – bulls defending the zone
🔹 Breakout Expected Soon
🔹 Major Resistance: $110,200
🔹 Breakout Target: $112,000+
Price is coiling up. Break above the triangle = strong bullish continuation likely.
🚀 Eyes on breakout — next move could be explosive!
NFA | DYOR

Stratis Reveals A Bullish Bias Across The AltcoinsThe market is set to resume growing, the proof is in the charts. Stratis (STRAXUSDT) was one of the first projects to move strongly after its 7-April low. Here you can see a 150% jump within 10 days.
This type of move always reveals two things. The start of the next bullish cycle and the fact that the bottom is in. Both are one and the same.
Once the bottom hits, only growth is possible or else the bottom is not in. Once a new bullish cycle starts, then there can't be any new lows so the last low present on the chart must be the bottom.
After the initial bullish breakout we get the classic correction, now two months strong. The correction found support at the same level support was found in November 2024.
Here is the interesting part. Stratis was one of the first projects to move strong, seeing it getting ready to produce a new bullish wave, reveals that the market is done with its correction and will resolve to produce rising prices. What one does, the rest follows. Some projects move first though.
This is the signal. It is still very early of course, but that is the advantage we can enjoy by looking daily at the charts.
I will do a short-term trade-signal for this pair.
Thank you for reading.
Your support is appreciated.
Namaste.

Ampleforth 200%+ Bullish Breakout Explained & 267% TargetIn April, FORTHUSDT produced a 200%+ bullish breakout in just three days. The market has been sideways since, consolidating and this consolidation means preparation before the next move which can be something similar. The market is clearly bullish because of the higher low.
The major burst upward in early April confirms the bottom is in. A confirmed bottom once more simply means that Ampleforth is bullish; bullish means that the next major move is not a breakdown (drop) but a bullish jump. This is all confirmed based on the action from the past two months.
Knowing this, we can take action with a simple strategy of buy and hold. We buy waiting for the next market move to develop. When the market turns green, we collect profits and move on. Repeat the same process over and over, and watch your capital grow.
It doesn't matter how long it takes, patience is key; what matters is to be prepared to wait for as long as it takes. If you can wait 2 weeks, 3 weeks or 6 months, you can end up with a win. Some pairs will move in a matter of days, others in a matter of months. If you can't predict which one will move next, you can use a diversification strategy.
Just be prepare to win some, lose some. Not all trades can be won. But if wait for the winners to become big and keeping the losers small, that's a recipe for success.
Plan ahead of time.
There are countless ways to approach the market. It all depends on your trading style, your trading goals, your capital and risk tolerance... The only way to lose is to give up.
Perseverance is key.
Comeback for more.
Namaste.

Bitcoin Short-Term 4H Timeframe, Still Bullish But...Bitcoin continues bullish on the 4H timeframe and we have some positive signals coming out of the most recent swing and shakeout.
» The action went below 0.618 but is back above this level.
» The higher low did not reach 0.786 Fib. retracement support, which is a signal of strength.
» Trading volume continues to rise and as the action happens above $100,000, this signal works in favor of the bulls.
Short-term, Bitcoin continues green with the bulls in full control of the chart. When in doubt, zoom out; Crypto is going up.
This is obviously a consolidation pattern because we have higher lows but also lower highs. The revealing signal of course comes from the altcoins, look at Bitcoin Cash and you can get a good example.
The market will resolve bullish once the consolidation ends.
I say this based on market data and the charts.
If you agree leave a comment.
Thank you for reading.
Namaste.

Bitcoin Mid-Term, 4H Timeframe, Bullish ($119,165 Next Target)On the 4H timeframe we have a consolidation pattern with a bullish bias. Bitcoin is aiming higher after a close above EMA8 & 13 with higher lows.
The drop 13-June found support perfectly at 0.786 Fib. retracement on a wick. The session closed above 0.618. The action turned bullish immediately and we are seeing slow but steady growth.
The recent drop was a market reaction due to a geopolitical situation. As soon as the event is priced in, the market seeks balance and goes back to its previous trend.
Bitcoin's bullish bias is not only supported by strong prices, $105,600 is very strong, but also by the altcoins and the cyclical nature of the market.
While Bitcoin already produced several new all-time highs this year the altcoins are yet to do the same. A bull market happens every four years or the year after the halving. For Bitcoin this is already true but this is a marketwide event and the altcoins are yet to go there and this is a bullish factor and soon this will be obvious on the chart.
We are 5-6 days away only from very strong bullish action. Notice that this isn't a long time, it is less than a week. The altcoins will reveal this bullish bias much sooner than Bitcoin but Bitcoin will also grow and hit a new all-time high soon. This new all-time high will be the catalyst for everything to boom.
» Ignore the short-term it is all noise—crypto is going up.
The next target is $107,558, followed by $109,508 on this timeframe. The latter being a mild resistance.
The main target here is $119,165 and this is a good resistance zone. It can be rounded up to $120,000. If this level gets hit it will only confirm additional growth. The target that follows is $130,000 and the minimum for this cycle is $160,000 but we are aiming higher.
Feel free to follow for more.
I will continue to detail Bitcoin on all the timeframes as well as many of the top, mid- and small altcoins.
Thank you for your support.
It is appreciated.
Namaste.

BTCUSD: 1D MA50 and 100k form a strong support base.Bitcoin has turned neutral again on its 1D technical outlook (RSI = 45.783, MACD = 629.200, ADX = 20.857) and is about to get bearish as it hit its 1D MA50 today, erasing the gains of the last 3 days. The 1D MA50 has held two times since June 5th and another one might be what Bitcoin needs to justify the next rally. Besides this however, we got a heavier Support on the P1 trendline, which on the previous ATH (Dec 17th 2024) was a Resistance and since May 12th 2025 it turned into Support. Technically, as long as 100,000 holds, we expect a strong rebound into August that may repear the inverse of December 2024 - March 2025 (-31%) and rise by +31% (TP = 132,000).
## If you like our free content follow our profile to get more daily ideas. ##
## Comments and likes are greatly appreciated. ##

Theta Is Ready for a Strong Recovery Soon!Looking at Theta, I see strong potential for a recovery very soon. We just completed a classic ABC correction, very similar to what Amazon experienced back in the day. I expect a big bullish move on this coin shortly. We are primed for a strong reversal here.
Theta is undervalued on both the higher and lower time frames, and with such strong project fundamentals, I see this as a major mover in the upcoming altcoin bull market. There’s potential for insane gains on the larger time frames and a strong recovery on the smaller ones.
Don’t focus on the news or media—crypto is ready for big things. As always, stay profitable.
— Dalin Anderson
