Is #ETC Ready For a Breakdown or Will it Recover From Here? Yello Paradisers! Have you checked what’s unfolding on #ETCUSDT lately? Let's look at the latest moves of #EthereumClassic:
💎#ETC has been trading inside a descending triangle for weeks, and once again, it failed to break above its strong descending resistance line, with the 50 & 200 EMAs acting as a dynamic ceiling on every rally attempt. These two indicators are stacking against the bulls, reinforcing the overhead pressure and keeping ETC pinned below key resistance levels.
💎The red zone between $18.60 and $19.20 has been acting as a strong resistance area and that’s exactly where the last bounce got rejected. The setup is clear: as long as price remains below this red supply zone, any short-term bullish case is invalidated. Each rejection here only fuels further downside conviction.
💎Unless we see a high-volume breakout and hold above $19.20, the structure remains extremely vulnerable. This is the invalidation level for the bearish thesis. If bulls can't flip that, the current pattern suggests continuation to the downside.
💎#ETCUSD is currently hovering around $16.50, with short-term bounces being aggressively absorbed. The mid-term support zone around $12.49 is likely the first magnet for price, but don’t get too comfortable there. The real target lies deeper: the strong support zone around $10.78 is shaping up to be the key smart money reaccumulation area if the selling intensifies. This is where real interest may return—but only after retail gets flushed.
Trade smart, Paradisers. This setup will reward only the disciplined.
MyCryptoParadise
iFeel the success🌴
Crypto

XRP - Trade The Range!Hello TradingView Family / Fellow Traders. This is Richard, also known as theSignalyst.
📈XRP has been trading within a range between $2 and $2.35 in the shape of a flat rising broadening wedge pattern in red.
🏹 The highlighted blue circle is a strong area to look for buy setups as it is the intersection of the green support and lower red trendline acting as a non-horizontal support.
📚 As per my trading style:
As #XRP approaches the blue circle zone, I will be looking for bullish reversal setups (like a double bottom pattern, trendline break , and so on...)
📚 Always follow your trading plan regarding entry, risk management, and trade management.
Good luck!
All Strategies Are Good; If Managed Properly!
~Rich

Bitcoin Symmetrical Triangle & another pattern formingBTC is currently trading in a Symmetrical Triangle formation.
This is generally a continuation pattern.
There's also a longer term BTC pattern FORMING.
Do you see it?
Inverse Head & Shoulder.
But it is a ways off, time will tell.
Bitcoin Crypto

Ethereum Holds the Line – Is $2,300 the Key to the Next Rally?By examining the #Ethereum chart on the weekly (logarithmic) timeframe, we can see that after rising to $2,880, the price faced selling pressure and corrected down to $2,500. This upward move created a large Fair Value Gap (FVG) between $1,870 and $2,300, which is likely to be filled in the medium term if the price drops further.
However, as long as Ethereum continues trading above the $2,300 level and does not close below it, we can still expect further bullish movement.

XBR/USD.30M CHART PATTERN.(XBRUSD) on the 30-minute timeframe, here’s the technical outlook:
Chart Pattern Observed:
You have a symmetrical triangle breakout setup:
The price is currently breaking above the triangle resistance.
There’s a bullish bias post-breakout with two targets marked.
Targets Identified on Your Chart:
1. First Target: ~$79.00
2. Second Target: ~$81.50
These are based on the typical triangle breakout projection, where:
The height of the triangle is measured and added to the breakout point.
The first target often aligns with a conservative measure.
The second target aims for the full projection of the pattern height.
Current Price: ~$75.32 (as shown)
Confirmation:
To validate this breakout:
Watch for a candle close above the triangle resistance.
Confirm with volume increase or continued momentum.
Stop-loss is ideally below the triangle support, near ~$73.00.
Let me know if you want risk/reward calculations or a similar setup on a different asset.

EUR/USD 4H CHART PATTERN.EUR/USD 4H chart, the chart analysis shows a bearish outlook after a potential rising channel breakdown. Here are the key bearish targets as shown:
---
📉 Bearish Targets:
1. First Target Zone (FVG Area)
Price Range: Around 1.1400 – 1.1350
This is marked as the Fair Value Gap (FVG) and could act as the first reaction/support zone.
2. Second Target Zone
Price Range: Around 1.1250 – 1.1200
Clearly labeled as “TARGET” in the middle of the chart.
3. Final Target Zone (Major Support)
Price Range: Around 1.1100 – 1.1050
Also labeled “TARGET” at the bottom. This aligns with a past support level and previous consolidation area.
---
🧭 Summary:
A breakdown from the rising channel is expected.
Price may drop first into the FVG zone (1.1350 area).
Then continue down to 1.1200.
Final support target sits near 1.1050.
Would you like me to help identify bullish invalidation or risk levels as well?

US500.4h chart pattern.US500 (S&P 500), here's a breakdown of the potential bearish targets you're pointing to:
---
📉 Market Overview:
Price has broken below the trendline and is currently hovering near the Ichimoku cloud support.
The bearish path is outlined on the chart with multiple target zones indicated by horizontal lines and a large blue arrow.
---
🎯 Bearish Targets (as shown on your chart):
1. First Target Zone: Around 5,920 – 5,930
Minor support area just below current range.
2. Second Target Zone: Around 5,860 – 5,870
A more solid prior demand zone.
3. Final Target Zone: Around 5,780 – 5,790
Major support zone, aligns with previous consolidation area.
---
🧭 Strategy Notes:
If price closes below 5,950 on the 4H or daily candle, it may confirm a stronger bearish continuation.
Keep an eye on volume and price reaction near 5,920, as this is likely the first bounce zone.
Would you like a marked-up version of this chart with exact price levels and arrows for clarity?

HolderStat┆BTCUSD forming a triangleBINANCE:BTCUSDT is bouncing from the 104 k pennant foot on trend support, turning squeeze into bullish advance. Holding the rising line preserves upside bias; clearing 111 k unlocks 121 k and ATH chase 🏆

HolderStat┆ETHUSD continues to accumulateOKX:ETHUSDT is catching bids at the 2.50 k rail after triangle retest, converting shakeout into upside continuation. Staying above 2.40 k keeps bias north; clearing 2.75 k releases the 3 k target rocket 🚀

HolderStat┆XRPUSD reboundBYBIT:XRPUSDT is carving higher lows off 2.03 support through a wedge break, morphing base into bullish momentum. Holding the rising line sustains upside tilt; clearing 2.35 unlocks 2.55 and breakout buzz 🌊

HolderStat┆SOLUSD successfully retested the supportBYBIT:SOLUSDT is springing off the 148 mid-channel rail inside a descending-flag bust, shifting retrace into rally restart. Protecting the trend-line keeps bulls in control; clearing 158 opens 172-180 pursuit 🌞

HolderStat┆BNBUSD above the $650 levelBYBIT:BNBUSDT is squeezing above the 650 breakout shelf after a flag retest, turning consolidation into up-move renewal. Maintaining 640 trend support holds bias north; clearing 670 unlocks 710-730 and blue-sky talk 🚀

HolderStat┆ADAUSD BULLISH BOUNCEBYBIT:ADAUSDT is squeezing out of its falling-channel floor, carving a clean higher-low right above 0.66. That move flips a month-long consolidation into a fresh trend-restart signal. A steady bid on top of the diagonal keeps the bias pointing north-east; reclaiming 0.71 unlocks the 0.77 target where the upper megaphone meets prior supply. Break that and the “new-highs” narrative returns to center stage.

BTC Dips After ATH – $100K Support in Focus Amid TensionsBy analyzing the #Bitcoin chart on the weekly timeframe, we can see that after rallying to $111,980 and printing a new all-time high, price faced a correction down to $100,000.
Currently, Bitcoin is trading around $105,700, and with geopolitical tensions escalating, particularly the risk of war, we could see further downside — potentially taking price as low as $90,000.
However, if BTC manages to hold above the $100,000 level, there’s a strong chance we’ll see a short-term rally toward $120,000.
This analysis will be updated as the situation evolves. Stay tuned!
Please support me with your likes and comments to motivate me to share more analysis with you and share your opinion about the possible trend of this chart with me !
Best Regards , Arman Shaban

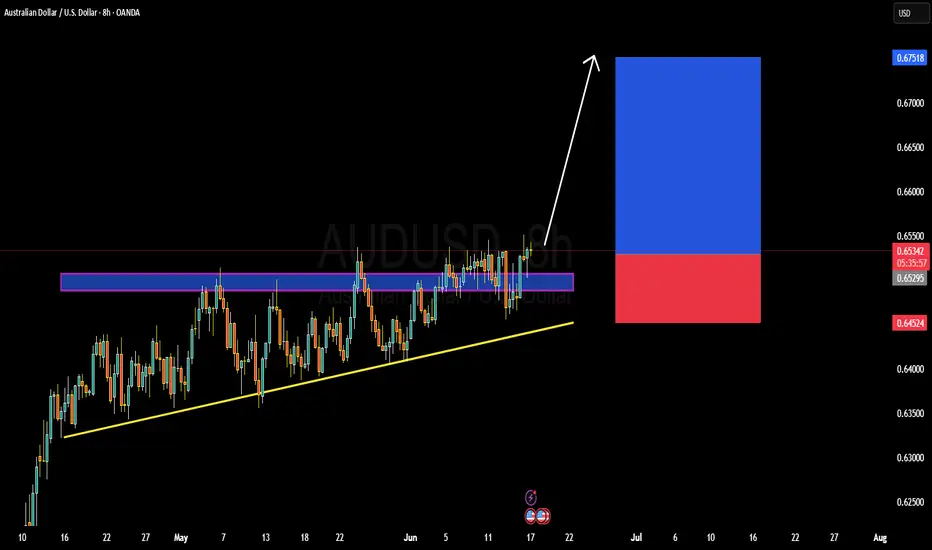
AUDUSD TECHNICALS AND FUNDAMENTALS DETAILED ANALYSISAUDUSD has officially broken out of a multi-week ascending triangle structure, and momentum is now building for a bullish continuation. The price is currently trading around 0.6533 after a strong breakout above the 0.6520 resistance zone. This consolidation was forming higher lows, signaling accumulation and bullish intent. The clean breakout above the horizontal resistance confirms buyers are in control. With this pattern validated, my short-term target is 0.6700–0.6750, aligning with the measured move projection.
From a macro perspective, AUD is gaining strength due to a divergence in monetary policy outlooks. The Reserve Bank of Australia remains hawkish, supported by sticky inflation data and a tight labor market, while the Federal Reserve has recently hinted at a dovish turn, acknowledging signs of economic slowdown. Additionally, a weaker U.S. dollar index (DXY) and rising commodity prices—especially iron ore and copper—are tailwinds for the Australian dollar. These fundamental shifts are reinforcing the bullish technical breakout.
On the 8H chart, the ascending triangle is a clear signal of bullish pressure. The zone around 0.6450–0.6520 acted as strong demand during the consolidation phase. A successful breakout retest of this zone could offer secondary entry opportunities. The risk-reward ratio is attractive, with a defined invalidation below the trendline and a target extending toward yearly highs near 0.6750.
This setup stands out as high-probability. With bullish price action, supportive fundamentals, and risk-on sentiment returning across FX majors, AUDUSD is primed for further upside. I’m holding long with conviction, expecting continuation toward the projected breakout target. This trade aligns with current market structure, trend strength, and macro drivers—perfect timing in a trending market environment.
Maple (SYRUP) Bullish Impulse, Final Target & Correction Support+553% since its 7-April bottom, but the third wave is already in. Notice how the volume is super high until 15-May but then it drops as prices continue higher. This means that only the fifth wave remains. After the completion of the fifth wave there should be a correction before additional growth.
The two main targets for this current bullish impulse are shown on the chart but it can go higher of course. A number came up around $1.23 but this chart is just too young.
Once the correction starts, the main support will be where the 1.618 Fib. extension is now. Can wick lower but the 0.786 isn't likely to be tested. Maple Finance SYRUP.
Namaste.

Ronin: Low Risk vs High Reward Potential It is interesting the large amount of volume that has been coming in recently. Just yesterday it was the highest on a daily basis since November 2024 and we know November 2024 was a bullish month.
There is a very strong wipeout candle here, 30-May. These can be taken as a strong reversal signal but only at this juncture of course.
3-Feb we had a wipeout candle but there was no clear bottom in sight yet, and bearish volume was high and thus the market continued lower.
The one from 30-May is preceded by a bottom formation, so we know this one is the final low. Also, this candle is not present on other exchanges which is quite revealing. It means this exchange wanted to liquidate all its leveraged trades and activate all stop-loss orders. It certainly did.
So we ignore this candle but take from it that the bottom is already in. Confirmed. This means that growth will happen next and the high buy volume yesterday confirms this second statement. All in all, we can go LONG with a high probability of success.
Low risk vs a high potential for reward.
Namaste.

Avalanche, The Money Tree; Great Entry Price & TimingWhat's the first thing you consider when looking at a chart? What is the first thing that catches your attention?
When you take the leap, how confident do you feel that your conclusions are correction? Do you doubt yourself? I don't.
The first I look at are the candles and the chart structure. Later comes the volume and price patterns. Finally, if somehow the direction is not yet clear, I add some indicators for additional support. What about you, what is the first thing you consider when looking at a chart?
I think Avalanche is ready to grow based on a rising channel, a structure of a higher lows. This small and young structure is a period of consolidation before maximum growth. Timing is running out. The market is about to go bullish and it will grow with full force.
It doesn't matter what is happening "out there," Crypto is going up.
Looks like a great entry timing is possible on this chart. The price is awesome. It is the same chart setup we've been looking at for months and months. The current price range has been active since early March.
The rise from March, April and May all include the 3-February low. It is certain and highly obvious, this consolidation has been going for too long. The bearish bias is missing. Bullish consolidation means that a bullish breakout will follow when this phase ends. The start of a new uptrend. All those altcoins that moved first revealed what will happen to this pair.
Did you miss those? I showed you some pairs that grew more than 100% in a single day. You know something interesting? The chart on those pairs is exactly the same as this one. The drop, the recovery and the higher low.
Soon, very soon, Avalanche will follow and the rise will be very strong.
Namaste.

WLD Sparks Panic Here’s Why the Worst Might Still Be AheadYello Paradisers, have you seen how #WLDUSDT just collapsed out of nowhere? After weeks of slow, grinding price action inside a dangerous ascending broadening wedge, #Worldcoin has finally snapped, and this breakdown could be the start of something much bigger.
💎We had this move on the radar well in advance, as the structure continued maturing. The wedge was perfectly defined by rising support and resistance levels, and price got smacked down with precision from the top of that range. When #WLD printed a clear Change of Character (CHOCH), breaking beneath the wedge’s lower boundary, it wasn’t noise it was a direct signal of weakening momentum and a confirmed shift in market structure toward the downside.
💎What followed was a textbook retest of the breakdown level, which now aligns with a powerful supply and resistance zone between $1.069 and $1.125. As long as the price remains trapped below this zone, the bearish momentum stays in full control. Right now, the next area we’re eyeing is $0.847, where price might see a temporary pause. But make no mistake if the selling continues, #WLD is likely heading toward $0.580, and in the most extended bearish case, we’re watching the major support base at $0.347.
💎Any invalidation of this bearish setup would require a full breakout above $1.623, but with the current market structure, that kind of reversal seems extremely unlikely without a strong macro or fundamental catalyst flipping the narrative.
Trade smart, Paradisers. This setup will reward only the disciplined.
MyCryptoParadise
iFeel the success🌴

Bitcoin Will Continue Rising —Long-Term Chart —$200,000+ New ATHIn November 2021, the week after the all-time high was a crash. The weeks that followed were a continuation and the market went full red and didn't stop dropping until November 2022, a year later.
In May 2025, the week after the all-time high is neutral, sideways. Four weeks later and Bitcoin continues sideways consolidating near resistance, ready to break to new highs and continue rising.
Market conditions now are very, very different compared to 2021. Right now, we are only halfway through the current bull market, for Bitcoin, and we have room left available for plenty of growth.
In a matter of days, maybe 5-6 days, we get a new all-time high and this means not the end of the bull market but the start of the next and final bullish wave.
These targets on the chart are the most accurate of all numbers because they are based on almost 5 years of data.
Next target and minimum price for Bitcoin in the coming months is $155,601 but we know there is likely to be more, much more. With the institutional wave now in full force, banks opening to crypto because they have no other choice and the world evolving faster than anything we thought possible, we are aiming for $200,000 or more.
The next relevant level after $155,600 is $209,125. Which one is your target for this new 2025 all-time high?
Do you think Bitcoin will peak in late 2025 or early 2026?
Do you think you will manage to be successful in this round or are you bound to make the same mistakes? Over-trading, over-leverage, no being patient enough; not waiting for the right time to enter and not selling when the market is trading very high, greed; What will it be?
Do you think you have what it takes to succeed? You do!
Even if you made mistakes in the past or even if you are already doing good, you have what it takes.
If you are doing bad, this experience can be used to improve your game. If you are doing great, great, let's do better. There is never enough growth; we are happy, we are grateful but we accept abundance because we receive abundance thanks to hard work.
It is still very early but the market is starting to heat up. Once the bullish action starts, there is nothing that can stop us. The world will change for us. We will adapt to all market and geopolitical conditions, we will continue to improve and evolve.
The best one is not the one that makes no mistakes but the one that can extract learning from all experiences. Success is not being right all the time, success is never giving up.
Will you give up? Or, will you continue to trade long-term?
» Bitcoin is going up!
Namaste.

VaderAI by Virtuals Explodes, 1,379% Profits Since Its 7-AprilBoom! Crazy growth it seems is not only ultra bullish but truly bullish confirmed. VADERUSDT already grew an astonishing 1,379% in a little over two months and the chart shows potential for additional growth.
This is what I am talking about but of course this pair exceeded all expectations, this is only the start, many altcoins will be doing the same in the coming months. This type of growth will be normal mark my words.
Some pairs always move ahead. On the left side of the chart we have the bear market. March marks the end of the bearish trend. April marks the start of the bullish phase.
The bullish phase will continue and can go for many months. There is no limit to how far up prices can go. Truly, there is no limit. Once the market enters the price discovery phase, the only choice we will have is to watch and be amazed. Many lives can change forever with what we are about to experience. Position yourself in the best possible way you can.
This is truly the opportunity of a decade, maybe a lifetime. Yes, there will be many bull markets in the future but the cryptocurrency market will be more mature, we don't know exactly how these opportunities will develop but we do know that now, what we are seeing now is the change of an era; money going from tightly controlled, to being free and accessible to all.
Money used to be owned by a few banks. Now money is owned by the people. With people owning the new money supply, the world will enter a period of abundance and growth. While money in the past was being suppressed and inflated on purpose, money will now be shared and made available on purpose.
While the previous system was designed to create scarcity for the majority, power and control for the few; the new system is intended to work for you. Whatever you want you can achieve, you can create your own money now. Nobody can stop you. That's what Cryptocurrency can do.
Bitcoin is the evolution of money.
Crypto is the evolution of finance.
It is already here and it is here to stay.
Trade Crypto, buy Crypto and hold Crypto long-term, you will be happy with the results.
Namaste.

Sushiswap 1,2 Breakout Sequence Can Lead To New ATH (3,000% PP)On this chart and after reaching a market bottom Sushiswap produced a clear 1,2 breakout sequence. This sequence has been shown to produce a bullish wave.
You know what they say, "Third time's a charm," and we are on the third breakout from a long-term support.
1) In early June 2023 we have the first 1,2 breakout sequence which leads to a bullish wave that ended in March 204.
2) In August 2024 the same sequence again, and a new bullish wave ends December 2024 with a higher high compared to March.
3) Fast forward and bring yourself to this present day, April 2025 the same sequence starts as a higher low. "Third time's a charm." Here we are getting not only a higher high but it is possible even a new all-time high.
» Growth potential can reach 1,500%, 2,500% or even beyond 3,000%, it is still too early to say.
It is not early to know though that the market already hit bottom and is preparing to grow.
This is a good chart and a great project; an awesome opportunity. Buy and hold.
Namaste.

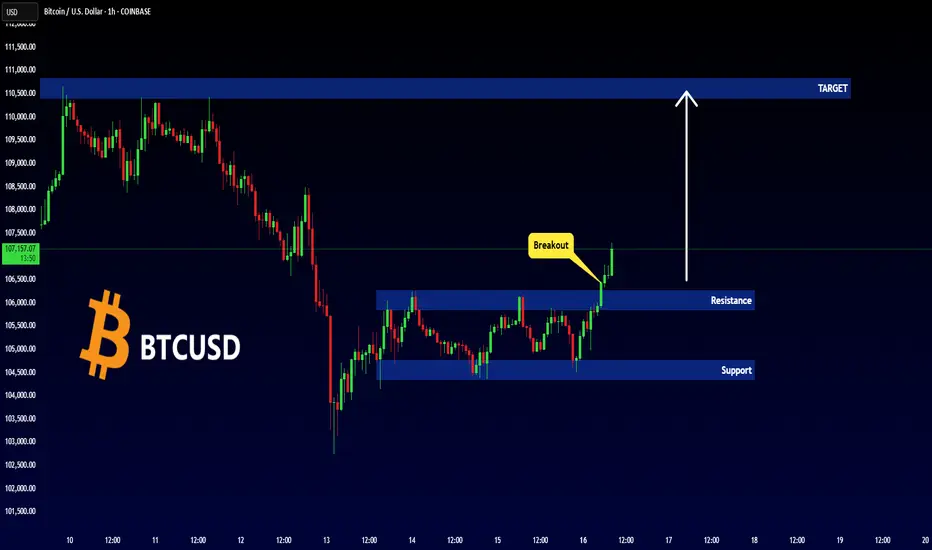
BITCOIN - Important Breakout !Hello Traders !
The Bitcoin price formed a rectangle pattern.
Currently, The resistance level is broken !
So, I expect a bullish move🚀
_____________
TARGET: 110400.00🎯