BTC is Bullish!Hello TradingView Family / Fellow Traders. This is Richard, also known as theSignalyst.
📈BTC has been overall bullish trading within the rising channel marked in blue.
Moreover, the red zone is a strong structure!
🏹 Thus, the highlighted blue circle is a strong area to look for buy setups as it is the intersection of structure and lower blue trendline acting as a non-horizontal support.
📚 As per my trading style:
As #BTC approaches the blue circle zone, I will be looking for bullish reversal setups (like a double bottom pattern, trendline break , and so on...)
📚 Always follow your trading plan regarding entry, risk management, and trade management.
Good luck!
All Strategies Are Good; If Managed Properly!
~Rich
Crypto

Magic: Higher Low, Falling Wedge & Bullish Continuation (1,046%)It seems like forever, but it is worth it because of the huge potential for growth.
The falling wedge pattern is a classic, we haven't been seeing that many recently and here we have one.
The initial breakout in April only lasted two weeks. MAGICUSDT peaked 21-April and started a long retrace, this retrace as always happens ends in a higher low. The candles formed a falling wedge pattern which can be used as a bullish reversal signal.
As the breakout from the pattern happens today, we can see trading volume going up. The highest volume since April. This high volume confirms this move being real and we can expect additional growth.
The following targets can be hit within 1-3 months. So these are huge numbers watch:
» $1.14 Gives 626%.
» $1.80 Gives 1,046%.
» $0.4759 Gives 203%.
These are great numbers, nice potential for growth. The last target can be hit short-term, within thirty days. It can be less.
Thank you for reading.
Your support is truly appreciated.
I hope we can continue to exchange for the long-term.
You give me attention, and I give you knowledge and great trading opportunities.
Namaste.

ADAUSDT Is Warming Up for a Major MoveYello, Paradisers! Did you notice what just happened on ADAUSDT? After sweeping liquidity, the pair has now printed a bullish internal change of character (I-CHoCH), confirmed by bullish divergence. This confluence significantly increases the probability of a bullish move from here—but only if you play it smart.
💎From the current price levels, the risk-to-reward ratio isn’t the most attractive for conservative entries. Aggressive traders might still consider taking a position with a tighter invalidation, but the trade needs to be managed with precision.
💎For those who prefer safer setups, it’s much wiser to wait for a pullback into the key support zone. A confirmed retest from there could offer a much cleaner risk-to-reward structure and a clearly defined invalidation level.
💎However, if the price breaks down and closes below that invalidation level, this entire bullish setup becomes invalid. In that case, it's best to stay patient and wait for a new structure to form before jumping back in. Entering too early in uncertain territory can turn a high-probability setup into a costly mistake.
🎖Strive for consistency, not quick profits. Treat the market as a professional, not a gambler. Discipline and timing are what separate the winners from the crowd. Be patient, wait for the high-quality trades, and execute with confidence. That’s how long-term success is built in this game.
MyCryptoParadise
iFeel the success🌴

Altcoins Market Bull Market Confirmed, AltLayerThis is just one, another one, but this theme will continue to repeat over and over, again and again.
Here AltLayer is producing a three digits strong bullish breakout; the highest volume ever today and this confirms the start of the 2025 altcoins market bull market.
Total growth amounts to more than 115% in the past few hours. This is similar to what we saw with Ravencoin and Axelar, these projects produced three digits green in a single day and the market is producing a bullish continuation on those, here it will do so as well.
This is only the start, prepare for maximum growth.
If you enjoy the content, consider hitting follow. I will be sharing new altcoins daily for year to come.
Namaste.

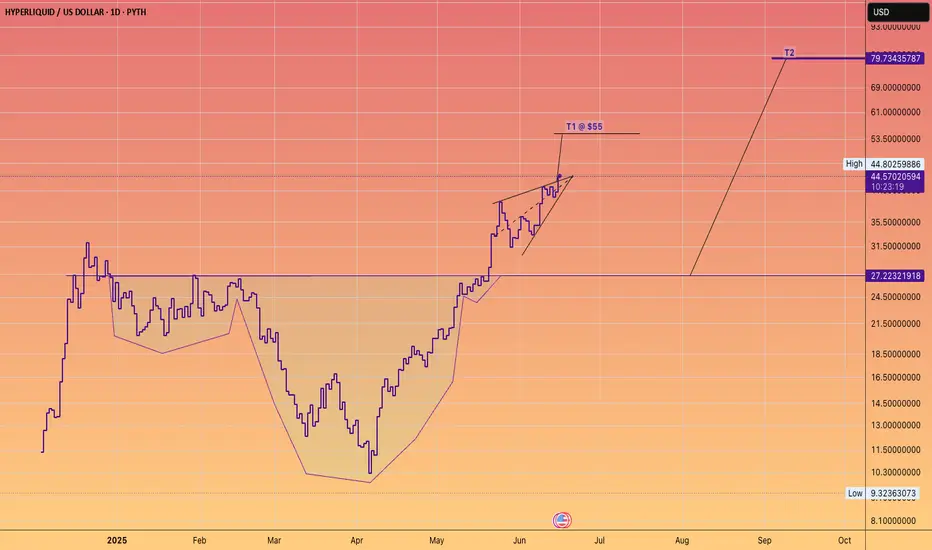
Don't fight the HYPE train!The James Wynn saga was wonderful advertising for the platform.
(Maybe it was staged).
Either way #Hyperliquid goes higher.
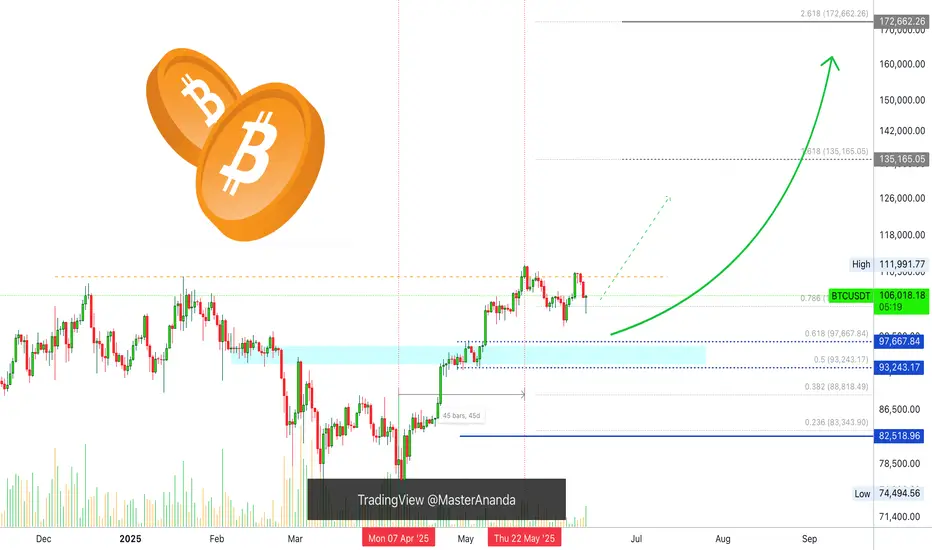
Bitcoin, Good News & Good News —Bullish Confirmed (Retrace Over)First, the good news is that we have a higher low and a strong recovery in place. The current candle has a long lower wick and is already trading green, at the top of the session.
The second good news is how far down the retrace went. Last time Bitcoin bottomed around $100,300, this time the bottom happened at $102,660. This is an early signal of course because the week is not yet over. It can happen that prices move higher today and tomorrow they move back down, crash on Sunday and we get a bearish close. But, looking at short-term price action and other altcoins, also the volume—notice the volume—we can say that the retrace is over and we are set to experience immediately additional growth.
The volume is the most revealing signal right now.
The drop had no volume compared to today. Today's session has more volume than the last three red-days combined.
Another signal to consider is the amount of over-leveraged gamblers that were liquidated, a total of 1 billion dollars. When this much greed is removed from the market, there is no need for lower prices.
I will call it early, the retrace is over. Time to go bullish again.
Thanks a lot for your continued support.
I will show you several more altcoins that are also looking ready to grow.
Namaste.
LINK MARINES are becoming a dwindling force.It was likely a fabricated tag solely for Crypto Twitter, conceived by early ICO investors. Something to rally a war cry behind.
Similar to the LINK Crypto dominance chart.
There’s a continuation head & shoulders pattern with a logarithmic target indicated.
Indeed, the token might increase in dollar value.
However, with 700 employees to compensate through token sales,
The salaries are excessive given the stagnant growth of token holders, and I must say, the decline in holders over the years makes it difficult to sustain the price/valuations.
If a #DEFI season was to occur, I would probably take advantage and unload old bags into the pumps.

BTC/USD.4H CHART PATTERN.> Buy at 106,800
Resistance at 105,700
But resistance should be above the current price, not below. If 105,700 is below 106,800, it would typically be support, not resistance.
Corrected Interpretation:
Here's how your setup likely looks:
Buy Entry: 106,800
Support (not resistance): 105,700
Target 1: 110,000
Target 2: 112,000
---
Strategy Summary:
Level Type
105,700 Support (Stop-loss zone)
106,800 Entry
110,000 Target 1
112,000 Target 2
---
Trade Notes:
If BTC holds above 105,700, your long position is technically supported.
A break below 105,700 might invalidate the bullish setup — consider a stop-loss below that.
Momentum toward 110K–112K is possible if the market breaks out of short-term consolidation or reacts positively to macro news.
Would you like a chart or confirmation based on technical indicators (RSI, trendlines, volume, etc.)?

NZDJPY TECHNICALS AND FUNDAMENTALS DETAILED ANALYSISNZDJPY is currently trading around the 87.00 handle and has just bounced strongly from a well-respected support zone. The pair is now showing clear signs of recovery after a brief corrective dip, and price action on the 8H chart confirms a bullish reversal structure. The support held firmly, and we’ve already seen a solid rejection wick forming the foundation of this new impulsive leg up. With this momentum in play, I’m targeting the 90.00 zone in the coming sessions.
On the macro front, the New Zealand dollar is benefiting from a relatively hawkish RBNZ stance. Inflation pressures remain sticky in New Zealand, and the central bank has reiterated its cautious approach toward rate cuts. Meanwhile, the Japanese yen remains under persistent selling pressure due to the Bank of Japan's ultra-loose policy and intervention uncertainty. These diverging central bank outlooks are fueling continued upside in NZDJPY as carry trade flows remain in favor of the kiwi.
From a technical perspective, the market structure remains bullish. After retesting a previous higher low, price is climbing within a clean channel and has broken minor resistance levels convincingly. This aligns well with a swing continuation pattern toward the 90.00 mark. Momentum is supported by increasing bullish volume, and as long as we remain above 86.00, the bulls are firmly in control.
In my analysis, this is a textbook setup. We’re seeing higher lows, strong trend continuation, and a macro-backed directional bias. I’m long from 87.00 with a bullish outlook into 90.00. I’ll reassess price action as we approach major resistance levels, but until then, I remain confidently positioned with a clear technical and fundamental confluence.

DOT/USDT - Bullish On the 4-hour chart, DOT/USDT has shown a clear bullish rejection from its significant horizontal support zone around $3.80 - $3.85. This strong bounce indicates robust buying interest at this critical level, signaling a potential reversal and a buying opportunity. The price action here underscores the validity of this support, suggesting diminishing selling pressure.
While a descending trendline remains overhead as dynamic resistance, the current rebound sets the stage for a potential challenge to this overhead barrier. A confirmed break above this trendline would further strengthen the bullish outlook. Traders may consider long positions with a prudent stop-loss placed below the $3.80 support to manage risk effectively.

ETH is doing it AGAIN!Hello TradingView Family / Fellow Traders. This is Richard, also known as theSignalyst.
📈ETH has been overall bullish trading within the flat rising channels marked in blue.
Moreover, the green zone is a strong support zone!
🏹 Thus, the highlighted blue circle is a strong area to look for buy setups as it is the intersection of support and lower blue trendlines acting as non-horizontal support.
📚 As per my trading style:
As #ETH approaches the blue circle zone, I will be looking for bullish reversal setups (like a double bottom pattern, trendline break , and so on...)
📚 Always follow your trading plan regarding entry, risk management, and trade management.
Good luck!
All Strategies Are Good; If Managed Properly!
~Rich

ETH/USDTEthereum (ETH/USDT) is currently maintaining its bullish momentum above a well-respected ascending trendline that has been active since early April. After a strong breakout above the 2347 level, the price entered a consolidation phase between 2600 and 2800, suggesting that the market is preparing for its next significant move. As of now, ETH is trading near 2627 and forming higher lows, which is a positive sign of buyer strength.
The key support zones are located at 2347 and 2266, while resistance levels to watch are 2768 and 2834. As long as the price holds above the ascending trendline, the bullish structure remains intact. A bounce from the current region, especially near the trendline, may present a favorable long opportunity. In such a scenario, a breakout above 2768 could open the path toward 2834 and potentially higher levels in the medium term.
A suitable long setup would involve entering around the 2620–2640 zone with a stop loss below 2347 to protect against trend invalidation. The first profit target can be set at 2768, and the second at 2834. However, traders should remain cautious: if ETH breaks below the trendline with strong bearish volume, the bullish outlook would weaken, and the price may revisit lower supports. Until then, the market structure favors buying the dips in alignment with the prevailing uptrend.

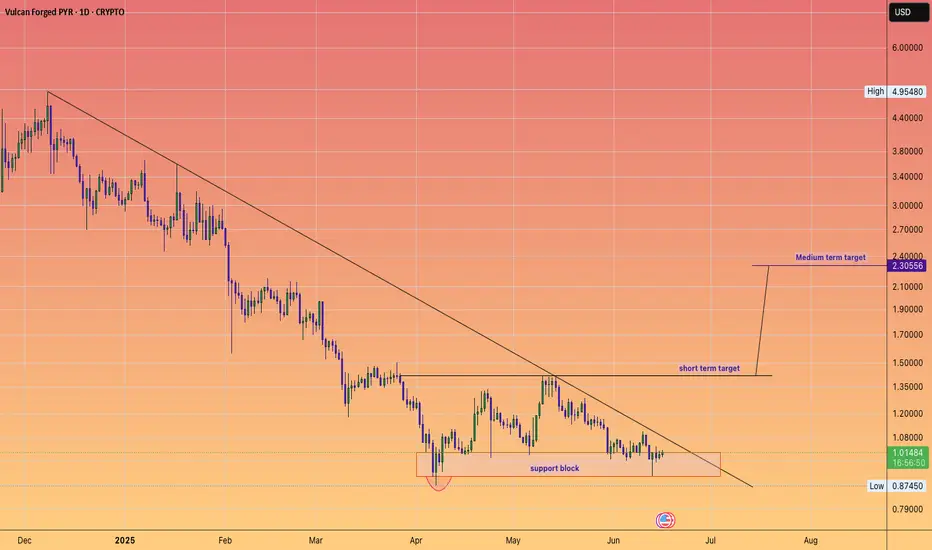
Can Vulcan forged double over the summer?#PYR
#PYRUSD
Clear defined downtrend line, small support block.
#Gaming coin
so needs interest in gaming sector to reinvigorate this coin.
TOKENFI #TOKEN Trade alertPlay the bounce for a short term target trades from this clear support block with the deviation low already in place.
For long term believers good area to DCA to bring down your average cost.

S&P 500 Index.4H CHART PATTERN.the S&P 500 Index (4H timeframe), it appears you're using a combination of Ichimoku Cloud, trend channels, and support/resistance zones to project downside targets. Here's the breakdown of your marked targets:
📉 Bearish Targets:
1. Target 1: Around 5,500
2. Target 2: Around 5,200
3. Target 3: Around 4,950–4,900
---
🔍 Technical Observations:
Price has broken below the upward trend channel.
It's entering the Ichimoku Cloud, signaling potential consolidation or bearish pressure.
The large blue downward arrow indicates a bearish expectation, possibly tied to macro/fundamental concerns or technical reversal patterns.
The grey resistance block near 5,960–6,000 suggests failed breakout/retest.
---
📌 Summary:
If current bearish momentum continues:
✅ Immediate Target: 5,500 (first major support)
⚠ Medium Target: 5,200
🔻 Final Target Zone: 4,900–4,950 (strong previous support and fib zone)
Let me know if you want stop-loss ideas, confluence indicators, or entry strategy breakdowns!

XAU/USD,4h chart pattern.Im looking to buy Gold at 3432 with a target of 3500. Here's a quick analysis and trade plan for this idea:
---
🟡 Gold Trade Setup
Buy Entry: 3432
Target (Take Profit): 3500
Potential Gain: 68 points
Suggested Stop Loss: Around 3400 (for a 1:2 risk/reward ratio)
---
📊 Things to Consider:
1. Trend: Ensure the current market trend supports a bullish move. Look for higher lows and higher highs.
2. Support at 3432: Is this a strong support level? If it’s holding multiple times, it can be a good entry.
3. Resistance at 3500: This could be a psychological or historical resistance. Be ready for partial profit booking near it.
4. News & Events: Watch for U.S. economic data or Fed comments that could impact gold volatility.
5. Risk Management: Don’t risk more than 1-2% of your capital on this trade.
---
Would you like a technical chart setup or analysis based on current market conditions to support this trade idea?

USD/JPY...1h chart pattern..Here's a quick summary of MY USD/JPY trade setup:
---
Trade Idea: SELL USD/JPY @ 144.000
Entry Point: 144.000
Target 1 (TP1): 143.400 → +60 pips
Target 2 (TP2): 142.400 → +160 pips
Suggestions:
Stop Loss (SL): Consider setting a stop loss above recent resistance (e.g., 144.500 or 144.800) to manage risk.
Risk/Reward Ratio:
For TP1: 1:1 with SL @ 144.600
For TP2: ~2.6:1 with SL @ 144.600
Key Technical Zones:
Watch for support near 143.400 (TP1); possible bounce or consolidation.
142.400 is a deeper move — stronger confirmation needed (e.g., a break below 143.400 with volume).
Let me know if you’d like a chart analysis or updates on news that could impact this trade.

Solana Name Service—Bonfida, Bull Market Volume (2,450% PP)Sometimes just one signal is enough. We have a clear bottom pattern and the highest volume ever. The interesting part is that trading volume started to rise significantly in September 2024, a long time ago. There is lots of interest for this pair.
Solana Name Service—Bonfida—FIDAUSDT is still early, not bullish confirmed.
There is a low in April, then in May and again in June. This chart pattern reveals a bottom. Coupled with the highest volume ever for two consecutive weeks, and you know a strong support level has been established.
Not many people will be able to catch (grab) this bottom. Many people are even allergic to such a strong opportunity. We tend to feel repelled by the market and turn away when prices are low. Only when there is action, strong bullish action and prices are high our interest is piqued.
Ok, things are different today. We are going to fight this force that tells us to move on, and we are going to consider an easy spot trade. We are going to buy and hold. What can go wrong buying LONG when the market hits bottom? Nothing. The worst case scenario is a long-term wait. On the other hand, if the altcoins market turns bullish tomorrow, we can profit from the entire bullish wave. Months and months and months of rising prices. Whenever there is a correction, we don't have to worry our entry is the best possible.
The best possible ever is now for this pair.
FIDAUSDT is set to grow. Bitcoin and the altcoins market will follow. Everything will grow... Just watch!
Thanks a lot for your continued support.
Namaste.

FetchAI New All-Time High —656% Profits Potential MappedSupport here is well defined, it is a long-term situation. Resistance in late 2023 and early 2024; resistance in late April 2025; support in early May and mid-June. This is the red line on the chart.
In early 2024 there was a small rounded bottom pattern below this long-term support line. After resistance was conquered a major bullish wave appeared, more than 400%.
In early to mid-2025 a big rounded bottom pattern appeared below this long-term support line. Below support it is resistance; it has been conquered as resistance and now FETUSDT trades above. This opens the doors for massive growth, really massive.
This chart setup is calling for a new all-time high. You can find several targets mapped on the chart.
» 221% is an easy target, easy profits; high certainty-high probability. This is around $2.30.
» $3.77 is a shy new all-time but I believe this is also high probability. This target gives 426% profits potential.
» The standard 2025 all-time high projection sits around $5.42. From current price, this gives a total of 656%. If we take the same target and use the April bottom as the startup point, we get 1,471%. This would be the total growth of a bullish wave that peaks at $5.42 in late 2025, but there can be more.
Prepare for the best, hope for the best.
The best is yet to come.
Namaste.

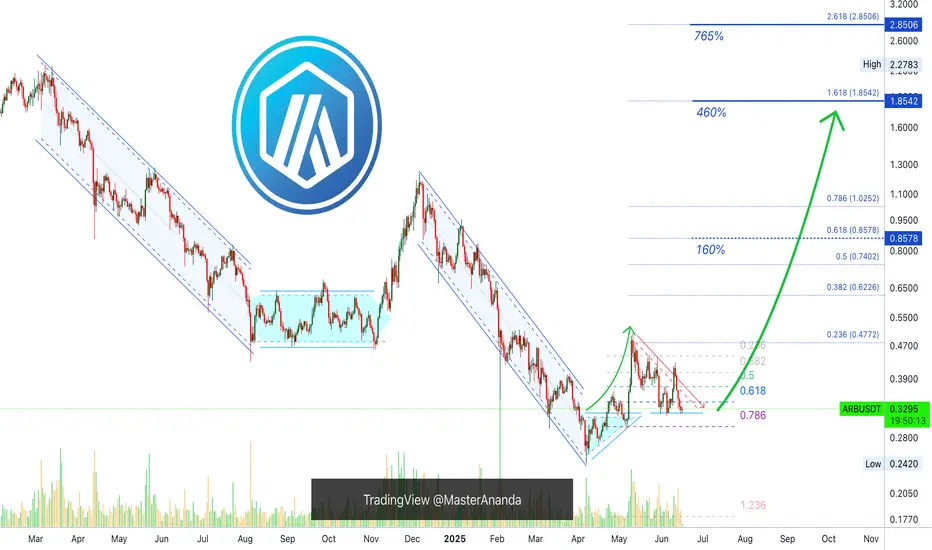
All Signals Positive, Arbitrum: 765% Easy Profits Potential—PPThis is a great pair and chart because the easy target goes beyond 450% profits potential. Another mid-term target can yield 765% in less than 6 months. Likely within 4 months. So this is a great chart setup because there is so much room for growth.
Arbitrum (ARBUSDT): Technical analysis daily timeframe
Arbitrum hit bottom 7-April and produced a small recovery, it grew a little more than 100%. This is the initial bullish breakout, and this move is always followed by a retrace. The retrace is in with a triple bottom above 0.786 fib. retracement and just below 0.618. This is the baseline for the start of the previous jump, resistance turned support. From this point a bullish continuation can develop. This continuation can start within days, say 5-6 days. So, in less than a weeks time, the Altcoins market will be green again.
ARBUSDT is preparing to grow. All chart signals are positive; this is an easy one; buy and hold.
Namaste.
Cosmos (Atom) 11 Months Within Accumulation ZoneThis is a repeating theme and pattern; this is a classic. Cosmos is now sideways after a correction. The correction is preceded by a bullish wave.
The bullish wave in late 2024 was a short-term, it lasted only one month. But what is interesting is the fact that the bottom range is the same now as it was before the last bullish wave.
If you count the period from the September 2024 low until present day, we have more than 280 days. A very long time. If we start counting from August 2024, when the current accumulation zone was activated, this gives us a total of 314 days, more than 10 months. This is truly all that we need to know. The same low holds for almost a year, getting very close.
If ATOMUSDT does not rise within 2 weeks, this would give us a total of 11 months within the same zone. But it doesn't break, each time a low point is activated there is strong buying and this has been happening long-term.
August 2024, September 2024, November 2024. Then again February 2025, March 2025, April, May and the same accumulation zone is still active today.
The whales are accumulating now, this is their buy-range. Once the accumulation phase is over, we will experience a strong bullish phase. Not a small jump as back in late 2024, but an uptrend, higher highs and higher lows.
Ravencoin weekly is a great example. See the 'related publications.'
Thanks a lot for your continued support.
Namaste.

Bitcoin Short-Term, 1H Timeframe, Bullish ($115,482 Next Target)Bitcoin completed its retrace 13-June 01:00 AM with a higher low at $102,663. Price action and trading volume indicates that the bearish move is over. Bitcoin is trading above support in the form of 0.618 Fib. retracement.
Bitcoin is turning bullish moving above EMA34, EMA21, EMA13 and EMA8 all in this current active session.
Immediate support stands between $105,293 and $105,314.
Next support is $104,533 and main support $104,282 matching the 0.618 Fib. retracement level.
Next target easy hit is $106,625, followed by $107,559. The second being a mild resistance.
Bitcoin can easily continue higher short-term aiming next at $108,989 followed by the last high at $110,586. Depending on how this level is handle we can update the short-term view.
The 1H timeframe is bullish now based on price action, candlestick patterns, higher lows, moving averages and the oscillators.
Namaste.

Bitcoin 100K Support Intact, The Bulls Win!Lately we've seen many cries about volume. Where is the volume? There is no volume! Etc. I tend to agree. My excuse in favor of a bullish Bitcoin was to say that low volume as prices moved higher worked as a continuation signal, things change.
We are now looking at BTCUSDT on the Daily timeframe and what I can notice is trading volume being relatively high. The days with high bull (green-buy) volume, are sometimes two to three times higher than the days with bearish (red) volume. This signal seals the deals. The bulls win.
This is a chart drawing that I used in the past. We have the low 7-April low and a higher low 5-June. Very strong bullish action for two months straight; very little retrace, weak bearish action for several weeks, the bulls win again.
The consolidation zone, the accumulation range, is defined here with blue and green, we know the price to be $100,000 and $110,000, Bitcoin trades at the exact middle, above $105,000. Giving the bulls another win.
Yesterday the action produced a higher low compared to 5-June. Even with very bad geopolitical conditions, a surprise war, Bitcoin remains strong. If not even war can break 100K as support, this simply means that Bitcoin isn't going any lower, Bitcoin is going up.
The most revealing part is the fact that Bitcoin didn't even reach 100K. Not in 5-June, not yesterday. 5-June the low was hit at 100,386. Yesterday, the low was 102,656.
There is lots of demand, supply is limited.
People are buying the dip. Whales are buying, institutions are buying; the world wants Bitcoin. Price action says Bitcoin is going up.
We can extract supporting signals from the Altcoins, Ethereum, XRP and Dogecoin are good examples, all the big projects are strong now when we consider the fact they are trading above MA200 daily and weekly, and this confirms a bullish bias with long-term growth.
$150,000 is not the top, Bitcoin is likely to go higher by the end of the next bullish wave. We can consider prices such as $180,000 and $200,000. This is because nobody is selling. Since people are not willing to sell, prices are sure to increase. Many altcoins are now extremely bullish, small and big.
All market conditions are fully aligned, it is only a matter of time.
Patience is key. Prices will rise.
Namaste.
