BITCOIN - Price can fall a little and start to move upHi guys, this is my overview for BTCUSDT, feel free to check it and write your feedback in comments👊
Price entered to rising channel, where at once bounced from support line and rose a little, and then corrected.
Next, price continued to move up and soon reached $100500 level, after which broke it and rose to resistance line.
After this movement, BTC corrected and continued to grow in rising channel and later reached $110500 level.
Bitcoin exited from rising channel, made a fake breakout of resistance level, and started to trades inside flat.
In flat, price tried to grow but failed and fell to support level and then grew back again, after which started to decline.
Now, I expect that BTC can repeat as move before, it falls a little and then grows to $110500 resistance level.
If this post is useful to you, you can support me with like/boost and advice in comments❤️
Crypto

XAUUSD BULLISH OR BEARISH DETAILED ANALYSISGold (XAUUSD) continues to maintain strong bullish momentum, with current price action sitting around 3,430. We have been holding a bullish outlook since the key accumulation zone between 3,150 and 3,200. Price has consistently formed higher highs and higher lows, and recent consolidation has broken out with conviction. Based on technical structure, my immediate upside target is 3,500, where I expect price to react before potentially extending even higher depending on upcoming macro drivers.
Fundamentally, gold is being fueled by a combination of sticky inflation data and a cautious Fed stance. Even though the FOMC held rates steady in June, market expectations are shifting towards policy easing later in the year due to softening labor data and a cooling economic outlook. Additionally, geopolitical uncertainties and continued central bank gold buying remain strong tailwinds for the metal. The U.S. dollar index has shown minor weakness post-CPI, offering further support to gold bulls.
Technically, the daily chart shows a clean bullish flag breakout that aligns with the trendline support and impulsive wave structure. Price broke above 3,400 with strong volume and minimal resistance, indicating clear bullish dominance. As long as price holds above the 3,380–3,400 zone, continuation toward 3,500 remains highly probable. There is also confluence from previous structure highs and minor Fibonacci extension levels around that mark.
Overall, I remain confidently long on XAUUSD. I’ve been tracking this bullish cycle since the 3,150–3,200 region and continue to favor upside moves backed by macroeconomic and technical alignment. I’ll be watching key reaction zones near 3,500 for potential profit-taking, while holding swing positions with dynamic risk management in place.

Thena Ready To Move Now! Strong Short- & Long-Term (1,155% PP)I don't like to post the same charts because there are just too many options and we cannot even get close to looking at all those, specially with a limit of only ten post per day. But, with that said, here we have Thena again, THEUSDT, why? Because it is ready to move and a great time-based opportunity only comes around so often.
When it comes to Cryptocurrencies opportunities are endless is true, but some tend to move faster than others and this one looks good. It looks good short-term and has huge potential also long-term. So good on all sides. Risk is very low. We have a classic local higher low and the stage is set, the world is ready; watch it grow.
Nothing is pointing down. Everything is pointing up.
No plan, no strategy, no complexities... Just buy and hold.
Namaste.

Ethereum vs Bitcoin 450% Growth Potential, Already ConfirmedEthereum is preparing a 155% rise vs Bitcoin, ETHBTC. The bottom is already in and this bullish wave confirmed. The 155% target is the minimum, "back to baseline," and it happens to match MA200 and the 0.618 Fib. extension level.
The main signal is a rounded bottom after a major multiple-years long downtrend. The same signal ETHBTC produced back in September 2019 but smaller in size.
The second signal is not specific to this pair only and relates to the cyclical nature of this market. Every four years, there is a bull market.
» ETHBTC produced a bull market in 2017.
» ETHBTC produced a bull market in 2021.
» ETHBTC will produce a bull market in 2025.
(Due to changing and evolving market conditions, the 2025 bull market can extend into early 2026. Just a possibility.)
This is true also for the small and medium cap. altcoins that are yet to grow. Strong projects such as Bitcoin and many big altcoins have been bullish for very long. These are on a league of their own. They cannot wait for the end of 2025 to produce a bull market because they have too much too strong demand and so they have been growing for years on end. The other part of the market, the neglected part, is about to go nuts. Extremely bullish in short.
This is a friendly reminder, load up and hold.
You will be happy with the results.
Prepare yourself to wait for months. On the safe side, 6-8 months. That would be minimum. The longer you are prepared to wait, the better it is for your mental state. There is no way to go wrong with Crypto unless you are doing leveraged trades. If you want to have certain profits, choose reputable projects through spot, and watch your money grow. Focused always on the long-term of course.
Namaste.

Sui Update, Retest of Support; Bullish ConfirmedIt's been 9 days since my last Sui update. The chart looks good.
For context, see the previous analysis:
We started at the C wave of an ABC correction. There was an attempt to push prices higher but resistance was found at MA200. The resistance produced retrace and the same support zone is tested and holds. If a new advance develops here, which is exactly what is going to happen, then you can expect much higher prices next. This time around, MA200 as resistance will break, which means a new high. The highest prices in more than six months, since January 2025.
This is where the next move will take us and this is easy to predict now that support has gone through a retest and holds.
Namaste.

Orchid 290% Profits Target, MA200 & Price Action FractalThe classic signals are already present on this chart, the double-bottom, etc. But I also have a price action fractal plus an unconventional signal supporting a bullish jump.
The easy target here is 290%, it can be hit within months. Not more than two to be more exact after the bullish breakout is confirmed. Long-term there can be more growth.
The price action fractal is a 1,2,3 sequence. A correction leads to a low that leads to sideways and then a bullish breakout. (1) The correction, (2) then consolidation and finally (3) the bullish breakout.
The unconventional signal revolves around MA200. When MA200 starts to curve down prices tend to shoot up. Right now this indicator only has a tiny curve but this is the start.
If you look at the action around September 2024, MA200 started to curve down. Prices continued sideways for more then a month but eventually a bullish jump developed. It always happens when MA200 starts to curve down. As it goes down, prices go up.
This is another signal that can be used to spot a trend reversal.
Thanks a lot for your continued support.
Namaste.

Ravencoin Bullish Continuation, Altcoins Bull Market ConfirmedRavencoin produced a major bullish breakout, we've seen many of those. It happens that you get one of these breakouts but the following week bullish action is dead. That was all, end of story. This isn't the case here and this is truly great news.
First, Ravencoin produced some of the biggest volume ever, only once was there a week with higher volume and the volume in the last two weeks is higher even than in the 2021 bull market. This clearly reveals the start of the next bullish phase, at least for this pair, but never in the history of Crypto has this project or any other gone on a bull market on its own, not in 2021 and not in 2025. What one does, the rest follows.
So we have a bullish continuation. Really high volume to break above EMA34 followed by additional growth. We can expect this trend to continue. These weekly candles are the biggest since 2021.
Get ready, because the same will happen across hundreds of altcoins.
Here is the daily timeframe:
Two days red and it is clear that this project is creating a new uptrend... Thank you for reading.
Namaste.

Bitcoin Cash Weekly Update, Moving Averages & Bullish PotentialI already looked at Bitcoin Cash recently, this time I want to see how the moving averages are doing here to compare with the other Crypto-projects. Good news for one pair is good news for other projects as well specially when they are in the same category. Bitcoin Cash is one of the big projects.
Here we can see BCHUSDT trading weekly above EMA34, EMA89 and MA200, while rising.
Resistance was found at $453, a fib. extension level. Once this level is broken as resistance you can expect a swift advance toward $680. It will be nice and easy. This is the last barrier and current price action is kind of mix.
It is good because this week trades at the highest since November 2024 coming from a low. It is bad because it is lower compared to 19-May on the wick but the week is yet to close.
A weekly close above $420 is highly desirable and favors the bulls, anything lower and we continue with a mixed situation. Make no mistake, the situation is mixed only short-term. The chart shows a clear bullish bias and there will be additional growth in the coming weeks and months. Only the short-term is questionable.
Bitcoin Cash, Bitcoin and the entire Cryptocurrency market is set to grow.
Thanks a lot for your continued support.
Namaste.

Solana Weekly TF, Good NewsI've gone deeper into Solana's chart and I have good news... You are looking at the weekly timeframe.
I looked at EMA34 and MA200 for some of the major Crypto projects, Bitcoin, Dogecoin, XRP, Cardano and Ethereum. You can find these in my profile @MasterAnanda.
Some were clearly bullish as the action was happening above both moving averages, others were mixed and one was bearish.
Solana is trading below EMA34 weekly but safely above MA200.
MA200 weekly sits at $100 for SOLUSDT.
There is another level of relevance, EMA89. On this chart shown as a blue line and this is the good news. EMA89 is working as support, it worked last week and this week it still holds. This same level matches perfectly the 0.5 Fib. retracement support relative to the move from 7-April to 19-May.
This is all to say that we are looking at a strong support zone, which means that it is likely to hold. If it breaks, it should be brief followed by a recovery right away.
Namaste.

Acala Hits Bottom, Which Means Bull Market Next (2800-3500% PP)Acala is now five weeks into the fire. If you read often you will understand clearly what I mean; if you are new, this might not make much sense.
The low happened 14-April here, ACAUSDT. Some weak action and then red. Five weeks red and the action remains relatively sideways, not much change in price.
Current price trades above the 14-April low. The 14-April low was 0.02698. Current price is higher. Five weeks red, high bearish volume and yet, no new major lows.
Notice the drop from early December 2024 until April 2025. Five weeks red can cover a huge distance, there can be a strong decline. When you see five weeks red but no change in price, this is a bullish signal. It means that the bears have no strength. It means we are not seeing a bearish trend nor a bearish impulse, instead, a retrace and stop-loss hunt. Since bearish pressure is non-existent and after weeks of selling prices aren't going any lower, we can predict change soon.
This change is bullish. The bullish signal comes from the fact that the bearish action is just too weak. It is like seeing prices trading near resistance (say a new all-time high) for weeks, months with no advance. This would reveal that the top is in and a crash comes next. In this case, the bottom is in and a bull market will follow.
Thank you for reading.
Namaste.

C98 Hits Bottom, More Than 3,333% Growth PotentialHere C98 breaks the pattern, a channel breakdown after going sideways for years. This is the liquidity hunt event. Two signals reveal that this drop is the bottom and precedes a change of trend.
1) The highest volume ever and since 2021 came in March as C98USDT looked for a new low.
2) We have a double-bottom.
The bullish action will start without warning, Boom!, 100-200% up. Then it will continue with full force, month after month after month of a rising market, see the green arrow. We are now very close.
That's all there is. Once you hit bottom, there is no other place left to go but up. Nothing, nada, nichts, niente, rien. Only up is possible now and that's where we are headed next.
Buy and hold. Growth potential goes between 2,500% and 3,900%.
Namaste.

Bitcoin Breaks 20-Jan 2025 Peak Price, New ATH Next (+Altcoins)Look at this, Bitcoin closed the day exactly above the 20-Jan 2025 high. This day Bitcoin peaked at $110,265, the all-time high before May; yesterday, 9-June 2025, Bitcoin peaked at $110,577.4 but closed at $110,270, five dollars higher. Is this a bearish or bullish signal? What to expect!
Good evening my fellow Cryptocurrency trader, I hope you are having a wonderful day.
This week starts with a bang, a big bang, with Bitcoin doing great. The question immediately arises and I will answer, Will Bitcoin continue growing? Or, will Bitcoin produce a retrace?
I can tell you with 100% certainty that Bitcoin will continue to grow. I can support this statement with data from the charts.
We have hundreds and hundreds of altcoins going bullish, strongly bullish, some coming out of a new all-time low. If Bitcoin was set to crash, these altcoins wouldn't be gaining in bullish momentum, they would be diving deep much lower in order to create new lows. But this isn't what is happening this week, last week and today, no! What we are seeing now is huge growth across the altcoins market and this confirms what Bitcoin will do next.
Needless to say, as Bitcoin trades near its all-time high this is extremely bullish.
If a new all-time high is hit but the action moves lower, say 10-15% lower and remains there, this is bearish and points to lower prices. If the action remains very close to resistance, as it is now, this is ultra-bullish. It is simple do you agree?
Because when there is an incoming drop many people in the know start to sell, so the action never stays at resistance there is always a strong rejection with high bearish volume.
On the other hand, when resistance is challenged and continues to be hit over and over, or the action stays very close, it simply means that people are buying, holding and ready for growth. Bitcoin will continue moving higher mark my words. It is very easy because this has been confirmed long ago.
The bottom was hit 7-April and we are now experiencing long-term growth. As Bitcoin continues to trade near its all-time high, the altcoins will blow up.
When Bitcoin grows 20-30%, some altcoins can grow 100-200%. When Bitcoin grows 50%, some altcoins can grow 300-500%. This is the 2025 bull market.
Thank you for reading.
Give me a boost if you trade and profits from the altcoins market.
Namaste.
P.S. Leave a comment with your favorite altcoins, I will consider the pair for a few full analysis.

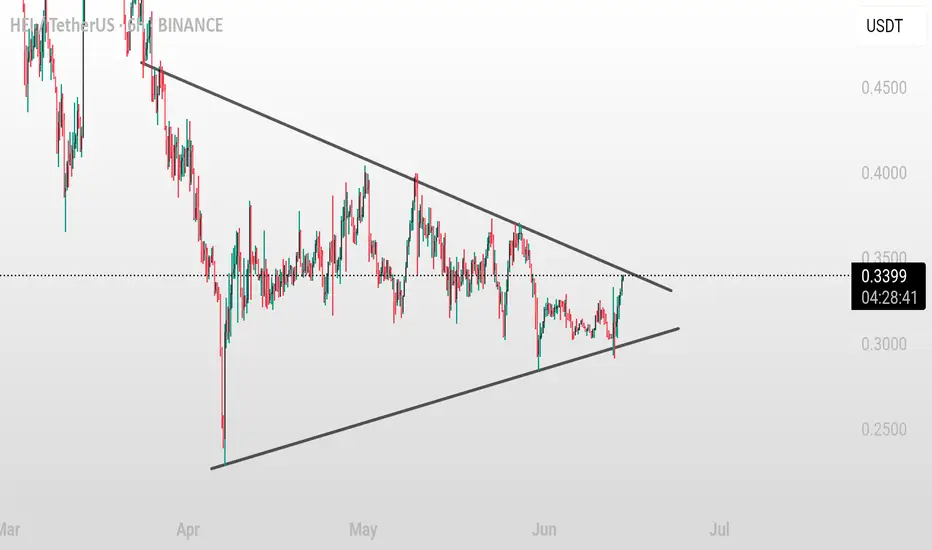
HEI/USDT – Symmetrical Triangle Squeeze Ahead of Big MovePair: HEI/USDT 💱
Timeframe: 6H ⏱️
Pattern: Symmetrical Triangle Consolidation 🔺
HEI has been coiling tightly inside a symmetrical triangle since April, with price nearing the apex. This setup usually precedes a strong breakout or breakdown. Momentum is building — a major move looks imminent 🔍🔥.
Bullish Breakout Scenario ✅
A 6H candle close above 0.36 confirms breakout:
🎯 Target 1: 0.45
🎯 Target 2: 0.55
🛑 SL: below 0.29 (recent swing low)
Bearish Breakdown Scenario ❌
A 6H candle close below 0.31 confirms breakdown:
🎯 Target 1: 0.20
🎯 Target 2: 0.12
🛑 SL: above 0.35 (recent swing high)
⚠️ Wait for confirmation with strong volume — this move could be sharp and decisive.
ETH UPDATE 🛡️ Ethereum Holds the Line — Critical Support Zone Tested Again
Because Ethereum has plummeted over 14% since Wednesday, traders and long-term holders are worried. Bullish investors expected ETH to break over $3,000 and confirm a wider cryptocurrency rise days earlier.
However, global turmoil has slowed markets. Israel's assaults on Iran and retaliations shook global markets on Thursday, causing crypto asset volatility and risk-off.
Historical trends between August 2021 and early 2024 suggest that keeping $2,500 has led to rallies reaching $4,000. Rekt believes Ethereum must maintain consistency around this zone to prevent a deeper retreat and maintain bullish momentum.
ETH has held $2,500 over five weeks, proving its stability despite numerous testing. In the weeks ahead, altcoins and the crypto market will depend on whether Ethereum can maintain this footing again.
Ethereum fell sharply from $2,830 this week to $2,556. On the daily chart, ETH has been rangebound between $2,500 and $2,830 for weeks. Ethereum has held above the 50-day and 100-day moving averages, which are rising, despite international threats.
The red 200-day moving average at $2,642 has provided resistance. A retracement followed ETH's short break above this level, which it failed to keep. Recent volumes have increased due to heightened attention and emotive price responses in the Israel-Iran conflict.
The $2,500–$2,520 support zone is important. This region has been a floor before and might rocket bulls if they recover control. A clear fall below $2,500 might turn sentiment negative and lead to $2,300.

BRIEFING Week #24 : is Stagflation Coming next ?Here's your weekly update ! Brought to you each weekend with years of track-record history..
Don't forget to hit the like/follow button if you feel like this post deserves it ;)
That's the best way to support me and help pushing this content to other users.
Kindly,
Phil

Weak Pullback, Bears in Control | Will the $100K Zone Hold? BTCUSD – Weak Pullback, Bears in Control | Will the $100K Zone Hold?
🌍 Macro & Fundamental Outlook
Bitcoin continues to face downside pressure after failing to hold above the key $108K resistance. Several macro factors are influencing sentiment:
📉 US bond yields are rising again, as markets expect the Fed to delay rate cuts. This adds pressure on risk assets like BTC.
🪙 Bitcoin Spot ETF inflows remain positive, but are currently not strong enough to counter short-term selling pressure.
💵 The DXY (US Dollar Index) is recovering, as investors flee to USD amid geopolitical volatility in the Middle East.
📊 Institutional liquidity is thinning across exchanges, adding to intraday volatility.
📉 Technical Analysis – H1 Chart
🔹 Trend Structure:
BTC is now firmly in a short-term downtrend, trading below the descending trendline and all key moving averages (EMA 34, 89, 200).
Rejection from every pullback suggests that sellers are still in control.
🔹 Key Price Zones:
Bearish FVG Resistance: 106,096 – 107,004
First Support Zone: 102,821
Major Support Zone: 101,539 → 100,419
A clean break below 100K could open the door to 98,000 and below
🔹 Momentum:
RSI is neutral, hovering around the mid-40s without strong divergence signals.
Selling volume is increasing but not yet explosive — indicating the market may be awaiting a macro catalyst.
🧠 Market Sentiment
Traders are currently in “wait-and-see” mode, eyeing the next round of macroeconomic data and potential Fed commentary.
Short-term profit-taking is dominant after last week’s sharp rally.
Overall sentiment: Bearish short-term – Neutral mid-term – Bullish long-term
🎯 Trade Setup Ideas
🔻 SELL if price retests FVG and gets rejected
Entry: 106,000 – 107,000
Stop-Loss: 107,500
Targets: 102,821 → 101,539 → 100,419
🔹 BUY if price reacts strongly from 100,419 – 101,500
Entry: 100,500 – 100,800
Stop-Loss: 99,800
Targets: 102,800 → 104,400 → 106,000
Preference is given to selling the rally in the short term. Buying should only be considered on confirmed reversal signals at key support.
✅ Conclusion
BTCUSD is currently in a corrective phase, with bears maintaining control. The key level to watch is the $100,419 support zone, which may determine whether Bitcoin maintains its medium-term bullish structure or breaks further. Discipline and confirmation are crucial in this volatile environment.
📌 Strategy Focus: Look to sell rallies toward resistance; buy only on confirmed bounce from strong support zones.

ANIME/USDT – Key Ascending Trendline Support Holding Pair: ANIME/USDT 💱
Timeframe: 1D 📅
Pattern: Ascending Trendline Test 📉
ANIME is currently testing a key ascending trendline on the daily chart. This structure has supported price action for weeks, and the current candle is sitting right at the trendline, suggesting a potential inflection point 🔍⚖️.
Bullish Scenario ✅
If the trendline holds and price rebounds with volume:
🎯 Target 1: 0.032
🎯 Target 2: 0.038
🛑 Suggested SL: below 0.023 (clean breakdown level)
Bearish Risk ❌
A confirmed close below the trendline could trigger a breakdown, potentially sending price toward the 0.020–0.018 support zone.
⚠️ Watch for strong reaction or volume spike — this is a decision point!

Solana - Your chance to be a millionaireThere is a 50/50 chance that we have topped...
The wave structure is very indicative of a completed impulse. However, i'm betting that we are just in a complex wave 4 and if this is the case, we should see a wave 5 taking out the high.
The risk to reward is pretty nice and playing spot will pay off.

Dogecoin Weekly, Bullish Update —1,2,3,4,5 SequenceJust to make sure we have a little bit of everything, here we have Dogecoin sandwiched in-between EMA34 and MA200.
» XRP is trading above these two levels.
» ADA is trading below.
» ETH is trading above.
» BTC is mixed.
Seeing DOGE in-between can reveal a few things.
No drama, MA200 will hold.
MA200 sits at $0.13822.
Notice the drop between December 2024 and March 2025.
Big red candles; straight down.
Notice the more recent drop, between early May and early June.
Small candles and a curve is starting to show already.
What I am gathering from all these charts is that the retrace only has 1-2 weeks left. I say 1-3 weeks just to play it safe, but it seems to be almost over, the bearish action.
Look at this 1,2,3,4,5 sequence.
1) The last peak.
2) The main low.
3) Initial breakout.
4) Retrace and higher low.
5) The next peak.
We are currently at #4. This means that we are set to experience a new wave of growth, "the next peak."
Thanks a lot for your continued support.
Namaste.

Cardano Weekly, UpdateCardano weekly doesn't look as good as XRP and Ethereum, this is true because I am using the same indicators.
Here we can see ADAUSDT trading below EMA34 and MA200. We can even see an attempt this week to move higher followed by a rejection, this means that there can be some more bearish action before higher prices but this bearish action can easily happen short-term. Why? Because Cardano has already been dropping for five weeks straight.
The rise from the 7-April low lasted a total of six weeks. The week that produced the peak is also the first week of lower prices. So we can say 6 weeks up and four weeks down, or, five weeks up and five weeks down.
The thing is that the market seeks balance and this retrace is already big enough and has been going long enough. Yes, the action is happening below these moving averages but this can easily change.
Short-term bearish.
» ADAUSDT will continue bearish as long as it trades weekly below the $0.7050 - $0.6875 price range. When ADAUSDT moves and closes above this range, the bullish bias is confirmed. Any trading below and we wait.
Thank you for reading.
Your support is appreciated.
Namaste.

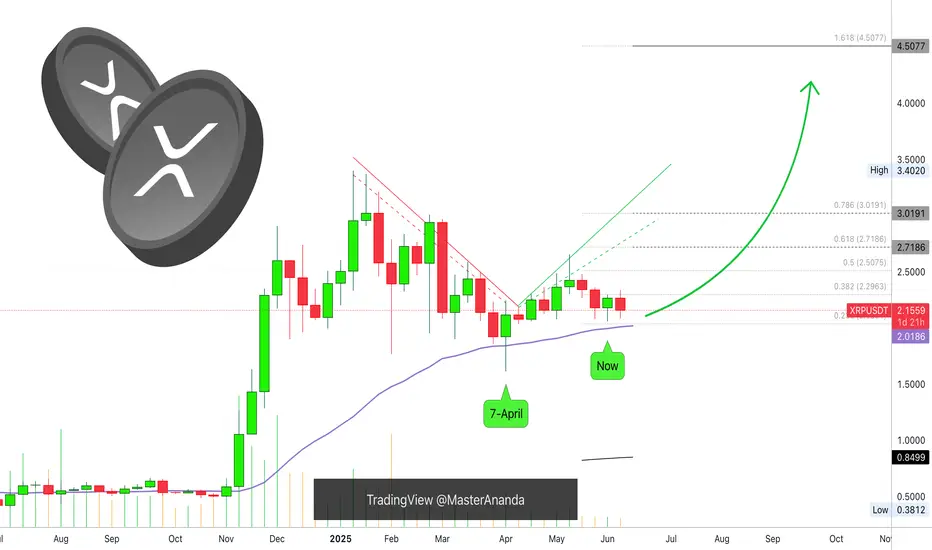
XRP Weekly UpdateThe line on the chart stands for EMA34. Notice two things about this level: 1) It was challenged 7-April but the action closed above. 2) The action "now" remains above this level but it has not been tested again, this is a bullish signal.
When it comes to the weekly timeframe, long-term, XRPUSDT continues bullish, with a bullish bias aiming higher. What we are seeing now is consolidation, accumulation, nothing changes and we can expect more growth.
Yes, the market shakes a little bit but this is the classic short-term noise. Zoom out, what do you see? You see just a few candles, red and green, but no change at all. The market is advancing to the side, after this side-advance, it will advance up; a bullish jump.
EMA34 sits at $2.01. We are strongly bullish above this level. We can expect growth in matter of weeks. Can be 1-3 weeks but it can also happen within days.
The retrace was small, consolidation has been going long enough. We are ready to start the next bullish wave.
Namaste.
Ethereum Weekly: Bullish & Bearish ExplainedEthereum has been sideways five weeks straight. Market conditions here are bullish and bearish short-term. Let me explain.
The market has bearish potential because of resistance. Ethereum has been facing resistance and fails to move forward for more than one month, but the bias isn't bearish, this is just a potential based on short-term price action.
The market has bullish potential because of a strong recovery after the 7-April low; because it trades above the August 2024 low and because there is very little retrace since the 5-May break of resistance in the form of EMA34 and MA200.
Ethereum is bullish because it trades above MA200 and remains above this level.
We are seeing bullish consolidation. There was an advance recently and after this advance the market went sideways. This means bullish.
While there can be a retrace short-term, market conditions remain bullish for this pair; ETHUSDT.
The bulls have the upper-hand and the majority of signals are bullish. Ethereum will continue to grow.
There is no scenario where Ethereum moves and closes weekly below its 3-Feb and 24-Feb lows ($2,075). It is simply consolidating before additional growth. It is going to go up, sooner rather than later.
Thanks a lot for your continued support.
Namaste.

PAXUSDT 4H Levels week ending 6/13/25Paxos Gold (PAXG) is a crypto asset backed by real gold reserves held by Paxos, a for-profit company based in New York. Each PAXG token is redeemable for 1 troy fine ounce of gold custodied in vaults by Paxos and its partners, and its market value is meant to mirror the physical gold it represents.
I'm looking for PAX to make a move towards the previous day high at the least.
