Terra Luna Classic LT Double-Bottom & 771% Potential ProfitsYou can say it is a long-term (LT) triple-bottom when taking into consideration the July-August 2024 support.
Terra Luna Classic (LUNC) has been reacting at the same level for years. Each time this strong support range gets challenged, what follows is a bullish wave.
» August 2023 marked the bottom of the bear market. And this produced a bullish wave.
» July-August 2024 marked the bottom of a correction and this produced a new period of growth.
» February-June 2025 is the present low and this too marks a market bottom, from this point on we will see so much growth. This support level is already confirmed and the action has been turning bullish. Here is what I mean.
A low in February 2025, a higher low in April and now a new higher low in June. LUNC has been growing from its base. This reveals what comes next.
When the market is bearish, these lows become lower and lower, by a significant amount. Instead, there is no bearish momentum, no bearish force, in fact, the bearish wave is over, we are seeing accumulation, four months of accumulation before a new wave of growth.
Hundreds of percentages of points up follow next. The chart shows 771% profits potential but there will be more, likely to be much more. This is the best time to buy, when prices are low. Comeback to this publication and see the results in October or November 2025. You will see the difference in price. Right now LUNCUSDT is trading at 0.00006066. In 4-6 months, prices will be many times higher. Wait and see.
Namaste.
Crypto

JITO Long-Term Accumulation Phase, Whales, Exchanges & 500% PPThe same market conditions prevail on this chart as with many other altcoins. The low is in. The low has been in for months, since 7-April 2025.
The advance has been happening very slowly and this is good. There will be a point where everything is up "out of the blue." No blue here, no surprise. When you see everything goes up 300% or 500% in a matter of weeks, remember that first the market was sideways for months.
This sideways period is the consolidation-accumulation phase and this phase is when the bulls amass strength. Whales are loading. It takes a while because liquidity is not strong on these pairs so it takes months and months for the whales to be able to inject hundreds of millions into the market. If all the money was injected in a matter of days or weeks, it would be chaos, that's why it takes time for a bullish wave to develop.
This phase can last anywhere between 3-6 months. Some pairs already moved ahead and produced some growth. This growth is corrected, it is just like saying, "Hey calm down, not so fast..." And the exchanges put selling pressure on the market to reduce prices so the whales have more time to accumulate. Retail is always anxious, whales are always patient.
Accumulation can only go for so long. It is like a pressure cooker. Pressure builds up and boom! There needs to be a release, the release here is experienced as a very strong wave of growth.
To be honest, the story is irrelevant, only one thing is relevant if you are here for profits, to make money, to trade; Buy when prices are low and hold. Wait patiently for prices to grow. Sell when prices are high.
Only one thing matters, entry prices and timing.
If you get the right price and the right timing, you will do great. We are witnessing a long-term accumulation phase. It is reaching its end.
Cryptocurrency will grow.
The Altcoins will grow.
Bitcoin is already too strong.
Patience is key.
Thanks a lot for your continued support.
Namaste.

AERO: Take Off!?If you find this information inspiring/helpful, please consider a boost and follow! Any questions or comments, please leave a comment!
Long Entry at $0.515
Recap
SPARKS:AERO caught a bid after Coinbase news hit, but world events quickly clipped the rally’s wings. Price bounced cleanly off the .48 level, which aligned with an Area of Interest (AOI), a Level of Interest (LOI), and a golden zone retracement displayed in the last analysis.
Explanation
The .48 level was key and the reaction was textbook. The Coinbase news provided a catalyst just as price reached the .55 level. However, macro uncertainty remains a headwind.
Now, all eyes are back on .55. Bulls need to defend this structural level. The current pierce of .75 is an encouraging move. Continuation and a proper flip of that level would keep confidence high. Wave 3s are a sight to see, so a retrace may not even occur if price simply sends. Still, while AERO stood up and moved counter to the broader market when world news dropped, that alone may not be enough if global bearish reactions continue.
Outlook
Entry projected in the previous analysis has played out in ideal fashion, but the market remains fluid. Key levels:
.75 recent break
.55 ideal hold
.48 impulse invalidation
Current trend at the lesser degree is up and holding higher lows. Next objective: take out the .80 pivot and change the trend at the higher degree.
Break of the higher lows at the lesser degree would be the first sign of weakness. I’m watching for a definitive correction for a potential long add. A swift move that breaks higher lows could signal danger to bulls.
Trade Safe!
Trade Clarity!

IoTeX 4 Months Bottom Consolidation, Time To GrowThis is one of the best types of chart setups, very low risk and a high potential for reward. Let me explain.
IOTXUSDT hit bottom mid-March, after this bottom, it has been consolidating bullish for more than three months. If we take the drop produced in early February as the start of the consolidation phase, we are talking about more than four months sideways, this is huge. Four months sideways simply means a very long and strong consolidation phase. The longer the consolidation phase the stronger the bullish wave that follows, and bullish is what is coming next.
Notice the higher highs and higher lows. Shy, small; slow and steady growth, but still higher since March. This reveals the broader bias and market trend. IoTeX is set to grow and it will produce a very strong bullish wave. It is only weeks away. Consolidation can only go for so long and it has been already more than four months.
This is an easy pair, an easy trade. Buy and hold.
Namaste.

UNI to the Mooni - Unleashing Banking into DeFi - Send itUniswap has powered trillions of dollars of exchange volume over the years, but, while its achieved economies of scale, it's been held back from mainstream use and value accrual due to the existing banking system's de facto and now uncovered to be de jure prohibition on interaction and SEC's systematic administration by enforcement campaign to destroy on-chain freedom of choice in the new digital exchange economy.
How big does it in the age of when the President of the USA has launched his own coin? Now that every bank in the world is about to "plug-in" to our Matrix?
Bigger than you can possibly imagine. That's the answer old boy.
But first, send it to $35.
That's a Livermore Accumulation Cylinder by the way

Bitcoin Cash Early Recovery & Bullish ContinuationToday's candle says it all. Bitcoin Cash moved to hit a low of $397, today, and the same session now trades at $449, the highest price since 23-May which was the date that produced the highest price since January 2025. This is an early recovery signal.
This signal is good and great but it needs one final bit to be confirmed, and that is a continuation tomorrow. The week is about to end and the close is what determines the next move. If the action closes above the 23-May high, $462, then ultra-bullish confirmed. If the session closes below then there is still room for some more shakeouts, retraces and corrections. But the early recovery signal is in. What one does, the rest follows.
Now, not all pairs will move in the same way. Some will continue lower, retrace, while some others produce an early recovery and move ahead.
Today's session is just too strong, we can easily say that Bitcoin Cash is ready to resume its bullish wave of growth. $684 next target, followed by additional growth.
Thanks a lot for your continued support.
Namaste.

Bitcoin (BTCUSDT) - Price Consolidating Inside Sym. Triangle - DBITCOIN (BTCUSDT) price has recently bounced up from above the 50EMA (yellow line).
Since May 2025, price has been consolidating sideways and has now formed a symmetrical triangle (blue lines). 10% to 20% volatility could be incoming for Bitcoin this summer.
The key resistance prices that Bitcoin has yet to breakout above are: $110000, $112000, $115000, and $120000+.
Support prices are holding at this time, such as $105000, $104000, $102000, and $100000, $95000.
If price holds above $100,000 to $105,000, there is still a chance that Bitcoin can continue to uptrend and rally higher this year in 2025.
However, if $100,000 price and support levels are lost, a new downtrend could occur and price could possibly test the 200EMA zone (red line).

Bitcoin At Resistance: OMG! Not Another 20X SHORT!Sell at resistance; buy at support.
Good morning my fellow Cryptocurrency trader, I hope you are having a wonderful day.
Being able to adapt to changing market conditions is one of the signs of being a great trader. Being able to spot changes on a chart is also indicative of someone that can produce great results in this and other markets. How are you feeling today?
It is no secret, we let everyone know; We sell when prices are high, we buy a lot when prices are low.
Bitcoin is now trading below its 20-Jan 2025 peak price. And it is also producing a lower high. Both bearish signals that are pointing to a lower low.
If the first drop settled around 100K, the second one should settle in the low 90s or right below 90K. It can go lower of course but we go step by step. I am not saying GO SHORT 20X again. This would only be possible for people who are smart, experienced traders and those that can take advantage of a changing situation without breaking their portfolio or long-term plans. Those can definitely SHORT this setup and profit short-term.
A trader trades, it is what he/she does. You sell when prices are high if a drop is incoming, you buy when prices are low if a rise is next.
This is a friendly reminder and it carries great entry prices and timing. Follow the chart.
Trading volume is super low as Bitcoin trades near resistance and this is one of the biggest exchanges in the world. Low volume at this point reveals a pattern of distribution, distribution means lower of course.
Both the MACD & RSI move on the bullish zone but trending lower, bearish at this point.
What will it be: Will Bitcoin move down next? Will Bitcoin move up?
My money is on down.
Leave a comment if you agree.
Thanks a lot for your continued support.
Namaste.

TRBUSDT on the Verge of a Major Move – Breakout or Breakdown?Yello, Paradisers! Is TRBUSDT gearing up for a bullish breakout, or is a deeper retracement coming? Let’s break it down.
💎TRBUSDT is forming an ending diagonal while showing bullish divergence, increasing the probability of an upward move. But for this bullish scenario to play out, we need confirmation.
💎If TRBUSDT breaks out and closes candle above the resistance level, the probability of a bullish move strengthens, setting up a potential wave 4.
💎However, if the price retraces further, we could still see a bounce, but given the broader market conditions, this would be a low-probability setup.
💎On the flip side, a breakdown and candle close below support would invalidate the bullish outlook, signaling that it’s safer to wait for a better price action structure before taking any positions.
🎖Remember, patience and disciplined execution are what separate winners from the rest. Stay sharp, Paradisers, and don’t let emotions dictate your trades!
MyCryptoParadise
iFeel the success🌴

HBARUSD: Final rally starting.Hedera is repeating the peak formation of the previous Cycle. Being bearish, almost oversold on its 1D technical outlook (RSI = 35.527, MACD = -0.005, ADX = 29.745) while being supported by its 1W MA50, makes it a buy opportunity again. We turn bullish, targeting the R1 level (TP = 0.39000).
## If you like our free content follow our profile to get more daily ideas. ##
## Comments and likes are greatly appreciated. ##

ETHUSD: This pattern always ends with massive rally.Ethereum has turned neutral on its 1D technical outlook (RSI = 50.794, MACD = 85.840, ADX = 26.701) as it's been compressed inside the 1W MA50 and 1W MA200 in the past month. The long term pattern here is a Megaphone - Broadening Wedge. Every Cycle formed one and historically once broken, it led to an enormous rally. We are still expecting the price to approach the top of this pattern on the medium term but if broken, you can aim for the 2.0 Fibonacci extension (TP = 11,000) if you want to pursue some risk.
## If you like our free content follow our profile to get more daily ideas. ##
## Comments and likes are greatly appreciated. ##


ETH ANALYSIS📊 #ETH Analysis : Update
✅As we said earlier, #ETH performed same. Now we can see that #ETH is trading in a bullish flag pattern and its a bullish pattern. We could expect around 10% bullish move if it sustain above its major support.
👀Current Price: $2555
🚀 Target Price: $2815
⚡️What to do ?
👀Keep an eye on #ETH price action and volume. We can trade according to the chart and make some profits⚡️⚡️
#ETH #Cryptocurrency #TechnicalAnalysis #DYOR

USD/CAD.1week chart pattern.It looks like me discussing a trade setup for USD/CAD with:
Sell Entry: 1.36200
Target Point 1: 1.23504
Target Point 2: 2.31000 ← This seems like a mistake
Let’s break it down:
---
🔍 Trade Analysis:
Sell at 1.36200: This is a reasonable short entry, near recent resistance (depending on current market context).
Target Point 1 (1.23504): This is plausible, as it's a historically significant support level — a good long-term take-profit zone.
Target Point 2 (2.31000): This appears illogical for a short (sell) position — it's higher than the entry price. If you're shorting, you profit from a decline, not a rise.
---
✅ Corrected Setup (Sell Idea):
Sell USD/CAD @ 1.36200
Take Profit 1: 1.30000 (medium-term support)
Take Profit 2: 1.23500 (long-term support)
Stop Loss: 1.37200 (just above recent highs)
Would you like a chart analysis or backtest of this strategy?

HolderStat┆BTCUSD local correctionBINANCE:BTCUSDT
→ Price coils between rising-channel mid-line & descending cap
↳ 108 k lid: clear it to unlock 112–117 k upper rail
⇢ Hold 105 k mid-rail to keep staircase intact
⤴ Drop < 104 k flips bias to 102 k base

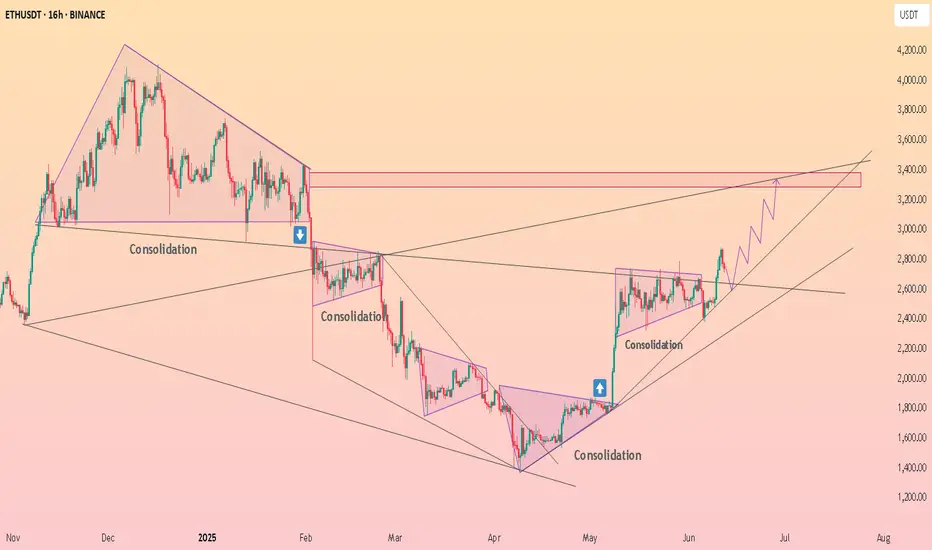
HolderStat┆ETHUSD above the consolidation zoneCRYPTOCAP:ETH
→ Basing above 2 400 while probing triangle apex
↳ Crack 2 550–2 600 for runway to 2 850–3 150
⇢ Trend guard sits at 2 650 → 2 500
⤴ Close < 2 650 drops Ether back into old range
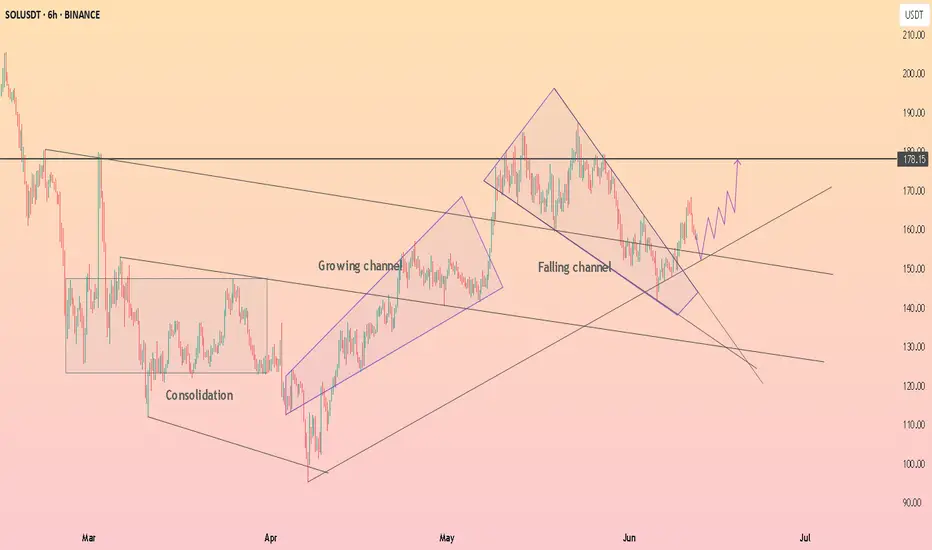
HolderStat┆SOLUSD exit from the formationBINANCE:SOLUSDT
→ Bounce off 150 trend-line fuels channel grind
↳ Reclaim 163–165 then pierce 180 cup-rim
⇢ Targets 190–195 upper rail, even 205+
⤴ Slip < 157 reroutes to 150 demand, < 148 turns bearish
HolderStat┆XRPUSD narrowing of volatilityCRYPTOCAP:XRP
→ Higher-low ladder pushes into falling-wedge roof
↳ Daily close > 2.40–2.45 = breakout to 2.55–2.65
⇢ Rising base holds at 2.10
⤴ Break < 2.10 opens 2.00–1.95 liquidity pit

HolderStat┆BNBUSD broke the local resistanceCRYPTOCAP:BNB
→ Coils above rising support 630–640 under 680 wall
↳ Pop > 680 ignites sprint to 700–720 supply shelf
⇢ Lose 630 downgrades to 600–610 retest
⤴ Sub-600 invites 580 deeper pullback

HolderStat┆ADAUSD above the $0.66 levelCRYPTOCAP:ADA
→ Climbs out of falling channel, presses 0.68 trend-lid
↳ Accept > 0.68 targets 0.72–0.75 → 0.80–0.85
⇢ Must defend 0.60–0.63 breakout shelf
⤴ Fall < 0.60 hands reins to bears aiming 0.58–0.55

#BERAUSDT #1D (Bitget Futures) Descending wedge on supportBeraChain printed a bullish hammer that may have marked a double bottom here on daily.
Reversal seems around the corner, revisiting 50MA & 100EMA resistances would make sense.
⚡️⚡️ #BERA/USDT ⚡️⚡️
Exchanges: Bitget Futures
Signal Type: Regular (Long)
Leverage: Isolated (2.0X)
Amount: 4.8%
Entry Zone:
2.798 - 2.558
Take-Profit Targets:
1) 3.345
2) 3.848
3) 4.350
Stop Targets:
1) 2.120
Published By: @Zblaba
CRYPTOCAP:BERA BITGET:BERAUSDT.P #1D #BeraChain berachain.com
Risk/Reward= 1:1.2 | 1:2.1 | 1:3.0
Expected Profit= +49.8% | +87.4% | +124.9%
Possible Loss= -41.7%
Estimated Gaintime= 1-2 months

SWARMS can be a double digit crypto again.Low risk entry level --- if we assume the bull still has legs.

USD/CHF,4h chart pattern..USD/CHF buy trade setup based on my input:
---
✅ Trade Setup:
Buy Entry: 0.81300
First Target (TP1): 0.82300
Second Target (TP2): 0.83500
---
📊 Trade Metrics:
1. TP1 Distance:
0.82300 - 0.81300 = 0.01000 (100 pips)
2. TP2 Distance:
0.83500 - 0.81300 = 0.02200 (220 pips)
---
🛑 Suggested Stop-Loss (if not defined):
A common approach would be to place it below the recent swing low or a round level for risk management. Example:
Stop-Loss (SL): 0.80800 (50 pips risk)
---
⚖ Risk-Reward Ratios (if SL = 0.80800):
To TP1: 100 / 50 = 2.0 R/R
To TP2: 220 / 50 = 4.4 R/R
---
Would you like a visual chart or technical breakdown (e.g., support zones, confirmation candles) for this pair?
