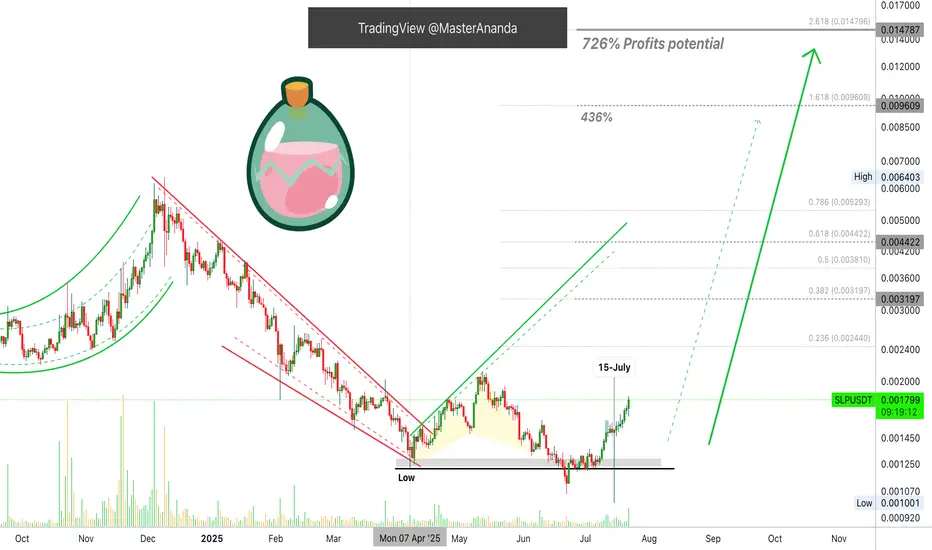
Smooth Love Potion 726% Easy Target & Technical AnalysisAs you already know the main low happened 7-April. It is always the same date but we are looking at a different pair so please, bear with me. Stay with me and continue reading because you are going to love the results. The technical analysis can be repetitive and that is only because I like to keep it simple using signals, systems and technics that work. I don't care about three hundreds indicators as long as the market moves in my predicted direction.
The low happened in April and then we have two challenges of this level, lower lows. In June two days closed below (black line on the chart) just to recover. There you have a strong bullish signal. A failed signal on the breakdown. Then again on 15-July there is a very long lower wick session and this is truly the most bullish signal ever. On this date there was massive selling and the action reached the lowest ever just to recover, the day closing green. When you see a candle like this, you know for certain and for a fact that the bearish move is done, not possible anymore.
Strong selling did happen, so strong that it created a major low—outside the broader marketwide pattern—but everything was bought within hours. Since all the weak hands, all leveraged positions, all stop-losses, everything was activated on that move, what is left is a bullish wave. There is no liquidity left on the downside so the market has to grow next, and this is exactly what is happening.
Now, very easy within months we can see 400% and even 700% growth. Of course, this will be far from the end. These targets are based on the daily timeframe. If we consider the long-term picture, Smooth Love Potion (SLP) can grow so much more. If you are interested in such numbers and projections, boost this post to let me know. If enough people want to see it I can publish a new chart with the new all-time high and beyond.
Thank you for reading.
SLPUSDT has been growing since June 22, an entire month. The price pattern is very similar to what I just explained on Toncoin, a major boom will develop in the coming weeks. It can be just a few days from now, say 2-3 days, or it can take a bit longer but it is getting close, so close, that you can obviously see pricing rising right now and the green candles are getting bigger... It will only get better.
Thank you for the love.
Namaste.
Crypto
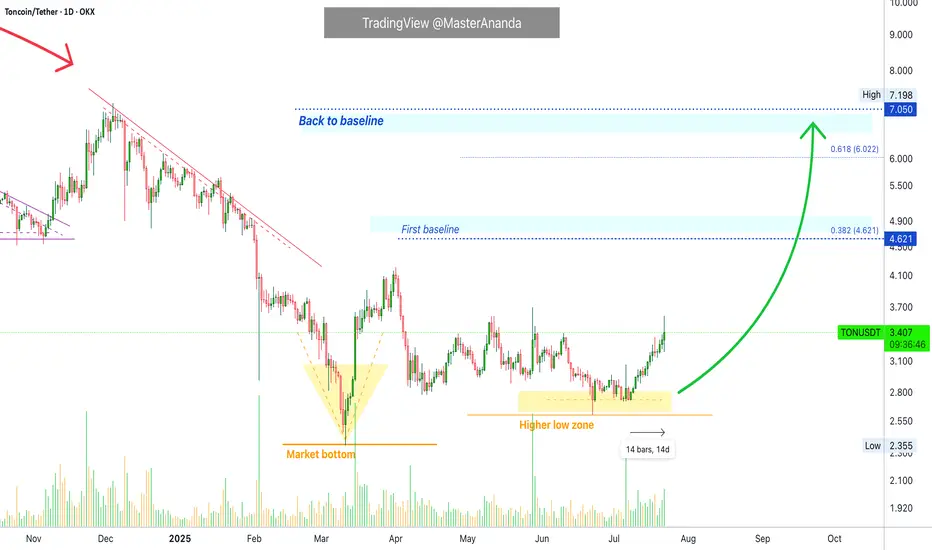
Toncoin Update · A Closer Look · Major Move in the MakingConsider this, Toncoin has been growing steadily for fourteen days straight. The growth is slow, steady and patterned, but it keeps on happening. Notice no strong sudden jump but still, straight up. This is how the bottom is missed.
At times, we buy and we are waiting for a sudden jump but this almost never happens. The way it works, in a bull market, we get a long drawn out build-up of bullish momentum. After weeks, or sometimes even months, of prices slowly rising, then we get the sudden jump. This is to say that we are getting close.
Toncoin will continue in this pattern for days, can be weeks or even months; but at one point, there will be a major advance producing such amazing growth. Consider Bitcoin Cash on the daily timeframe for an example.
There is one more thing we need to do but I will leave this for a different publication. We need to consider the true all-time high potential.
As you might be aware, we've been looking together at "conservative" and "easy" targets for the next high and bullish wave, we are leaving this approach behind. Now it is wise for us to consider 'true' potential, 'optimistic' and 'real' targets, the highest possible, etc. So we are going to be looking at how far up Toncoin can go in the coming years and months.
Your support is highly appreciated.
The action now indicates that a major move is in the cards for this pair. If you want to catch one of those waves where you see +100% or +200% within weeks, you can sit on your TON tokens, this will be it.
It is going to happen but keep in mind that patience is key.
After you buy you hold, wait long and the market takes care of the rest. The wait is worth it when you consider the amazing profits and results that can be achieved. You deserve the best.
Keep going; keep in insisting; keep trying, keep learning, keep pushing, keep growing. We are going to achieve our goals. If you stay around long enough, the market will give you exactly what you want.
Money? peace of mind? More time to do the things you like?
Not having to leave your home to work? It is possible with Crypto.
Thanks a lot for your support.
Namaste.
ankr short trade in my opinion this is a good trade with a good r/r hope hit the tp consider this is my trade not your trade and i just like to share my trades with world

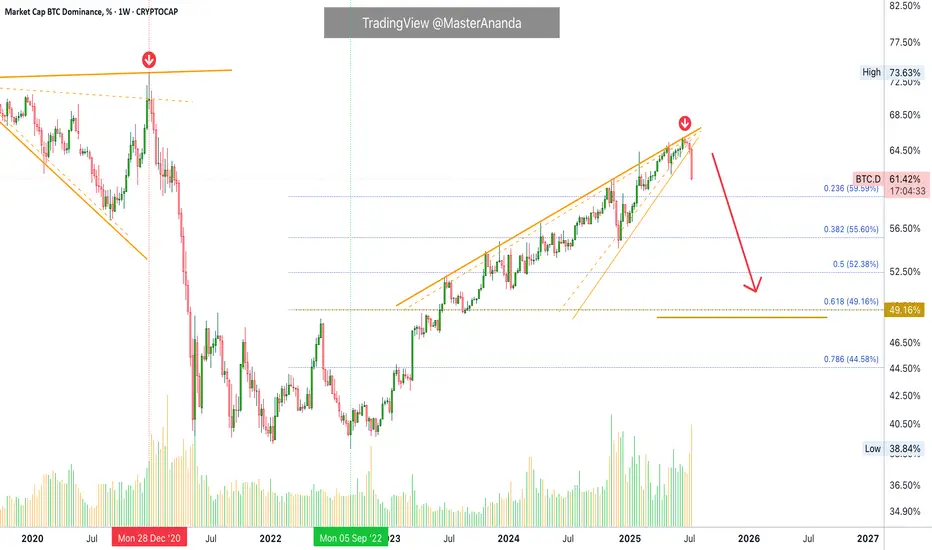
Bitcoin Dominance Weekly · Highest Bearish Volume in YearsThis week Bitcoin Dominance Index is producing the highest bearish volume session since February 2021. More than 4.5 years.
This week we have the strongest bearish action since June 2022. We can say that the altcoins market bull market is not only fully confirmed but already underway. We are already experiencing the best altcoin season since 2021 but it is still early, this is only the start.
Bitcoin Dominance is set to produce the strongest drop in many years and this only happens when the altcoins go ultra-bullish.
Bitcoin is moving sideways right now near resistance. As Bitcoin does this, the altcoins continue to move forward. This is classic bull market dynamics. When Bitcoin consolidates at a high price, the altcoins tend to explode. You can expect this pattern to continue to repeat for months to come. There is more good news though.
The fact that the altcoins are growing, perfect examples right now are Ethereum and Litecoin, is a bullish signal for Bitcoin.
It is not like the altcoins will grow and then Bitcoin will drop, no. Bitcoin consolidates and the altcoins grow, when Bitcoin stops consolidating it will move forward and hit a new major high, that is a price just around $134,000 and $136,000. When Bitcoin hits this price the altcoins continue to grow, back and forth. This is the most bullish the market has been since 2021. We will have to wait and see where this will all lead but new all-time highs are expected across all major projects and then some. Bitcoin is already in new all-time high territory but we need a new all-time high on Solana, Litecoin, Ethereum, Cardano, and so on. XRP is already at a new all-time high but it has much more to give.
If you visit @MasterAnanda, you will find up-to-date analyses for all these altcoins with new updated not conservative but realistic and good optimistic targets.
I will continue to share updates throughout the entire bull market. This is only the start. Get ready because the best is yet to come.
Namaste.
Ethereum to $8000On the monthly chart, Ethereum has reached major resistance at $3,800 again and, in my opinion, can break through this time. This is the final leg to $8,000 soon.

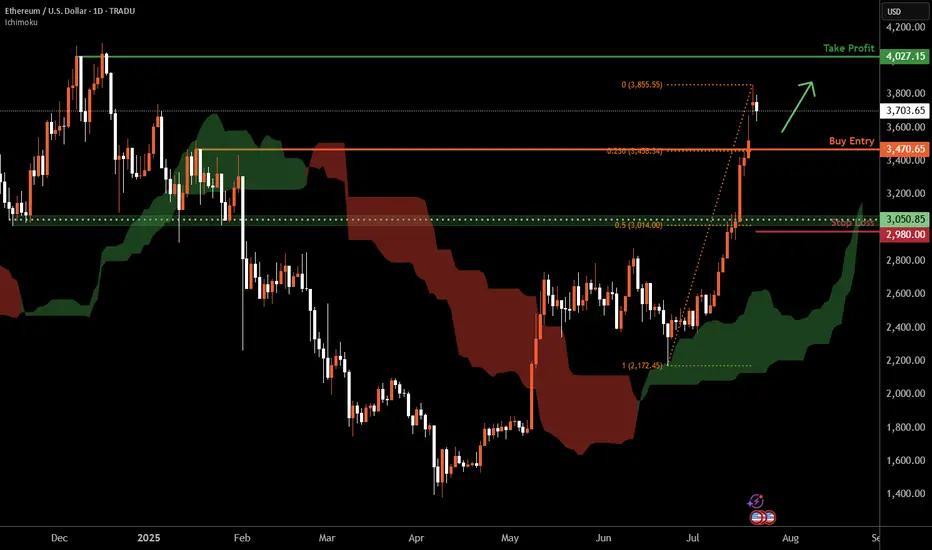
Ethereum D1 | Potential bullish bounceEthereum (ETH/USD) is falling towards a pullback support and could potentially bounce off this level to climb higher.
Buy entry is at 3,470.65 which is a pullback support that aligns with the 23.6% Fibonacci retracement.
Stop loss is at 2,980.00 which is a level that lies underneath a a pullback support and the 50% Fibonacci retracement.
Take profit is at 4,027.15 which is a multi-swing-high resistance.
High Risk Investment Warning
Trading Forex/CFDs on margin carries a high level of risk and may not be suitable for all investors. Leverage can work against you.
Stratos Markets Limited (tradu.com ):
CFDs are complex instruments and come with a high risk of losing money rapidly due to leverage. 66% of retail investor accounts lose money when trading CFDs with this provider. You should consider whether you understand how CFDs work and whether you can afford to take the high risk of losing your money.
Stratos Europe Ltd (tradu.com ):
CFDs are complex instruments and come with a high risk of losing money rapidly due to leverage. 66% of retail investor accounts lose money when trading CFDs with this provider. You should consider whether you understand how CFDs work and whether you can afford to take the high risk of losing your money.
Stratos Global LLC (tradu.com ):
Losses can exceed deposits.
Please be advised that the information presented on TradingView is provided to Tradu (‘Company’, ‘we’) by a third-party provider (‘TFA Global Pte Ltd’). Please be reminded that you are solely responsible for the trading decisions on your account. There is a very high degree of risk involved in trading. Any information and/or content is intended entirely for research, educational and informational purposes only and does not constitute investment or consultation advice or investment strategy. The information is not tailored to the investment needs of any specific person and therefore does not involve a consideration of any of the investment objectives, financial situation or needs of any viewer that may receive it. Kindly also note that past performance is not a reliable indicator of future results. Actual results may differ materially from those anticipated in forward-looking or past performance statements. We assume no liability as to the accuracy or completeness of any of the information and/or content provided herein and the Company cannot be held responsible for any omission, mistake nor for any loss or damage including without limitation to any loss of profit which may arise from reliance on any information supplied by TFA Global Pte Ltd.
The speaker(s) is neither an employee, agent nor representative of Tradu and is therefore acting independently. The opinions given are their own, constitute general market commentary, and do not constitute the opinion or advice of Tradu or any form of personal or investment advice. Tradu neither endorses nor guarantees offerings of third-party speakers, nor is Tradu responsible for the content, veracity or opinions of third-party speakers, presenters or participants.
12R setup forming on SUITime to send it after that big channel retest? Clean 12R setup
Entry: 4.0
SL: 3.9
Target: 5.2

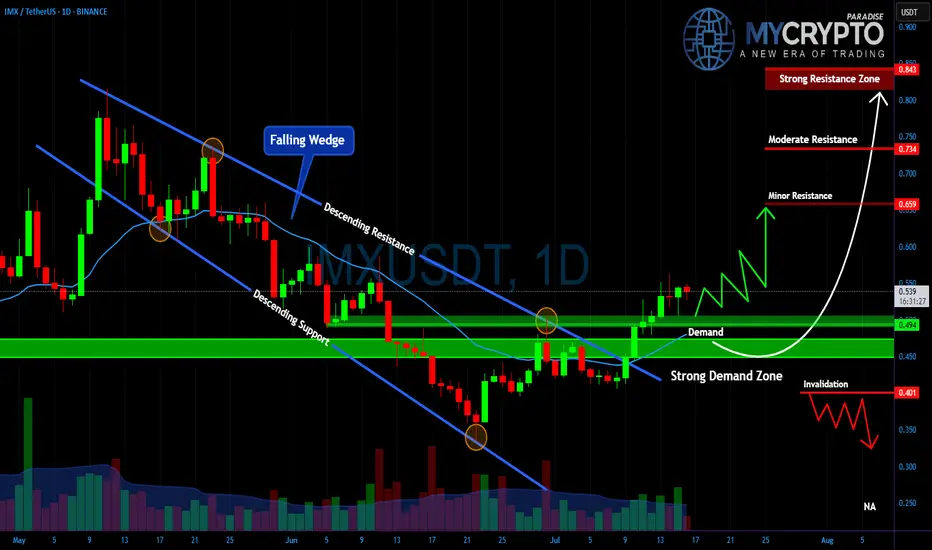
IMXUSDT – Major Breakout or Another Painful Trap Ahead?Yello Paradisers, is this the real start of a powerful bullish reversal on #IMX, or just another classic setup to liquidate impatient traders before the true move begins? The next few days will decide everything.
💎#IMXUSDT has broken out of a falling wedge, which is a typical bullish reversal structure, and is now retesting the strong demand zone between $0.45 and $0.49. As long as the price holds above this level, the bullish scenario remains intact, with $0.659 as the first key resistance to watch.
💎A clean break above $0.659 could open the way toward $0.734, while the critical resistance zone at $0.843 will be the ultimate test of whether IMX can shift into a sustained uptrend.
💎However, the invalidation level sits at $0.401. If this level fails, expect a fast move back toward $0.30, which will likely wipe out many traders who jumped in too early.
This is exactly where most retail traders get trapped. They either chase the move too late or panic-sell too early.
MyCryptoParadise
iFeel the success🌴
ETHEREUM Resistance Ahead! Sell!
Hello,Traders!
ETHEREUM is trading in a strong
Uptrend and the coin has grown
By more than 70% since the last low
So the coin is locally overbought
And after it retest the horizontal
Resistance of 4100$ we will be
Expecting a local bearish correction
Sell!
Comment and subscribe to help us grow!
Check out other forecasts below too!
Disclosure: I am part of Trade Nation's Influencer program and receive a monthly fee for using their TradingView charts in my analysis.

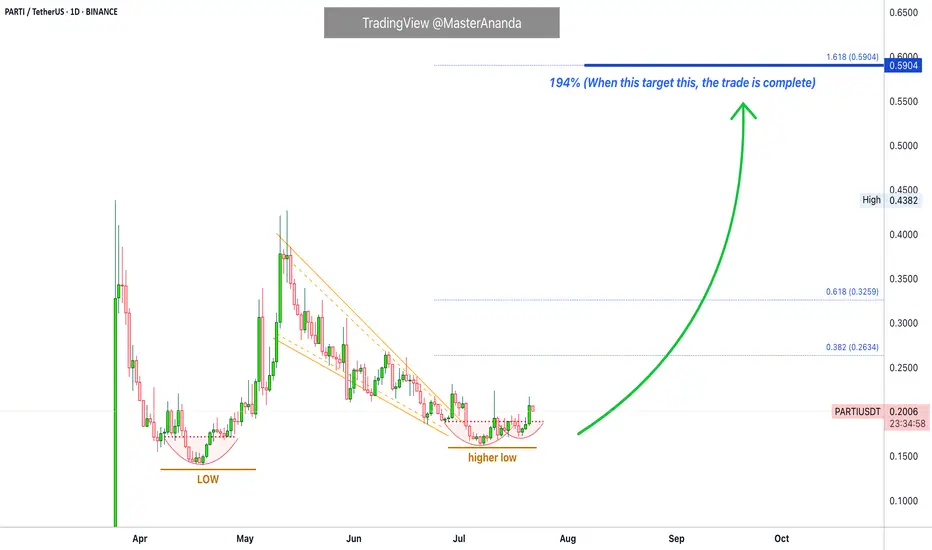
Particle Network Short-Term Trade Setup @194% Profits PotentialHere is the thing, the young charts we are using for the short-term trades, and this makes sense because we can't make much of a long-term prediction with no data ok?
Let's trade!
Basic and simple. I can't do it any other way so you will see me repeating the same. The truth is that simple works. If you can't explain something in a simple manner, it simple means you don't understand it well enough. Well, I understand this thing nicely because I will make it so simple for you, that you have to agree and even a three year old can say, "True, Master is right, I agree with his interpretation of the chart."
Low and higher low. Beautiful.
A bullish wave leads to a correction. The correction ends in a higher low. This confirms the bullish bias. The higher low is the place that will launch the next leg up. Minimum target is always the 1.618 Fib. extension. This is mapped on the chart as 194%, once it hits, the trade is closed and over. Take the profits and move on.
Thanks a lot for your continued support.
Thank you for reading.
Namaste.
Adventure Gold 679% Easy Target, High Profits & TA (8X Lev)I can translate all of the signals and all the chart data but the truth is that "bullish" because that is what the chart is screaming to me. The chart is saying "bullish" and my intuition is telling me that Adventure Gold (AGLD) is going to move next.
Notice I continue to pick the ones trading low near support. Those trading within the "opportunity buy zone" for our trades. When it comes to those already moving, I only give updates. When it comes to buying and trade-numbers, I choose the ones with low risk vs a high potential for reward.
AGLDUSDT has been closing green four weeks slowly rising, but prices remain very low. This is a bullish type of consolidation. It is a tricky signal because it might look weak but the truth is that this pattern tends to transform into a bullish explosion. The choice is yours.
I give you the chart, the translation, the basics, the training, the learning, the entertainment, the inspiration. I give you peace of mind and the right price. You have to take care of the rest. I can show you the door, but you have to cross it. You have to buy and hold, and be ready to sell when prices are at resistance or near resistance where I show in these charts.
We are a team. It is a huge sacrifice to be able to read the charts without losing focus, without going crazy due to all the distractions, all of the attacks and all of the stress. I have to develop a Buddha kind of meditative mind to be able to keep up and give you only the best. You know I can do it because I've been doing it, the results will speak for themselves, but is it not easy. I have to give my life for these charts and this market, but it is worth it if you take action and use this information to achieve your goals and financial success.
Thank you for reading. We are in this together.
I love you, truly. We've been together for so long, and this is only the start.
Namaste.

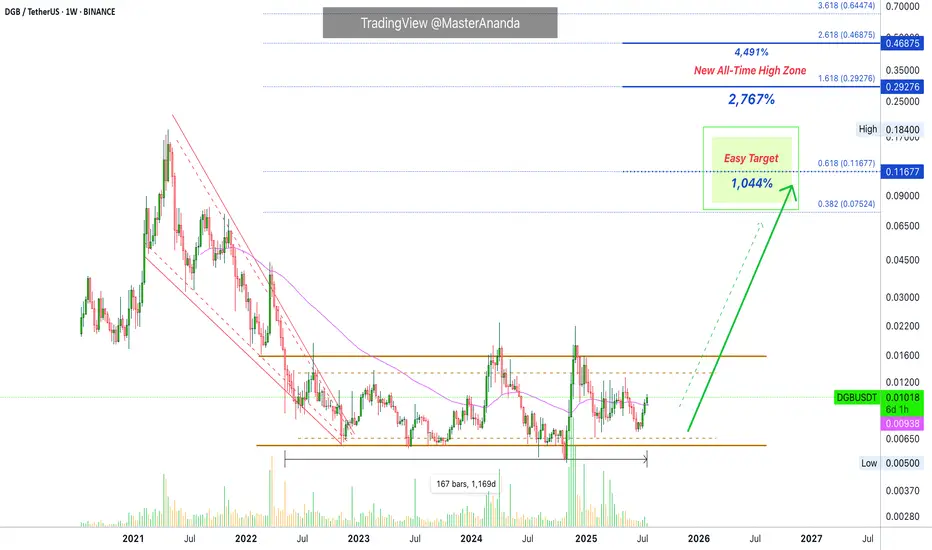
DigiByte Update · Optimistic New ATH · 1000%, 2800% & 4500%I will explain everything. The technical analysis, why I believe DigiByte can grow beyond 2,700%, and the overall Cryptocurrency market conditions.
Good evening my fellow Cryptocurrency trader, I hope you are having a wonderful day.
First, let me tell you that DigiByte (DGBUSDT) is fully bullish confirmed based on technical analysis. In simple terms, the action is happening above EMA55 weekly and we have higher lows since November 2024 and three weeks closing green.
Since there are now new lows in 2025, this clearly shows a lack of bearish trend. There is no bearish trend but neither a bullish trend, the market has been sideways. DigiByte has been sideways now for 1,169 days. And this is the reason why a new all-time high is possible in this year and bullish cycle. This is simply the strongest consolidation phase ever in the history of this market.
A 1,044% target at $0.116 is very easy indeed and should be hit without a question. But the fact that the market has been neutral for so long opens the doors for a massive bullish cycle and this is why we are aiming higher. Just as a new all-time lows can be hit within a bearish period, new all-time highs can be hit within a bullish cycle. Consider $0.29 or higher.
Just consider inflation, how much the world changed in the past four years. All the advances when it comes to regulations and acceptance towards this market. A new all-time high is only logical and easy to conceive. It is also supported by market sentiment, marketwide action and technical analysis.
DigiByte will not stay behind. It will surely perform just as you expect or even beyond. The Cryptocurrency market tends to surprise, it always go beyond our expectations.
Thanks a lot for your continued support.
Namaste.
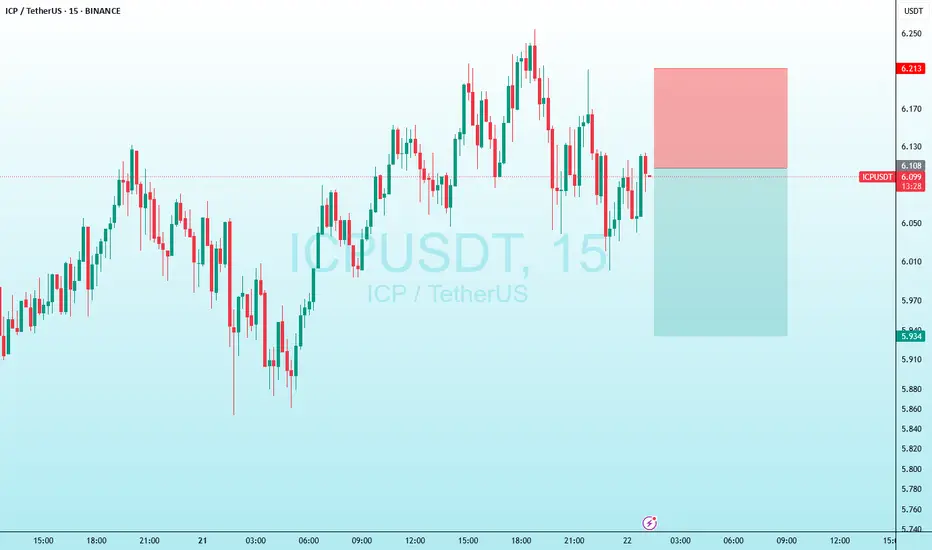
icp short tradein my opinion this is a good trade with a good r/r
hope it hit the target
consider this is my trade not your trade and i just like to share my trades with world
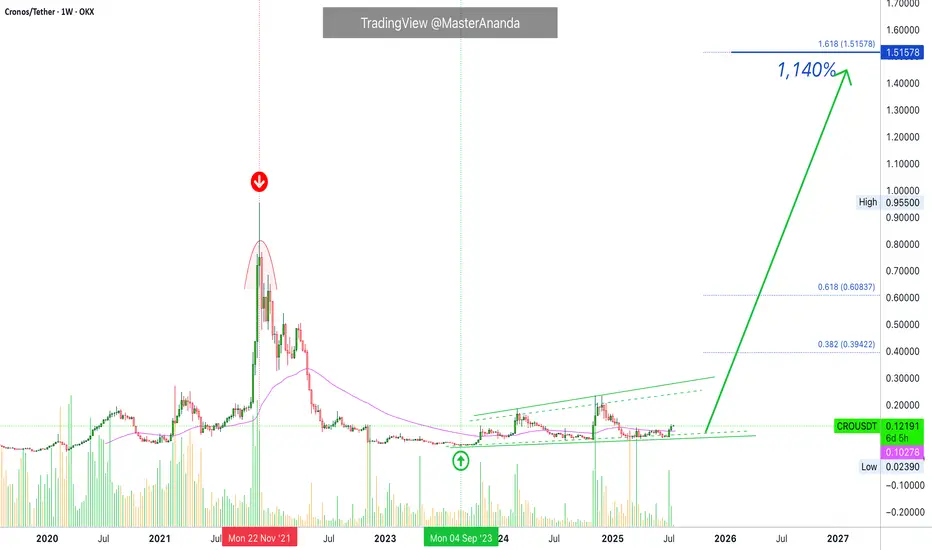
Cronos 2025/26 New All-Time High Revealed · PP: 1,140%Cronos has all the classic signals ready, confirmed and combined. RCC. And this opens the doors for a major advance which will not be shown fully on this chart. That is because I am using the linear chart for perspective but the log chart is needed to see all the major targets. Just trust, it is going to move very high in this bullish cycle run.
Good afternoon my fellow Cryptocurrency trader, I hope you are having a wonderful day.
Didn't I told you that you would see so much growth, that you will become complacent at some point? We are not there yet, but we will get there and you will have new challenges to face. Believe it or not, taking profits, using your earnings, will be one of the hardest things to do but the only right choice. A win is only a win when you close when prices are up.
Just as you cannot incur a loss unless you sell when prices are down; you cannot secure a win unless you sell when prices are up. When a pair grows 1,000%, you should take profits, period. When a pair growths 500%, it is wise to secure, 10%, 20%, etc. A plan is needed to achieve maximum success.
How you approach the market will depend on your goals, your capital, your trading style, which projects are available to you in your home-country, and so on.
A long-term investor does not need to sell, can continue to buy, accumulate and hold for a decade or more. Can you see? Each strategy is dependent on the person behind it.
CROUSDT · Trading weekly above EMA55 while still near the bottom. The bottom is revealed when we compare current candles size and location to the 2021 high price.
Last but not least, notice how each time there is a strong increase in trading volume the weekly session ends up closing green. Bullish volume is dominating this chart. A long-term accumulation phase.
Without further ado, the next and easy all-time high target is $1.51 but it can go much higher. Total profits reaching 1,140%.
Thank you for reading.
Namaste.
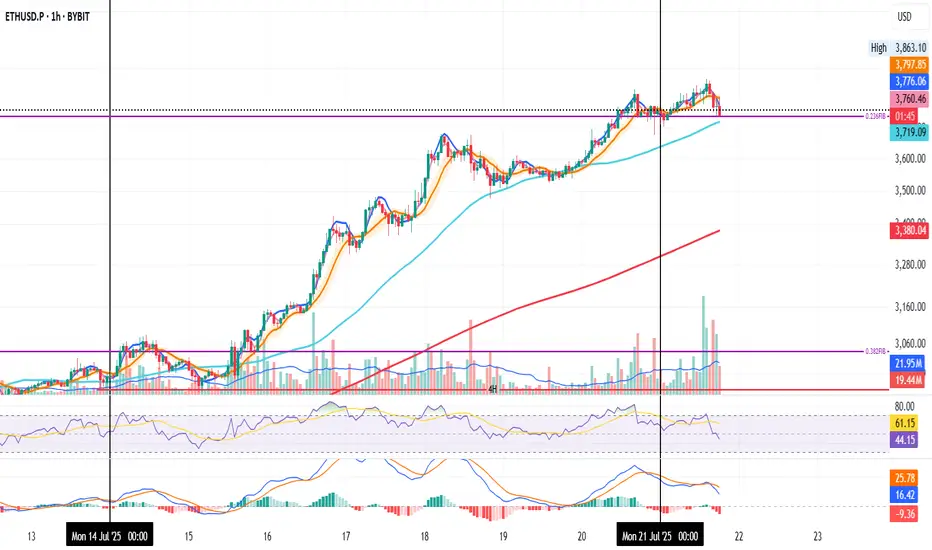
ETH on the 1H and the 0.236 Fib level
Could be a retest. Could be a fakeout. Could be the start of a move down.
RSI and MACD are both dropping.
SMA < MLR < BB Center confirms a downtrend.
50MA is sitting below the Fib level.
200MA is far below at $3,400, but rising quickly.
If tonight’s candles start closing under the Fib level, the warning gets louder.
If not, more upside remains likely.
Always take profits and manage risk.
Interaction is welcome.
$UNI - $10 from here?Hi guys! 👋🏻
🔔I'll be trying this setup for Uniswap
🔔 We have bounced from the strong support at $4.80, which we retested in April 25 and May 7 forming a pattern impersonating a double bottom
🔔 With the current chart pattern and levels, I'll be expecting a jump with a target on $10.
🔔 Might drop to $5.70 before another move upwards.
✊🏻 Good luck with your trades! ✊🏻
If you like the idea hit the 👍🏻 button, follow me for more ideas.

BTC Update – Short-Term Pressure Building
Bitcoin is still being pushed down below the BB center.
RSI is trending lower, and MACD is nearing a bearish crossover.
PSAR is hovering close to price, a warning sign.
This could still be a pause before the next leg up — but don’t ignore the signs.
And just a thought: Trump Media buying $2B in BTC might’ve marked a local top.
Prepare in advance.
Always take profits and manage risk.
Interaction is welcome.

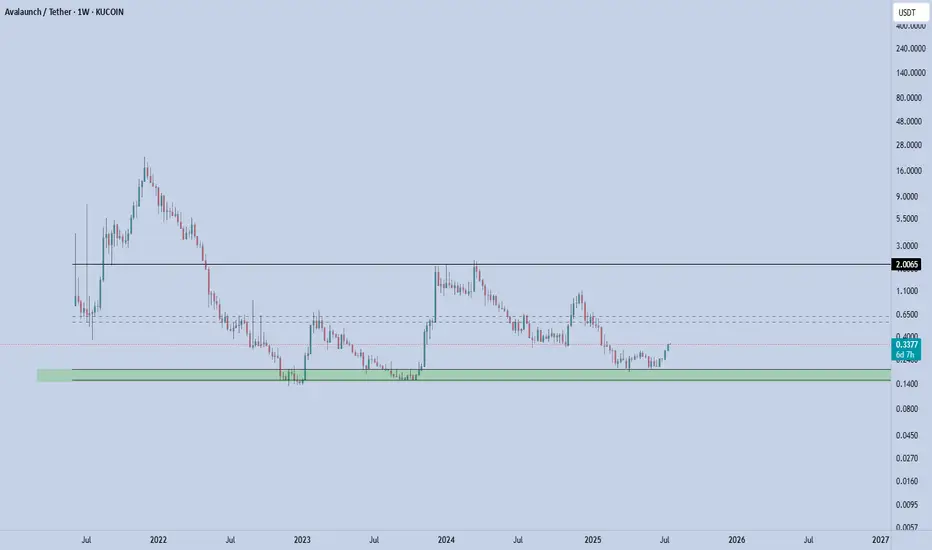
XAVA - Rebound in Play XAVA coin is currently stabilizing in a key support zone — the bottom of the defined channel, which has proven to be a strong and reliable support area. Price recently bounced from this level, confirming buyer interest.
From here, the next immediate target is the mid-range of the channel. If price manages to break above and hold the mid-channel, the next upside objective becomes the top of the channel.
Key Levels
Support (Channel Low): 0.15(invalidation below this level)
First Target (Mid-Channel): 0.56-0.62
Second Target (Channel High): 2
📌 Risk Management: A clean break below 0.15 invalidates this setup. As long as this level holds, the structure remains constructive and favors rotation toward higher levels within the channel.
luna long positionin my opinion this is a good trade with a good r/r
hope hit the tp
consider this is my trade not your trade and i just like to share my trades with world

UMA · $6.65 Easy Target · Much Higher Possible Late 2025 · 1220%$6.65 is actually a very easy and conservative target. We tend to cap profits potential when we approach the market using leverage. When doing spot, we get all the targets all the way to a new all-time high—price discovery—and beyond.
Here we have a very strong bullish chart setup. Consider this. When the action recovers above long-term support we know this to be bullish. I just mentioned this signal on APEUSDT.
UMAUSDT moved below not only August 2024 but also October 2023. It has recovered, it is trading back above both levels and this is truly as good as it gets. We can see a break above EMA55/89 (3D sessions) coupled with rising volume and very, very strong full green candle. This type of action reveals the start of a major bullish advance.
I think UMA can easily hit $10, $17 and $23. Somehow I am getting the feeling that $23 will not be the end of the bull market for this pair. Which means that it can go higher... We will have to wait and see of course. Growth potential is always unlimited. There is no limit to the upside. Anything can happen. We are open to see maximum growth in the coming months. The strongest bullish cycle in the history of Crypto.
Thanks a lot for your continued support.
Namaste.

Solana About To Gain Bullish Momentum Towards $420, Later $1000+It seems like Solana has been taking forever to grow, to recover; it seems like a long time. Let's do some maths. The bottom was in 7-April and we are now on July 21. 98 days. A little over three months. That is how long it has taken Solana to move back above $200. Seeing that the all-time high is $295, this isn't a long time, we are getting close to resistance and this resistance will break easily just as it happened with Bitcoin. Solana is set to grow to $420 mid-term and this bull market is likely to give us a target of $620 and potentially $1,000. $1,000 is the bright spot we want to hit on the bull run phase.
Why aim so high? Because the correction was really small in comparison to Solana's major bullish cycle since 2022. Solana crashed and crashed really hard but this hard-crash led to the strongest bullish cycle ever. Only in January 2025 did Solana stop too breathe and it did so by doing a 60% drop-market flush. With this drop over, Solana can produce the continuation of its long-term, eternal bullish cycle. Higher and higher, week after week, month after month.
If you are a Solana holder I just want to tell you to be patient on this pair. All the gains that have not been done in the past will be fulfilled in a matter of days. Solana will catch up with the rest of the giants and grow strong. Once Solana is up there at a new all-time high, the rest of the market will continue to grow.
Think of Solana behaving just like Bitcoin; when it reaches high up, instead of crashing we can experience some consolidation followed by additional growth. When we are close to the true cycle top, money will flow out of these big projects into the smaller ones, creating a major bull run.
All is good and perfect and it is early still today. Think about it, would it be late to buy below $200 when you know the potential is 1K?
Thanks a lot for your continued support.
Namaste.

Apecoin Technical Analysis · New All-Time High & Easy TargetsAs I told you just recently, the moving averages can be used in different ways. The main way is to gauge the market bearish or bullish potential and this is the classic way. The second one, less conventional, is to know how advanced is a trading pair within the current cycle.
Before everything was growing, we would confirm a pairs bullishness by looking at EMA55, EMA89, EMA144, MA200, etc. But now that we have a confirmed bullish bias, we can use these same moving averages to see how much room there is left for growth. For example, here APEUSDT is trading below EMA55 weekly. This is great news. This reveals to us that this pair is still early. As we know the entire market will move upwards based on the classic four years cycle—a bull market every four years, or the fact that a bull market happens the year after Bitcoin's halving—catching a pair before a major breakout can be life changing, profits can be huge.
But we still need some bullish signals though so let's look at those. Apecoin moved below its August 2024 market bottom. This is bearish. Once the action is happening back above this long-term support level the bullish bias is confirmed. Currently, APEUSDT is trading above its August 2024 low.
Another good and strong bullish signal is the classic rounded bottom pattern. On the 7-April low a rounded bottom pattern formed to produce a reversal. Notice how the trading volume is much lower on the last low compared to previous action. If the market was set to continue lower long-term, the lowest point would have high volume. Lower lows with decreasing volume signals that the bearish trend is losing force. This is already confirmed here because Apecoin produced a higher low in June and has been closing green several weeks.
Technical analysis coupled with marketwide action. Apecoin is set to grow strong long-term.
Thank you for reading. I hope you find this information to your liking. I hope you make tons of profits in this bull market cycle and fulfill all of your goals. You are appreciated.
Namaste.

Ethereum: Breakout Holds Strong | Next Targets $4K, $7K+Last week, three major crypto bills cleared the U.S. House of Representatives—and Ethereum (ETH) is emerging as the biggest winner from this legislative momentum.
ETH recently broke out of a rounding bottom pattern and hasn’t looked back. Momentum continues to build, and it’s now outperforming most other major assets.
📈 Technical Highlights:
✅ Short-term target: $4,000
✅ Long-term potential: $7,000–$8,000
🛡️ Key support: $2,700–$2,800 (bullish as long as this holds)
📣 Takeaway:
Ethereum’s breakout remains intact. Pullbacks into support could offer high-probability setups for swing traders and long-term investors.
#Ethereum #ETHUSD #Crypto #Trading #TechnicalAnalysis #CryptoTrading #EthereumPrice #Altcoins #Bullish #Breakout
