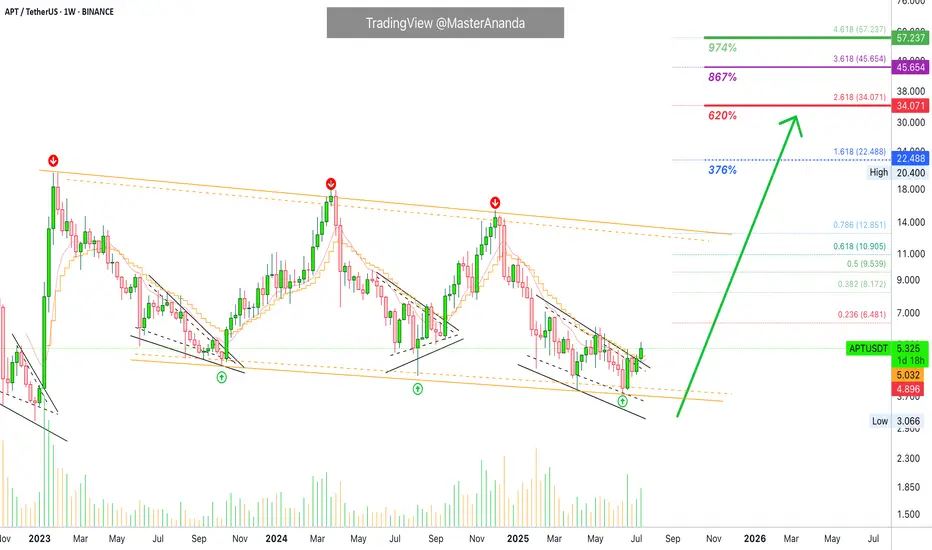
Aptos Bullish Bias Intensifies · Moving Above 2 EMAs WeeklyLast week APTUSDT (Aptos) closed above EMA8 and this week it is trading, and set to close, above EMA13. The bullish bias is becoming stronger; notice the bullish reversal pattern in black. Each time this type of pattern showed up Aptos turned bullish. This is the fourth time and it won't be different. It will be different only in the sense that the long-term consolidation descending channel will break. Instead of resistance being found and confirmed at the upper-boundary of the channel, APTUSDT will produce a new high, a higher high and a new all-time high. You are witnessing the start of the 2025 bull market cycle. Growth potential goes beyond 800%. Total growth from bottom to top can reach 1,000% or more.
Thank you for reading.
Namaste.
Crypto
Ethereum · No Reason To Stop · Will Continue RisingEthereum will continue rising. Remember Ether is number two and it is awesome, to start, and it follows Bitcoin like darkness follows the light. There is no reason for Ether to move down. There is no necessity for ETH to stop its major advance, in fact, it has been lagging behind and it needs to catch up. Bitcoin is waiting and will continue waiting but it won't wait forever so Ethereum must wake up and is waking up. We are going up.
Ethereum has grown 165% since its 7-April low. This is more than XRP and its capital is twice as much. Boom! The best part? Ethereum will continue growing straight up for weeks and months. It needs to be trading at a new all-time high as soon as possible just so that the market can feel at ease and know, once again, that Crypto is here to stay.
What has been suppressed can't stay suppressed forever. Crypto went through a fight but challenges only made us that much stronger. We are now happy and grateful for everything that we went through because we know that we can take anything the world throws at us.
The chart. Green, green, green straight up. Two months of consolidation. That's the key. ETHUSDT went sideways for almost two months and this reveals what comes next. The advance outside the consolidation range has been happening for 8 days. 60 days of sideways can support at least an entire month of growth. When the entire month is consumed, we can expect a retrace, nothing more, followed by additional growth.
In short, Ethereum will continue rising. If you see a shakeout, know that growth will always resume in a matter of days. If you see a drop, know that this is a bear-trap, the bulls now own the game. If you are in doubt, come read my articles and I will publish something that you will understand and agree is right, so you can continue holding until you can reach the big prize.
The time to sell will come, but it isn't now. Right now is the time to hold strong. Not only Ethereum, but Cardano, XRP, BTC, Dogecoin, Solana and the rest of the altcoins. This is only the start.
I expect Ether will continue rising. $8,000 now looks like such an easy target...
Very good indeed. If you enjoy the content, follow me.
Namaste.

Cardano Update · What Happens Now?I am going to assume that you read the XRP update I just published. While these are different pairs, my updates and publications are all related because I look at the entire market—for you—as a unit.
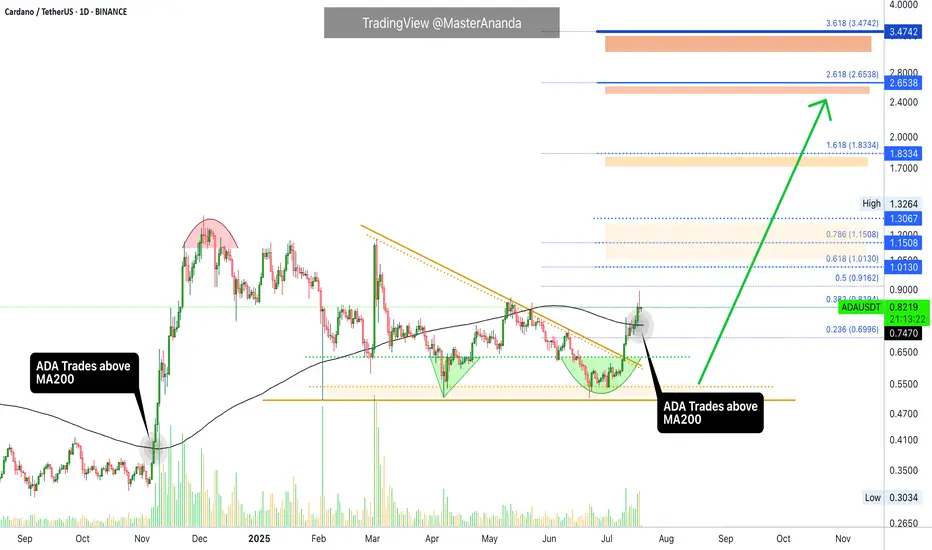
The situation with Cardano is different to XRP. Why? Because XRP already broke its previous bullish wave high while Cardano hasn't. This first tells us that Cardano has more room for growth and has less risk from a buyers standpoint. It can also be seen as Cardano being weaker or lagging behind in someway but I wouldn't give credit to this interpretation. The truth is that the market moves in unison but not at the exact same time.
May's high, reached first from the 7-April bottom, has been challenged but confirmed as resistance. This won't last long. It has been confirmed as resistance and we can easily see it by yesterday's red candle. This is normal. If you look at 14-July and 12-July, these days were also red yet Cardano continued growing. You can expect the same.
We can have one day red, two red days, three red days and nothing changes. The market is set to grow, is growing and will continue to grow in the coming weeks and months. Long-term growth and even beyond months. There is the possibility of growth extending to years similar to Bitcoin.
When a huge wave develops, we get a half year strong correction, a major higher low compared to the start of the phase followed by additional growth.
Let's get back to today and what is happening now.
ADAUSDT managed to break above MA200 16-July, just three days ago. This confirms a long-term growth process; it is now confirmed. This means that Cardano is on track to grow for 3-6 months minimum.
What we are seeing now is only the start of a major advance and the continuation—on a long-term basis—of the move that started in late 2024.
You can rest easy, sleep easy while you watch your profits grow. Cardano will continue growing, it will do great; you have my word.
Thank you for reading.
If you enjoy the content leave a comment just for this one, I will be sharing updates for you now, today, yesterday, tomorrow and for years to come.
Namaste.
ETH to $12,600I think ETH, with all the current fundamental shifts happening in the past 6 months, is prime to run to the golden pocket, a perfect measured move and cup & handle pattern playing out.
1️⃣ Institutional floodgates opening
Spot ETH ETFs have seen massive inflows—billions flowing in just weeks.
BlackRock and other majors are prepping ETFs that may include staking, turning ETH into an institutional yield asset. This is serious structural demand, not retail hype.
2️⃣ Regulatory clarity coming in hot
The GENIUS Act and stablecoin bills in the U.S. are pushing regulatory clarity into crypto markets fast. This reduces uncertainty and increases appetite for ETH from corporates and funds.
3️⃣ Technicals are clean and bullish
ETH flipped $3,300 into support and is holding strong.
Next major resistances at $3,800–$4,100, with ATH at $4,800 firmly back on the radar.
Short-term structure is clear: higher highs, higher lows, solid volume backing it.
4️⃣ On-chain and supply dynamics
Whales are aggressively accumulating—large wallet inflows confirm that.
Staked ETH keeps hitting new highs (~30% of supply locked), tightening available float.
This supply squeeze + ETF demand = bullish cocktail.
5️⃣ Ethereum’s ecosystem dominance is intact
ETH still hosts the lion’s share of stablecoins and DeFi.
Layer-2 scaling is progressing fast, upgrades like EIP-4844 and Pectra coming soon, reducing gas fees and improving UX—critical for future adoption.

XRP Update · What To Expect Short-Term (Now!)XRP just hit a new all-time high and this is truly awesome if you hold this pair, if you were bullish before the breakout, if you bought LONG, etc. It is also good if you are an analyst looking for clues that will tell you what will happen to the Cryptocurrency market in the near future.
Remember that XRP moved early to start this cycle and it moved strongly. Right now, it is moving early and strongly again in comparison to many other pairs. This tells us that the rest of the market will follow.
I saw very strong bullish action across many pairs but I also saw many pairs staying behind; below their April's high. Now, what happens next?
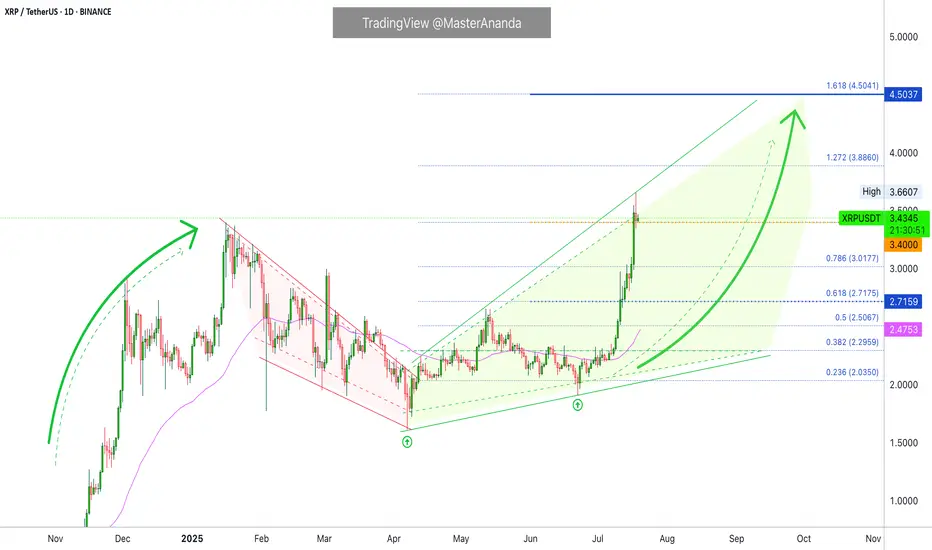
XRPUSDT made a stop after moving beyond its 16-January 2025 high. This is pretty normal behavior. After a strong rise, there is always a stop, retrace or correction. We do not expect a correction to develop now because the consolidation period was very long, strong and prolonged. So we don't have to worry about that one.
A retrace is possible but having one would be small and short-lived. Finally, a pause is the most likely scenario. A pause can range between 3-9 days. That is, that amount of time before additional growth.
The final possibility is the market moving straight up. Since we have a 126% rise since the 7-April low, we don't give much credit to this scenario. The top choice is a small pause before additional growth. The important part is "additional growth." This is what will happen. This is what comes next. XRP will continue growing. Boost if you agree.
Namaste.
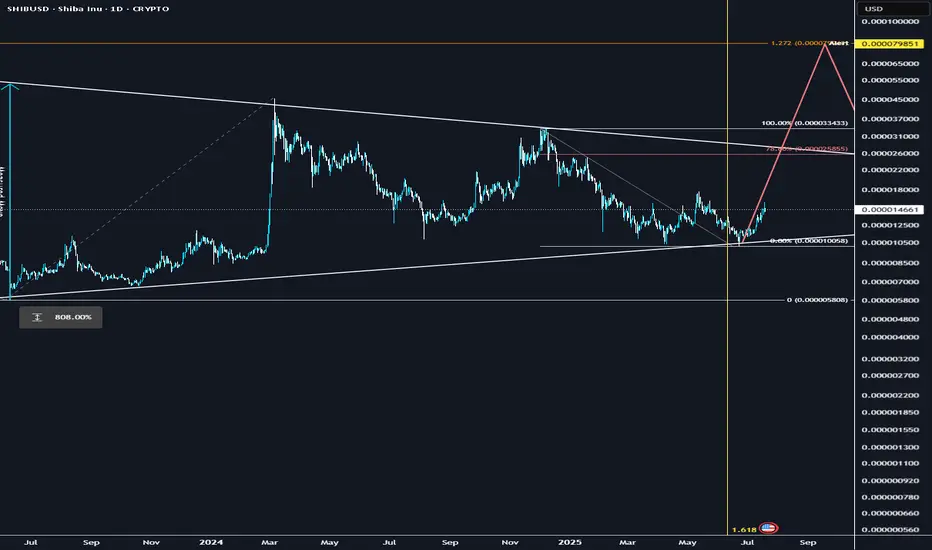
SHIB could explode soon.Multi year accumulation, crossing a significant fib-time pivot, similar set up to XRP.. could follow DOGE once it takes the lead as a catch up trade and rip..
Technical breakout: Above 200-day MA + golden cross formation
Volume surge: Social + trading volume spiking, driving demand
Ecosystem catalysts: Shibarium L2, metaverse progress, aggressive token burns cutting supply
Macro tailwinds: ETH rally + broad altcoin strength
I think it could be one of the leaders before capital rotates into the lower caps
DOGE to $2 before EOYCUP & Handle type formation on DOGE, really believe this can run to $2 during alt season which has just started firing its engines ...
BTC.D finally looks toppy.
📈 1. Technical breakout & chart patterns
DOGE has recently broken out of a long-term descending channel, forming a classic double-bottom pattern—a strong reversal signal.
It also cleared the key $0.20–$0.21 resistance zone, with on‑chain data pointing to rising futures/open interest and reduced sell pressure
⚖️ 2. Macro & regulatory tailwinds
The passage of the Genius Act in the U.S. House brought “clear‑cut regulation” for crypto, boosting confidence and driving DOGE higher—rising ~8% on the news
Broader crypto bull sentiment—fueled by possible Fed rate cuts and favorable legislation—has pushed altcoins like DOGE ahead this week
🧠 3. On‑chain & investor activity
Charts show increasing futures & spot trading volumes, along with expanding whale activity and holders staying profitable—collectively suggesting strong demand and low sell pressure
Network usage is also up: wallet interactions and momentum have accelerated as DOGE crosses these technical thresholds
💬 4. Community & utility factors
Dogecoin maintains a vibrant community, boating meme-driven social capital, plus occasional celebrity mentions (e.g., Elon Musk), keeping public attention
Its growing real-world usage in tipping, payments (e.g., Shopify, AMC, Tesla merch), and even institutional products—like the Grayscale Dogecoin Trust—adds fundamental backing

Synapse Short-Term Trade, To Move Next · 309% Profits PotentialLet me give you another pair that is ready to move, just in case you want to make some quick profits for the weekend (next weekend).
Good evening my fellow Cryptocurrency trader, how are you feeling in this wonderful day?
Everything we were expecting is now becoming all true. The altcoins market is bullish and moving up. We have long-term and short-term charts. Here you have a little bit of both.
Synapse will grow long-term of course, but we will focus on a sudden jump that will be happening next. Can be tomorrow, in a few days or a week or so maximum. The chart is bullish now.
Many pairs are moving past their April's high, I take this as a very strong bullish signal. Many pairs are still trading below. I take this also as an opportunity, it means that we can buy them before the breakout and enjoy fast, easy growth. The choice is yours.
Trading above EMA8/13/21/34.
Yesterday's candle is interesting and the really high volume 8-July. Remember, high volume at low prices with marketwide bullish action and you need no more. We are bullish, bullish now, bullish later—may profits come. Thanks a lot for your continued support.
309% potential profits is the next high. A minor stop and then higher.
You can cap your earnings even sooner at 124%, 226% or wait for the full 300%. Whatever you choose is up to you. Easy win with low risk when trading spot; you can't go wrong.
Thanks a lot for the follow, the trust and your continued support.
-----
The chart also shows a rounded bottom as a lower low. The lower low is a bullish signal because all weak hands were removed. When support is pierced on a broader bullish bias this is bullish. The action is happening back above the 7-April low and this works as confirmation of the move that I am predicting now. The pierce of support is not a bearish impulse/wave but rather a stop-loss hunt event.
Namaste.

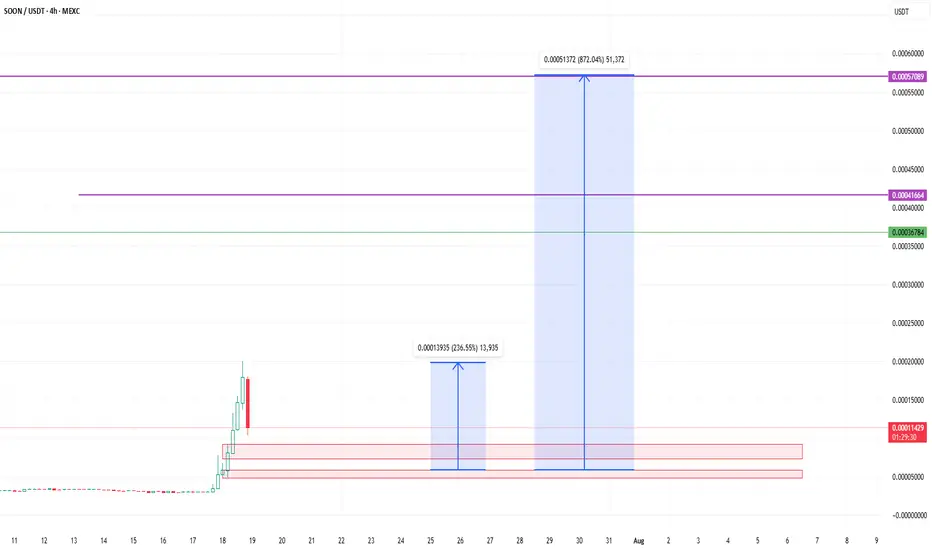
MR SOON GO TO THE MOON with huge commiunity and holder MR soon token is the Best meme for buy noow and a few wait foor a BIG pump so just buy and wait for pump and dont wory be happpy !
MR SOON GO TO THE MOON with huge commiunity and holder
now i am waiting for a very very very BIG PUMP my freind
XRP Support Holds After Being Tested 12 Times...Everything below $2 is quickly bought. No crash is good news. Not having bearish action and bearish follow up on sellers pressure is bullish. XRP is bullish and has been consolidating for months. The longer XRP trades above $2, the stronger will be the bullish wave that follows. We are getting very close.
Good evening (morning) my fellow Cryptocurrency trader, I hope you are having a nice day.
The same level has been tested over and over and over since December 2024 and it continues to hold. XRP managed to wick below $2 more than twelve times, this support continues to hold. When prices move lower, buyers quickly show up.
Look at this, before 7-April XRP was moving below $2 very often. After 7-April, only twice. Big difference. This reveals a bullish bias. When the market was bearish, this support was tested more often than not. As soon as XRP turned bullish, it was tested only once recently and once after the 7-April bottom.
This little dynamic here shows that the bulls have the upper-hand and this is all we need to know. Knowing that the bulls have the advantage, when the market breaks it is going to break up. A bullish continuation. It is confirmed and it is only a matter of time.
How long? Only the market knows but it is not far away. The longer it takes, the stronger the bullish wave that follows. Strong growth is likely to develop within days.
Namaste.

Haedal Protocol: Trading Young Charts Short-Term (~125% Profits)Remember the "young charts"?
"Not enough data."
We now trade the young charts as well but always keep it short-term. Our aim is a maximum of 130-120%.
Here I show higher targets but normally that's the range. We go for 10% the first target, more or less, to 120-150% the last target.
And of course, short-term for us means one month (30 days). For some people and trading styles this is a very long time and I understand.
Technical analysis HAEDALUSDT
» We have the falling wedge pattern. Automatically when the action breaks out of this pattern we have also a broken downtrend and downtrend line.
» Here we have a rounded bottom, a higher low and a bullish hammer candlestick.
» 16-June produced the highest volume and this day marks the end of the downtrend and bullish breakout from the falling wedge.
All these are bullish signal. We are aiming up while aiming higher. Higher high, higher heights, new all-time high and beyond in the coming weeks and months.
Namaste.

Epic Chain 212% Move Mapped —The 2025 Altcoins Bull MarketThe altcoins market bull market is fully confirmed and this confirmation comes as soon as Bitcoin hit a new all-time high. When Bitcoin is strong, bullish yet sideways, the altcoins market tend to grow. The altcoins are growing now, some pairs growing three digits within hours and that's because Bitcoin continues to consolidate near resistance. This same dynamic will only strengthen and is set to continue for months.
Epic Chain (EPICUSDT) already hit bottom and is ready to grow. Here we have a very easy 125% target, a fast, strong and easy bullish wave. It is likely to go way beyond this target but this is based on the short-term. It will go beyond because the altcoins are producing over 50% in their first hour or two of the initial bullish breakout. More than 100% within days and the potential for the entire bull market will be 20-30X on average.
You've been warned. This is a friendly reminder.
Prepare and maximize profits. Do whatever it is necessary to make the most of this opportunity, it only happens once every four years. This is the 2025 bull market bullish momentum building up. Just as promised. You will be happy with the results.
Namaste.

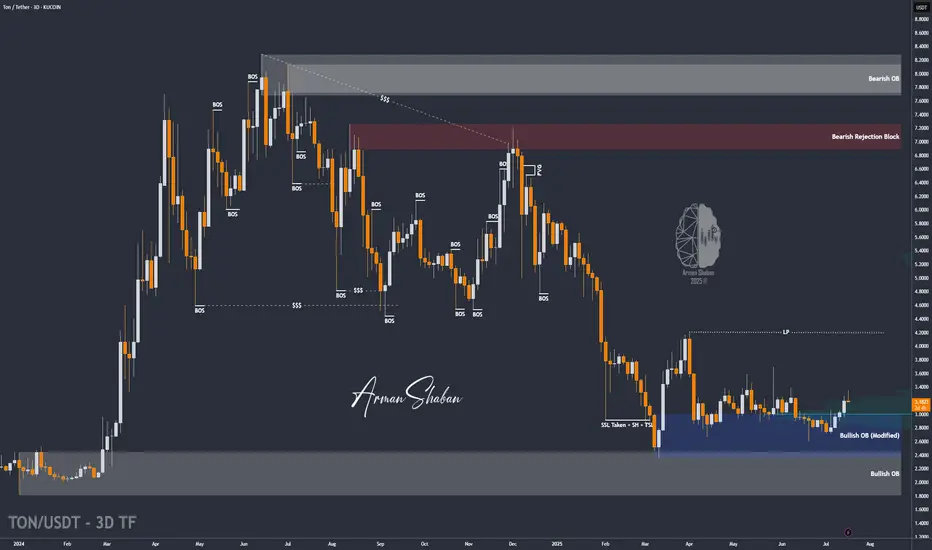
TON/USDT | Another Bullish Move Ahead? (READ THE CAPTION)By analyzing the Toncoin chart on the 3-day timeframe, we can see that, as per yesterday’s analysis, the price climbed to $3.36 before facing a slight correction — which is perfectly normal since every strong bullish trend needs a healthy pullback. The $3.05–$3.20 zone could serve as a good accumulation area for buyers, and we may soon witness another impressive rally from Toncoin! Based on the previous analysis, the next targets are $3.63, $4.20, and $4.68.
Please support me with your likes and comments to motivate me to share more analysis with you and share your opinion about the possible trend of this chart with me !
Best Regards , Arman Shaban
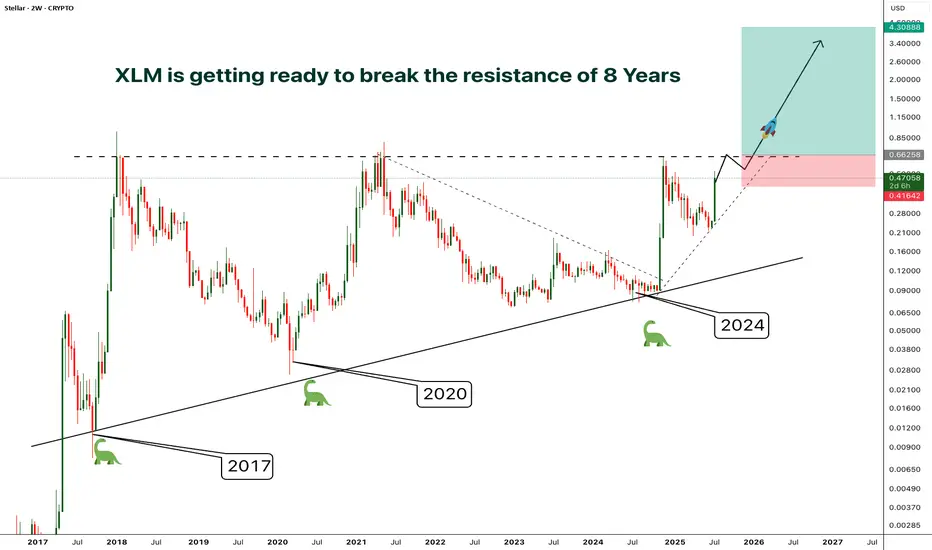
XLM - Resistance/Consolidation of 8 Years- Finally after 8 years of consolidation and getting rejected by the resistance at the same level around 0.65, XLM is preparing to break out from the almost decade old resistance
- A clear breakout from this resistance will phenomenal
- The price surge after the breakout will be unlike anything you've ever seen.
- I'm planning to enter after a confirmed breakout, entry before the breakout will be risky in case if the price gets rejected again.
Entry Price: Candle closeAbove 0.65
Stop Loss: Below 0.41
TP1: 0.88574
TP2: 1.21012
TP3: 1.92545
TP4: 2.68849
TP5: 4.27772
Don't forget to keep stoploss
Cheers
GreenCrypto
*ETH 4H — Charging the 0.236 @3700$ETH on the 4H is getting ready to charge the 0.236 Fib level.
MLR > SMA > BB Center — momentum is aligned.
Volume confirms the move.
Even though I don't enjoy it — and last time I sold just a part of the position too soon —
I placed a partial TP again. It needs to be done. The market can always turn.
We’ll be here to see it unfold.
Always take profits and manage risk.
Interaction is welcome.

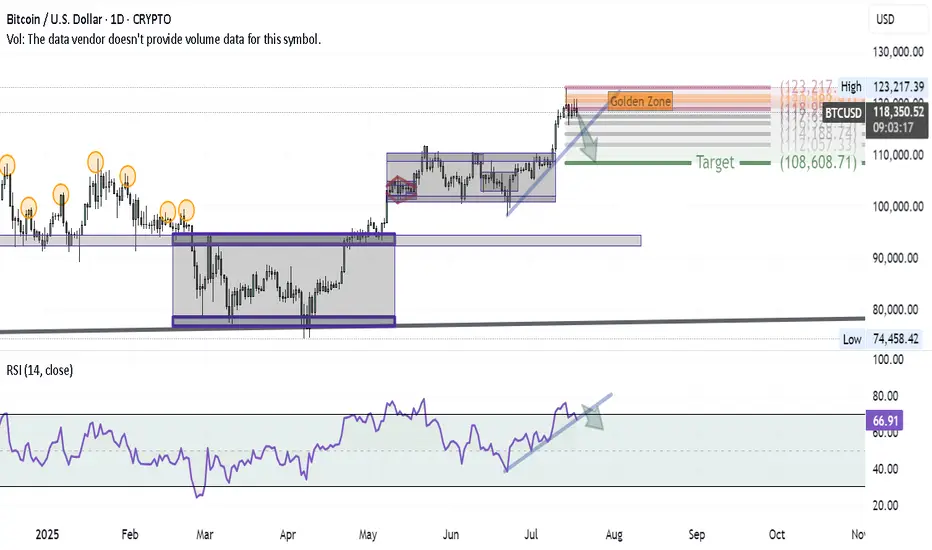
Bitcoin Correction Unfolding — First Wave in MotionAfter successfully hitting the BITCOIN target and anticipating a major correction in my previous ideas, here’s how the first wave of that correction is shaping up on the daily chart:
1- At the recent high, a Shooting Star candle formed — a classic reversal signal.
2- Using Volunacci analysis, the price retraced exactly to the Golden Zone, validating the first leg of the pullback.
3- The next step? A breakdown of the blue trendline would likely send us toward the Volunacci target at $108,600.
4- For confirmation, we're watching the RSI trendline — if it breaks down as well, it would strongly support the bearish continuation.
The setup is clean and developing as expected — it's all about following price and letting the chart guide the story.
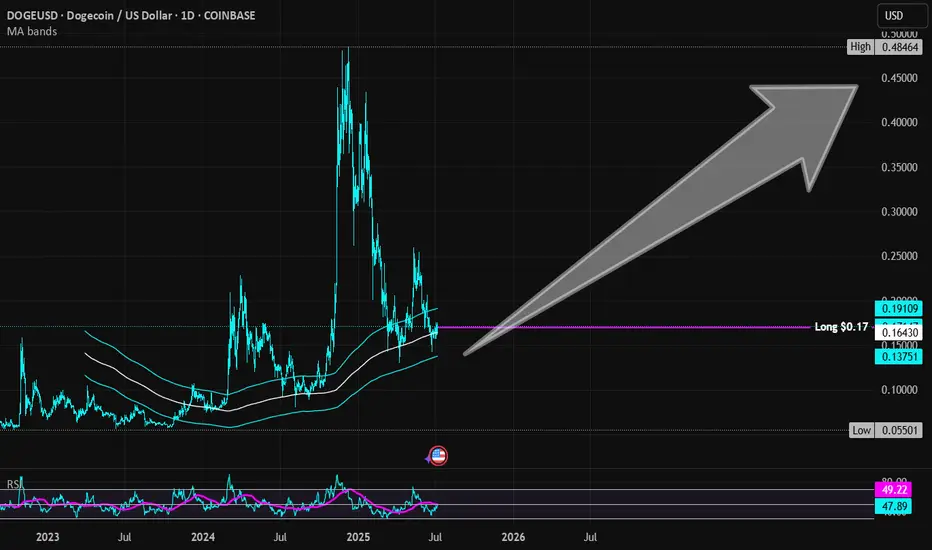
Dogecoin | DOGE | Long at $0.17Currently within my historical simple moving average area and consolidating. I suspect a move up is imminent, but 100% speculation. Crypto "bros" know more than I do.
Targets into 2028:
$0.25 (+47.1%)
$0.45 (+164.7%)
TOTAL3 exc BTCÐTOTAL3 is at the all-time high again and pushing to break that.
according to previous cycles the 1.414% of Fibonacci retracement at $1.98T is the top & timing of before the end of November 2025

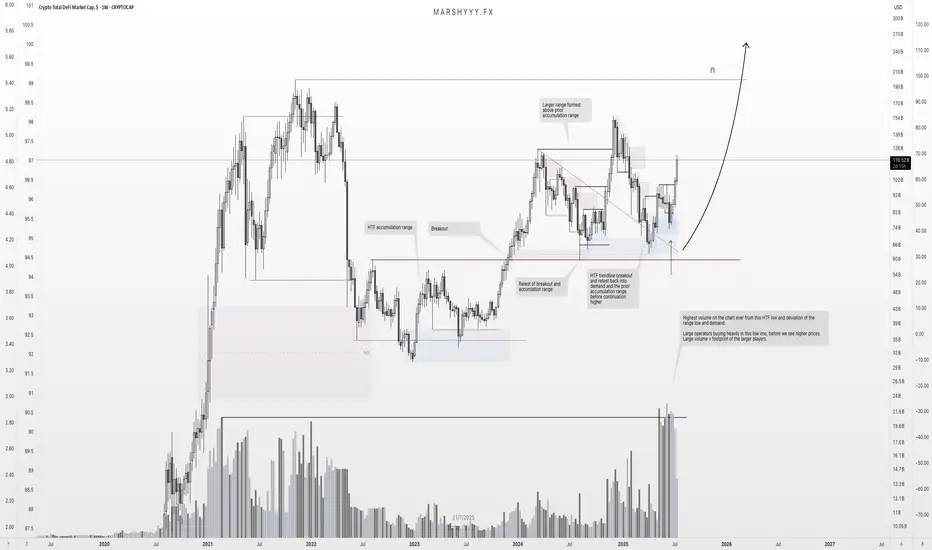
TOTAL DEFI: HTF Reaccumulation Underway — $200B+ In SightThis is one of the cleanest HTF setups in the market right now — and it’s flying under the radar.
We're looking at TOTAL DEFI market cap, and it’s showing all the signs of strong reaccumulation following a textbook breakout–retest structure off a larger HTF accumulation base.
Price broke out from the 2023–2024 accumulation range, retested that breakout zone and range highs in August 2024, swept liquidity, and tapped into unmitigated demand within the accumulation range — before climbing back to the $155B region, creating a larger range above the prior accumulation range it broke out from.
Since then, price pulled all the way back to range lows and HTF demand at $65B, forming a new bullish reversal from this key region and retesting the trendline breakout before continuing another leg higher — as we’re now seeing unfold.
But here’s the key:
🧠 That recent deviation came with the highest volume ever recorded on this chart — right off the range low and HTF demand.
That’s not retail. That’s large operators loading up, leaving their footprint ahead of the next expansion leg.
We’ve now:
- Broken the descending trendline cleanly
- Flipped key SR levels back into support
- Started pushing higher with strong HTF closes
📈 Expectation:
This is a spring + test setup within a reaccumulation range. I’m targeting continuation toward the range highs, followed by a macro breakout that could take DeFi market cap to $200B+ — especially once the prior distribution zone is reclaimed.
This aligns with the broader cycle narrative — liquidity rotating back into altcoins, particularly DeFi, as stablecoin dominance declines and the market shifts fully risk-on into the final phase of the bull cycle.
Key Structure Summary:
- HTF accumulation base → breakout → retest → demand sweep
- Largest volume spike = operator footprint
- Higher lows forming = market structure flipping
- Expecting expansion to $200B+ as trend continues
One to watch closely.
Don’t fade the volume. Don’t fade the structure.
XRP rally to $8.50After XRP broke above the resistance at $1.80 now that became the major support for the past few months and XRP is taking off again.
According to this huge monthly triangle and calculate from the breakout, so the next target for XRP is $8.50 for the coming months.

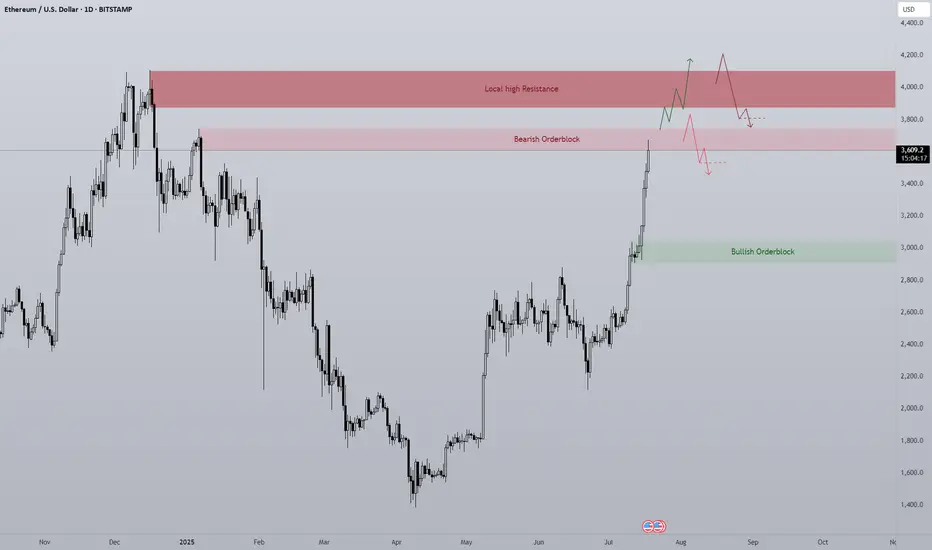
ETH 1D Overview Finally we are seeing altcoins regaining lost ground on Bitcoin and the second largest crypto by market cap is rallying strong.
Since ETH has such strength currently the opportunity to short is quite slim with high risk, however I think it's important to see where ETH may find some resistance or if a pullback was to happen, where would it come from?
The first level is the bearish orderblock level that has just been tapped as of writing. This area previously began the sell-off at the end of 2024 by confirming a new lower high. Naturally this area will present problems for the bulls and so a potential pullback could be initiated from this level. I would like to see a sweep of the stop loss positions just above the area and then a SFP to confirm the pullback is in motion.
Should the bearish orderblock fail the next clear level is the daily local top around $4000. A big even level and the area that started 5 months of downtrend. IMO the most likely level where longs will take profit. I do think if we see any form of consolidation between the bearish orderblock and the local high the bulls will look to carry the rally on, shallow pullbacks maintain momentum
Ten out of the last eleven days have been green candles with the only one day being red just above a key high, I expect if we are to get a pullback that bullish orderblock area ($2900-3000) to be retested as support. Therefor if any of the above areas initiate a pullback this area should provide support and therefor a long entry.
To clarify I am in no way bearish about Ethereum, this is just a plan for different eventualities.
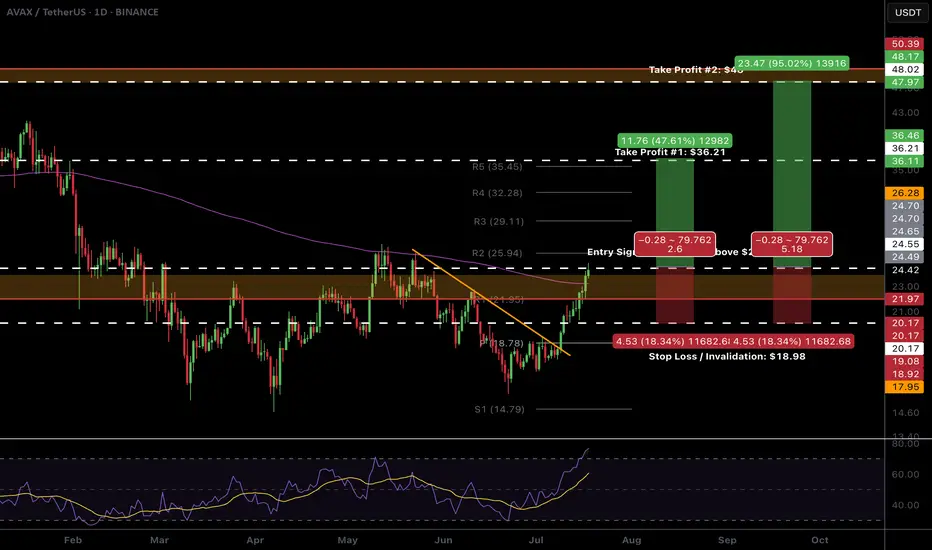
$AVAX Ready to breakout!CRYPTOCAP:AVAX looks ready to pop.
High Volume Node resistance and daily 200EMA is clear and now support. We don't want to see price rejected and moving back below this area.
The R5 daily pivot is my first partial take profit $35-36 followed by the major resistance High Volume Node at $48
Daily RSI is overbought with unconfirmed bearish divergence so watch out for this but should be good to run in the mean time. BTC permitting...
Safe trading
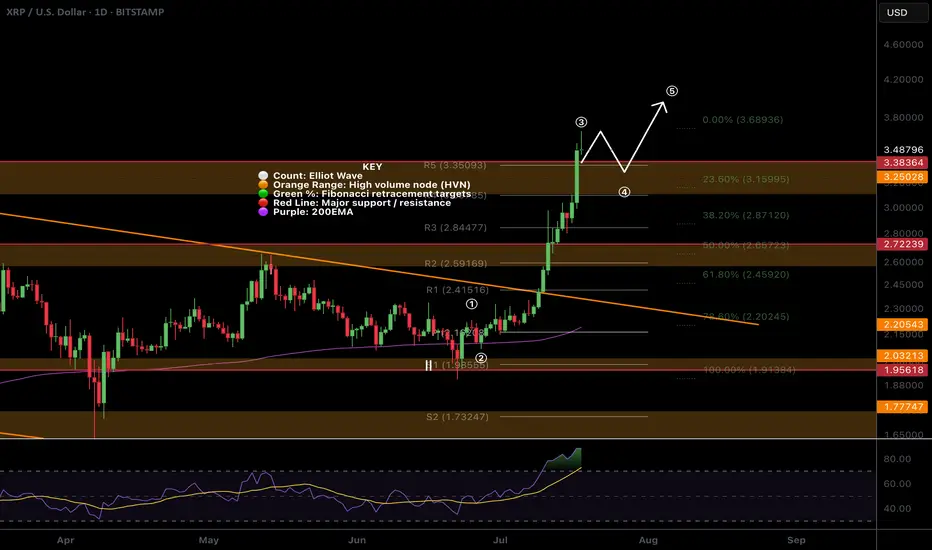
$XRP All time high! Time to sell or...?CRYPTOCAP:XRP appear to have completed wave 3 with a poke above all time high, typically this os behaviour of a wave 5.
The daily R5 pivot point has been breached so there is a significant chance of a decent pullback now but I wouldn't bet against the trend!
Wave 4 could be shallow, targeting the previous all time high, High Volume Node with waver 5 completing near $4.
Daily RSI is overbought but no bearish divergence yet which will likely emerge during wave 5.
Safe trading