BTC/USDT 1DAY CHART UPDATE !!Bitcoin displays a classic “cup and handle” structure on the daily timeframe – a historically bullish continuation pattern. The price has successfully broken above the neckline (~$107,000), indicating that bullish momentum is underway.
Thanks for your support!
DYOR. NFA
Cryptoanaliysis

ETH/USDT 1DAY CHART UPDATE !!ETH has broken out of a long-term downtrend (black diagonal trendline) and is now in a consolidation phase below the $2,800–$2,850 resistance.
The price is currently $2,612, showing hesitation below the key horizontal resistance.
Resistance Zones:
$2,800–$2,850: Key horizontal resistance. Breaking above this confirms bullish continuation.
$3,200 and $3,600: Medium to long-term bullish targets.
Support Zones:
$2,000–$2,200: Strong horizontal support + ascending trendline + 50 EMA (red line)
$1,410: Key long-term support (unlikely to be tested soon unless the market reverses)
ETH breaks and closes above $2,850 ➝ $3,200 → $3,600 → $3,800+ likely to rise
The structure suggests that a higher low will likely form before the breakout.
If ETH rejects at $2,850, expect a retest of $2,000–$2,200 (golden zone)
This would create a bullish higher low setup and could be a strong buy-dip opportunity.
Thanks for your support!
DYOR. NFA

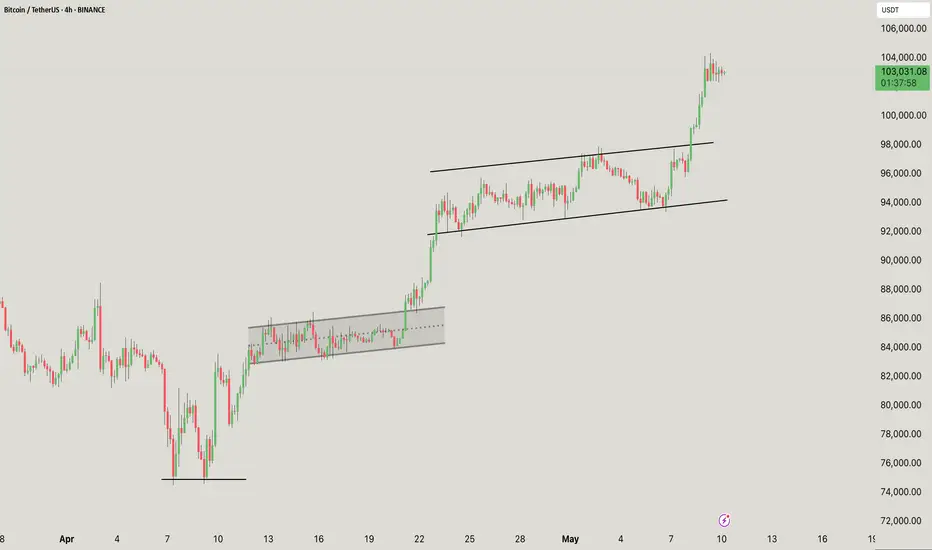
BTC/USDT Analysis – 4H Chart
This chart shows classic bullish continuation through ascending channels and consolidation breakouts:
A solid double-bottom structure was formed in early April
Marked the start of the uptrend
First consolidation box (~$90K–$93K)
Horizontal accumulation (highlighted gray box)
Resulted in a clean breakout and continuation
Rising channel (~$94K–$99K)
Rising Mid-trend consolidation wedge/channel
Price respected both trendlines
Eventually broke out to the upside → Strong momentum candle followed
Current Status (~$103K)
Price has broken above the rising channel
Now forming a new mini flag or consolidation at the top
Momentum is still in favor of the bulls
If you found this analysis helpful, hit the Like button and share your thoughts or questions in the comments below. Your feedback matters!
Thanks for your support!
DYOR. NFA
BTC/USDT 1DAY CHART UPDATE !!50-day moving average (red line):
This is a short-term trend indicator. It reacts more quickly to price changes and is often used to identify short-term trends.
When the price is above this moving average, it usually indicates bullish momentum; when it is below, it may signal bearish momentum.
200-day moving average (green line):
This is a long-term trend indicator. It provides a smooth moving average that helps identify the overall trend over a long period.
A price above this line indicates a long-term bullish trend, while a price below it indicates a potentially bearish market.
Current Analysis
Price Action: As of the current date, the price is hovering around the 80,000 USDT, just below the 50-day MA, which may indicate a potential resistance area.
Convergence of MAs: The behavior of both the 50-day and 200-day MAs can provide insight:
If the 50-day MA crosses above the 200-day MA (a “golden cross”), this typically indicates a bullish signal.
Conversely, if it crosses below (a “death cross”), this can indicate a bearish sentiment.
Support and Resistance: The chart also shows areas of support (horizontal green lines) around 76,000 to 80,000 USDT. If the price breaks this resistance, it may have room to move towards the next levels indicated.
If you found this analysis helpful, hit the Like button and share your thoughts or questions in the comments below. Your feedback matters!
Thanks for your support!
DYOR. NFA

BTCUSDT CHART UPDATE !!The BTC/USDT chart on the 4H timeframe shows a symmetrical triangle pattern, with price action near the top. Bitcoin is currently testing the lower trendline, a key support level. A breakdown below this level could lead to a decline towards the green demand zone of around $92,000. On the other hand, if BTC manages to hold the support and bounce back, it could attempt another test of the upper resistance trendline.
A decisive breakout in either direction will confirm the next trend. Keep an eye on increased volume to validate any breakout moves.
If you found this analysis helpful, hit the Like button and share your thoughts or questions in the comments below. Your feedback matters!
Thanks for your support!
DYOR. NFA

SOL/USDT 1DAY CHART UPDATE !! SOL/USDT price movement on the daily time frame. Here is an analysis based on the visual representation:
A symmetrical triangle pattern formed over a long period (August to November).
The price broke out of this triangle with strong bullish momentum, indicating a continuation of the uptrend.
After the breakout, the price entered a parallel descending channel, indicating a consolidation or correction phase.
The channel has well-defined support and resistance lines, with the price oscillating within boundaries.
The chart suggests a breakout from the descending channel on the upside.
A measured move from the channel width is anticipated to target the $300+ region, indicating a potential rally of around 50% from the breakout level.
Current Support: Around $200 (near the breakout level of the descending channel).
Immediate Resistance: Near $230 (previous high level and upper channel boundary).
Long-term resistance: $300+ (price projection from measured moves).
If you found this analysis helpful, hit the Like button and share your thoughts or questions in the comments below. Your feedback matters!
Thanks for your support!
DYOR. NFA
