BTC.D , Bitcoin Dominance Ready to RiseAfter a descending wedge pattern, Bitcoin Dominance has shown the first signs of an upward move. A CHoCH (Change of Character) has formed on the 4-hour timeframe, signaling a potential trend reversal.
We are now awaiting a retest of the broken resistance level before continuation of the bullish trend. However, the price might skip the retest and proceed directly higher.
Stay tuned for confirmation and manage your positions accordingly.
Cryptoanalysis

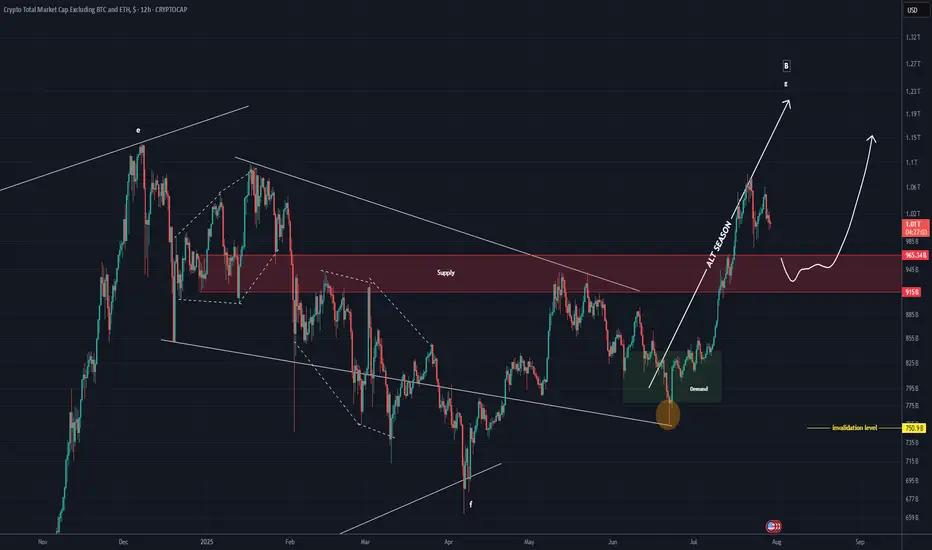
TOTAL 3 New Update (12H)This analysis is an update of the analysis you see in the "Related publications" section
This index has broken below the red zone; if a pullback to this area occurs, it may act as support again and the index could move upward
For risk management, please don't forget stop loss and capital management
Comment if you have any questions
Thank You
BTCUSD – Bearish Retracement Towards Key Liquidity Zone📊 BTCUSD – Bearish Retracement Towards Key Liquidity Zone
BTCUSD is currently trading near 116,425, showing signs of a potential bearish retracement after testing the previous resistance zone around 117,000–119,000. The chart structure highlights multiple Break of Structure (BOS) points, confirming shifts in market sentiment.
Technical Breakdown
Previous Resistance Rejection
Price failed to hold above the 117,000 mark, indicating strong selling pressure from the prior supply zone.
The rejection aligns with a liquidity grab above the recent highs, suggesting smart money distribution.
Liquidity & Fair Value Gaps
There’s a visible Liquidity/Fair Value Gap from the late July rally, which may now act as a magnet for price.
The market tends to fill these inefficiencies before deciding the next major trend move.
Target & Support Zone
The next key support and liquidity pool rests between 113,500 – 114,000, highlighted as the target zone.
This area has confluence with previous accumulation phases, making it a probable point for a bullish reaction if tested.
Volume Profile Context
Volume nodes indicate heavier trading activity below current levels, suggesting that a drop towards 114,000 could be met with increased buyer interest.
Market Outlook
Primary Bias: Short-term bearish retracement.
Immediate Target: 114,000 liquidity zone.
Invalidation: A daily close above 117,500 may shift sentiment back to bullish, opening the path toward 119,000–121,000.
Trading Insight:
Aggressive traders may look for short setups below 116,500, targeting 114,000. Conservative traders may wait for price to tap into the support/target zone for potential long opportunities with tight risk management.

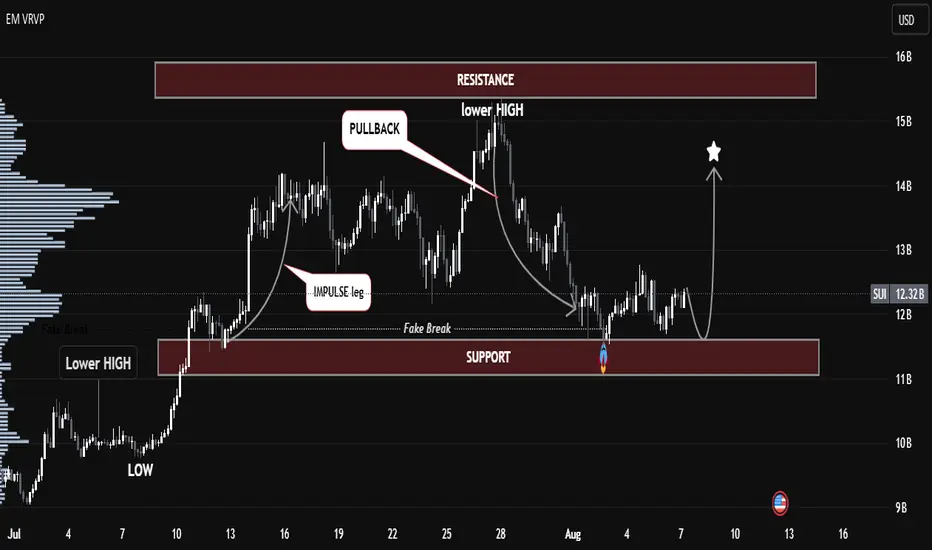
SUI/USDT – Smart Money Accumulation at Key Demand Zone📊 SUI/USDT – Smart Money Accumulation at Key Demand Zone | Bullish Outlook Ahead 🚀
The current SUI/USDT structure highlights a textbook Smart Money accumulation phase playing out at a key support zone, following a clear impulse–pullback–lower high formation.
🔍 Key Technical Insights:
🔻 Lower Highs Formation: A strong bearish structure led price back into the previous demand zone, sweeping liquidity below the support.
🎭 Fake Break Identified: Price action broke below the support briefly, indicating a liquidity grab (stop-hunt), often a precursor to bullish reversals.
🌀 Volume Node Alignment: Strong volume interest is building at the current support area, adding confluence for potential accumulation.
⚡ Projection Path: If the demand holds, expect a potential bullish reversal, targeting the previous resistance zone between 14–15B.
🧠 SMC Concepts in Play:
Fake Breakout = Liquidity Sweep
Impulse Leg = Institutional Activity
Pullback = Re-Entry for Smart Money
📈 Bullish Scenario:
Watch for confirmation around the support zone (~11B). A higher low or bullish engulfing pattern could trigger a rally toward 14B–15B resistance.
🛑 Bearish Invalidator:
A clean break and close below the 11B zone would invalidate the current bullish thesis.
Bitcoin Price Update: A Potential Breakout in Play!Looking at Bitcoin (BTC/USD) on the 8-hour chart, we’re witnessing some exciting action as BTC edges closer to a critical resistance zone, just below $122,000. This level has previously seen rejection, but the bulls are making a strong push with increasing momentum.
Key Levels to Watch:
Resistance Zone: $121,500 - $122,000 (previous rejection area)
Support Trendline: The strong black diagonal line, providing solid support since mid-July.
What’s Happening Now?
Bitcoin has just broken above the crucial trendline, suggesting a possible continuation of the bullish momentum.
The price action around the $121,500 zone is crucial: a clean breakout above this level could trigger a surge towards $124,000 and beyond.
What’s Next?
If BTC breaks and closes above the $122,000 level, we can expect a continuation towards new highs.
Watch out for potential pullbacks to the trendline for a retest before jumping in for long positions.
Trading Strategy:
Look for a breakout confirmation above $122,000, with potential targets at $124,000 and even $130,000 in the longer term.
Stop-loss should be placed just below the trendline support ($116,500) to manage risk efficiently.
Key Takeaway: Bitcoin is gearing up for a potential breakout, but patience is key! Let’s keep an eye on the market as we approach that critical resistance zone.
💬 What’s your take on Bitcoin's next move? Will it break the resistance, or is this just another fakeout? Drop your thoughts in the comments below!

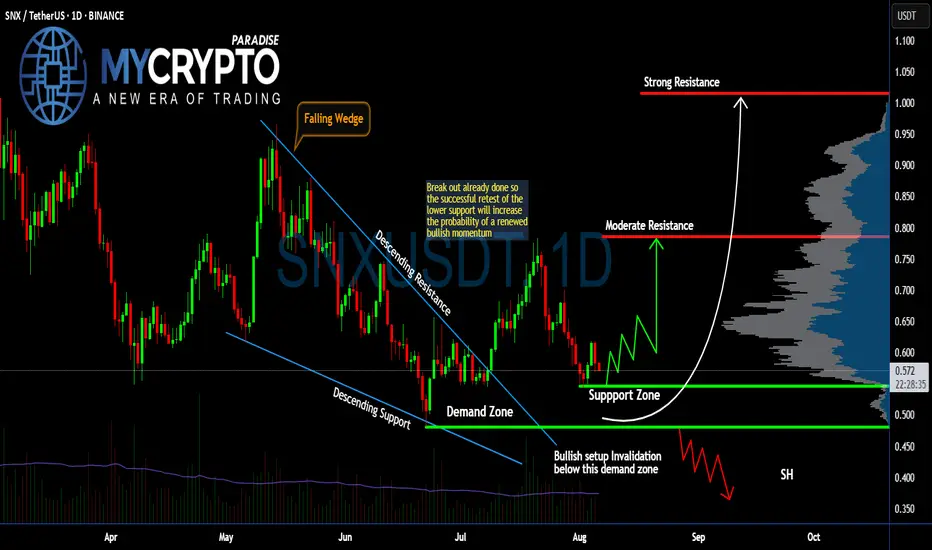
Can #SNX Bulls Sustain the Current Momentum? Watch it CloselyYello, Paradisers! Is this #SNX setup just another fakeout in disguise, or is the market quietly setting up for a major bullish momentum shift? Let’s dissect what’s really happening on #SNXUSDT:
💎After moving through a falling wedge pattern for months, #Synthetix has already broken out above the descending resistance, signaling an early shift in trend. However, the real move hasn’t yet begun—a proper retest of the support zone between $0.50–$0.54 is what we’re watching for now.
💎This support zone aligns with the prior wedge breakout and also overlaps with a visible demand area, making it a key region where buyers could step in again. If bulls defend this area successfully, we expect a renewed rally toward the moderate resistance level at $0.78.
💎From there, the next upside target lies at the strong resistance around $1.01—a level with heavy volume profile resistance and previous seller activity. But that level will only come into play if the bulls reclaim momentum with conviction.
💎On the flip side, if #SNXUSD breaks below $0.48, which is our bullish invalidation level, the setup collapses and opens the door for a deeper drop toward the $0.40–$0.35 zone, where short-sellers are likely to pile in.
Stay patient, Paradisers. Let the breakout confirm, and only then do we strike with conviction.
MyCryptoParadise
iFeel the success🌴
"BTCUSD Technical Outlook: Support Holds, Bulls Aim for $117K""BTCUSD Technical Outlook: Support Holds, Bulls Aim for $117K"
Market Structure Overview
BOS (Break of Structure): Multiple BOS points indicate strong shifts in market direction, confirming both bullish and bearish trends across different zones.
Bearish Fair Value Gap (FVG): This zone, marked after a BOS on July 23–24, acted as a rejection area, initiating a sharp sell-off — a classic bearish imbalance fill and reversal.
Equal Lows & Sell-side Liquidity: This area attracted liquidity grabs, as smart money hunts resting stop losses below these equal lows before reversing direction.
🔸 Key Supply & Demand Zones
Previous Resistance Zone (~118,000 - 120,000): Price rejected this area after filling the imbalance, confirming it as a strong supply zone.
Support Zone (~112,000 - 113,000): Currently acting as a high-probability demand zone. Liquidity accumulation here suggests a possible bullish reversal.
📉 Liquidity Zones
Sell-side Liquidity Sweep: Price dipped below equal lows to collect liquidity, often a signal of institutional accumulation.
Liquidity/Fair Value Zone (~116,000): Acts as a magnet for price, offering potential retracement targets before any major trend continuation.
📈 Forecast & Target
Current Price: $114,061
Short-term Target: $117,546 — aligning with previous FVG imbalance and liquidity zone.
Bias: Bullish Reversal expected from support zone toward the previous inefficiency and resistance levels.
🎓 Educational Takeaways
BOS Confirmation is critical in validating trend shifts and structure breaks.
FVGs (Fair Value Gaps) highlight inefficiencies and offer high-probability reversal or continuation zones.
Liquidity Sweeps near equal lows/highs often precede smart money moves — useful for spotting entries and exits.
Volume Profile (left side) suggests higher activity zones — these areas often align with major turning points.
✅ Conclusion
BTCUSD has swept liquidity below support and is showing signs of reversal. If the bullish pressure holds above $113,000, a move toward the $117,500 zone is likely, targeting previously unfilled imbalance and trapped liquidity.

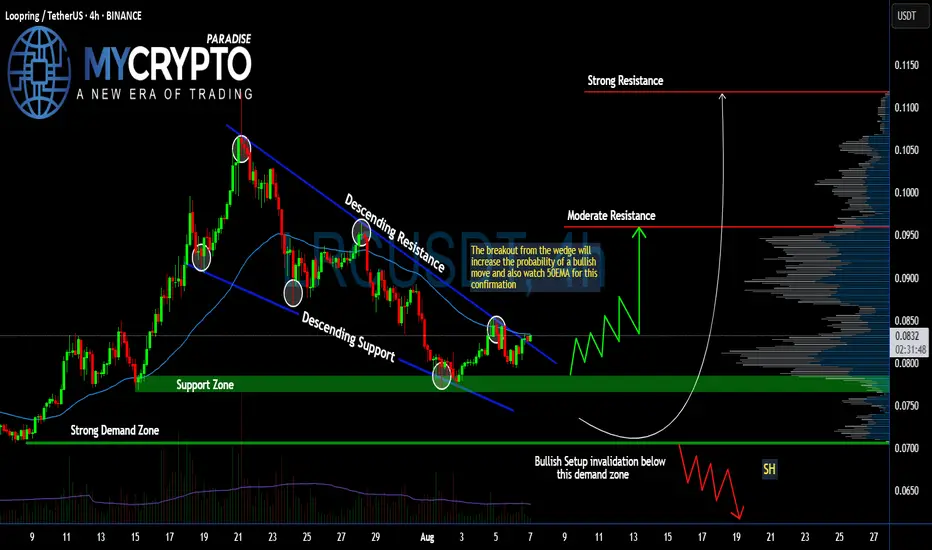
#LRC Ready for a Massive Recovery From Here | Must Watch Yello, Paradisers! Is #LRCUSDT finally ready for a breakout, or is it just another trap for early bulls? Let's break down the current structure of #LRC.
💎#Loopring ( CAPITALCOM:LRC ) has been moving within a descending wedge pattern for weeks, with price consistently making lower highs and lower lows—clearly respecting both descending resistance and support levels. However, we are now starting to see signs of change as it retests the upper trendline.
💎A breakout above the descending resistance is about to occur, and it’s doing so right around the 50EMA, which adds further confluence for a possible bullish move. This move is increasing the probability of a short-term trend reversal.
💎The support zone around $0.078–$0.082 is the key region to watch now. If bulls can hold above this zone and reclaim it as a base, we could see a breakout continuation toward the moderate resistance at $0.096. Should momentum build up from there, the next big target is the strong resistance at $0.1118—a level marked by historical seller interest and significant volume profile resistance.
💎However, if #LRCUSD falls below the strong demand zone at $0.0706, this entire bullish setup becomes invalid. That breakdown would suggest the market isn't ready yet, and could trigger another wave down toward fresh lows.
Stay patient, Paradisers. Let the breakout confirm, and only then do we strike with conviction.
MyCryptoParadise
iFeel the success🌴
Bullish momentum holds, 111-113k breakdown will be decisive__________________________________________________________________________________
Technical Overview – Summary Points
__________________________________________________________________________________
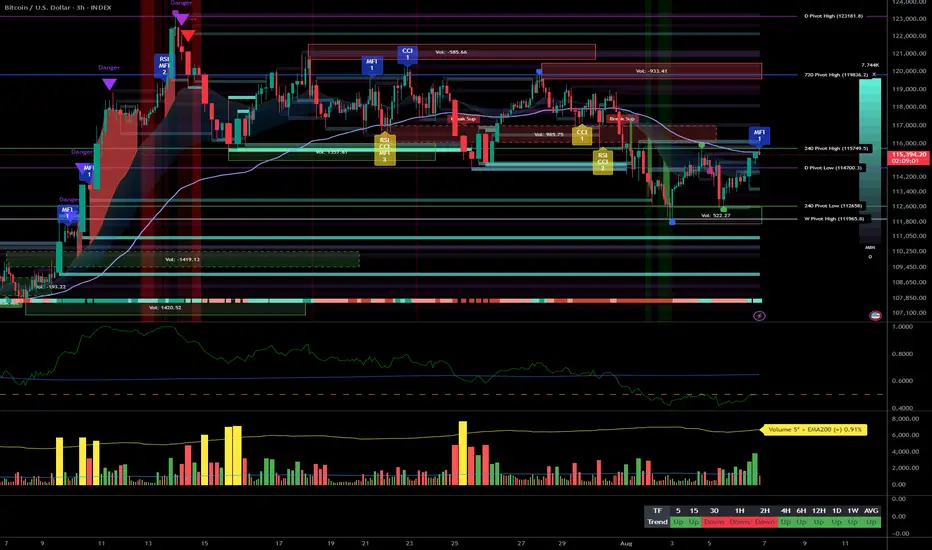
Momentum: Structurally bullish bias on HTF (1D/12H/6H/4H) confirmed by Risk On / Risk Off Indicator showing consistent “Strong Buy” signal. Technical consolidation on LTF (2H→15min) with emerging selling pressure.
Supports / Resistances: Major supports: 1D/weekly at 111-115k. Dense resistance between 116.9-119k. Structure remains valid if price holds >111k.
Volume: Normal on HTF; episodes of extreme spikes on 30min-15min indicating possible liquidations/flush but no widespread capitulation.
Multi-TF behavior: No panic in HTF; LTF selling pressure looks more like leveraged exhaustion than a lasting bearish reversal.
__________________________________________________________________________________
Strategic Summary
__________________________________________________________________________________
Global bias: Bullish (HTF). Holding support at 111-113k is the key condition to favor accumulation.
Opportunities: Tactical accumulation ≥111k, watch for breakout >117-119k, intraday scalps on LTF volume extremes.
Risk zones: Breakdown <111k = risk of fast flush towards 107-110k; rejection below 116.9-119k = potential bull trap.
Macro catalysts: Awaiting Fed decision (September), increased volatility around calendar events, global liquidity at highs, geopolitics on watch.
Action plan: Accumulate on major supports, confirm bullish leg on break >117-119k with volume, swing stop-loss <110k.
__________________________________________________________________________________
Multi-Timeframe Analysis
__________________________________________________________________________________
1D: Uptrend structure active, weekly/daily support 114-115k, Risk On / Risk Off Indicator bullish. Healthy consolidation below old resistance ≥119k.
12H/6H/4H: Trend Up, strong range zone, sector momentum steady, no sell stress.
2H/1H: Intermediate consolidation/selling pressure. Downtrend confirmed on 1H/2H, but volume controlled.
30min/15min: Very high volumes, ISPD DIV sell signal (15min), probable distribution/exhaustion. 111-113k key support = front-line to monitor.
Summary: Bullish structural alignment on HTF, consolidation/profit-taking on LTF but no major breakdown of key supports.
__________________________________________________________________________________
Macro & On-Chain Analysis (Technical x Fundamental)
__________________________________________________________________________________
Macro: Expected Fed pivot (Sept), global liquidity at ATH, geopolitics remain uncertain but stable, weaker dollar.
BTC on-chain: Accumulation in 110-115k area, ETF outflows, no STH stress, reclaim 116.9-119k resistance is crucial for bullish reversal.
Calendar: Fed/FOMC 30/07 (pause expected), US earnings & oil data 06/08. Watch for surprise events.
R/R: Favorable long ≥111k; break >119k = validation, short on failure at 116.9-119k if support lost, swing stop <110k.
__________________________________________________________________________________
Actionable Synthesis
__________________________________________________________________________________
Swing bias: Favor tactical accumulation or active management as long as support ≥111k holds and Risk On / Risk Off Indicator remains “Strong Buy”. LTF = trading ground, HTF = maintain core positioning.
Heightened vigilance at 116.9-119k: Potential trap/breakout activation zone. Watch liquidity on pullbacks and during volume “climax”.
Stay agile, adjust stops tactically according to intraday volatility and price reaction at key support levels.
__________________________________________________________________________________
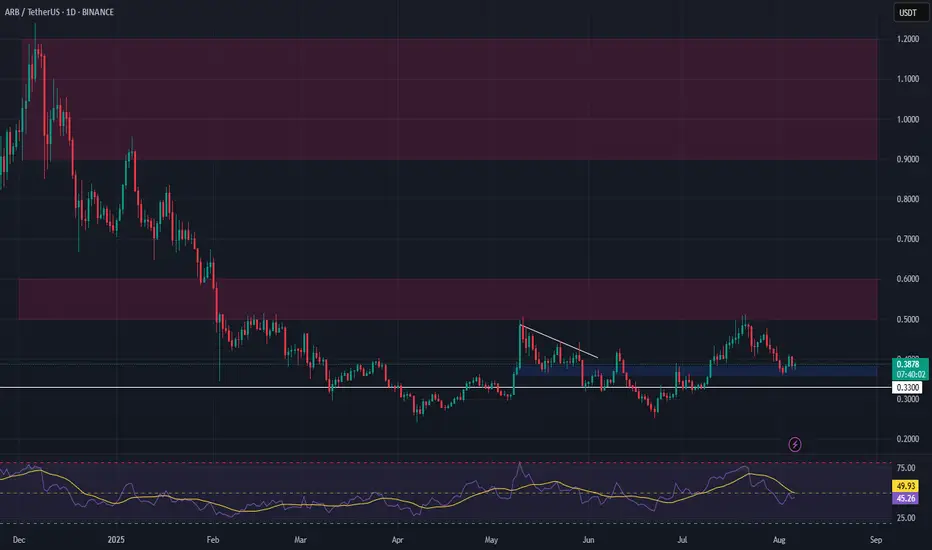
ARB Setup – Watching Key Support for Long EntryArbitrum (ARB) has pulled back into a critical support zone after recent declines. This level is showing strong buyer interest, and we’re eyeing a potential spot long entry as price consolidates near the lows.
📌 Trade Setup:
• Entry Zone: $0.386 – $0.38
• Take Profit Targets:
o 🥇 $0.50 – $0.60
o 🥈 $0.95 – $1.20
• Stop Loss: Just below $0.33
BTCUSD Technical Analysis – Smart Money Concept Based
🔍 BTCUSD Technical Analysis – Smart Money Concept Based
🕒 Timeframe: Intraday (likely 1H or 4H)
📅 Date: August 5, 2025
📉 Price: ~114,445 USD
📌 Key Zones and Observations
🔴 Previous Resistance (117,000–119,000)
This area has a strong high formed after multiple equal highs (EQH), indicating a liquidity pool above.
Price sharply rejected this zone, validating it as a significant supply zone.
🔵 Support Zone & Liquidity Pool (~112,600–113,200)
This is a high-volume node (visible on VRVP) where price consolidated previously.
Market structure suggests liquidity resting below, as indicated by the marked “Target” area at 112,648.
Smart Money may aim to sweep liquidity below this support zone before any meaningful reversal.
🟤 Order Block & Rejection at 115,210–116,065
Price tapped into a bearish order block, creating a minor change of character (ChoCH) and then started to decline.
Rejection from this zone signals distribution by institutions or Smart Money, leading toward bearish continuation.
🟢 Value Gap and Imbalance (Above 115,000)
A visible value gap still remains unfilled; however, current momentum is bearish, and price failed to reclaim it, hinting downside continuation.
🔄 Market Structure
BOS (Break of Structure) to the upside confirmed short-term bullish momentum.
CHoCH back to the downside near current price reflects bearish shift in order flow.
Price is respecting lower highs, and failing to break above 115,210 confirms a bearish bias.
🎯 Target and Outlook
Primary Bearish Target: 112,648 USD
This is a liquidity pool and previous support area where institutions may look to rebalance and accumulate.
Scenario:
If price retests 115,000–115,210 again and fails, expect strong continuation downward toward the 112,648 target.
If price breaks and holds above 116,065, bullish invalidation may occur, and we can look for higher retracement toward 117,000–119,000.
✅ Conclusion
BTCUSD is currently respecting a bearish order block, with Smart Money likely targeting liquidity resting below at 112,648 USD. Unless price breaks above 116,065 with strong volume, the bias remains bearish short-term.

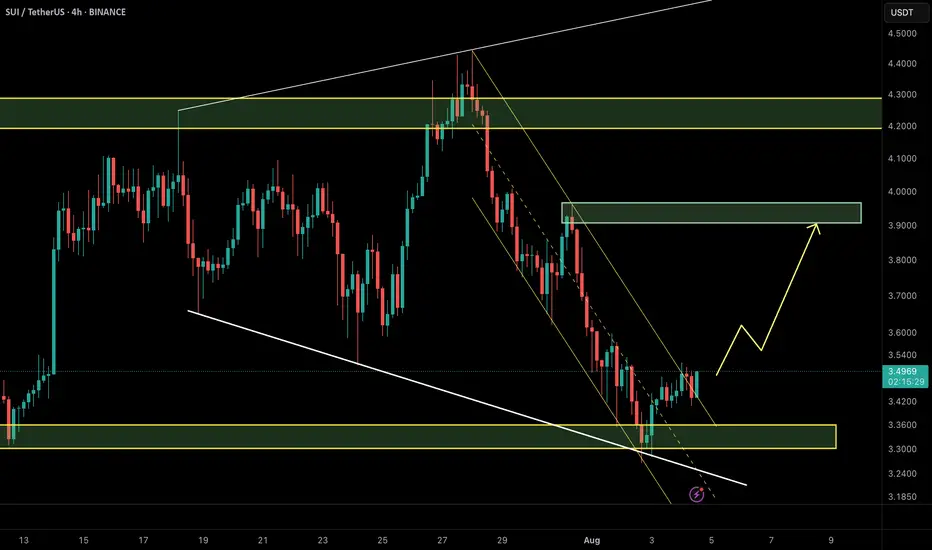
SUI/USDT – Price Outlook (2H TF)🔍 Updated Aug 4, 2025 | SMC + NeoWave
SUI has broken out of the descending channel and is currently holding above the strong demand zone around $3.35–$3.40. This zone overlaps with a bullish order block and prior trendline support.
📌 Bullish Scenario (preferred):
Price confirms support → Push toward $3.90–$4.00 supply zone.
📌 Invalidation:
A close below $3.35 invalidates the setup and suggests continuation of the correction.
💡 Tip: A breakout of structure (BOS) + mitigation of OB = solid confluence for long setups.
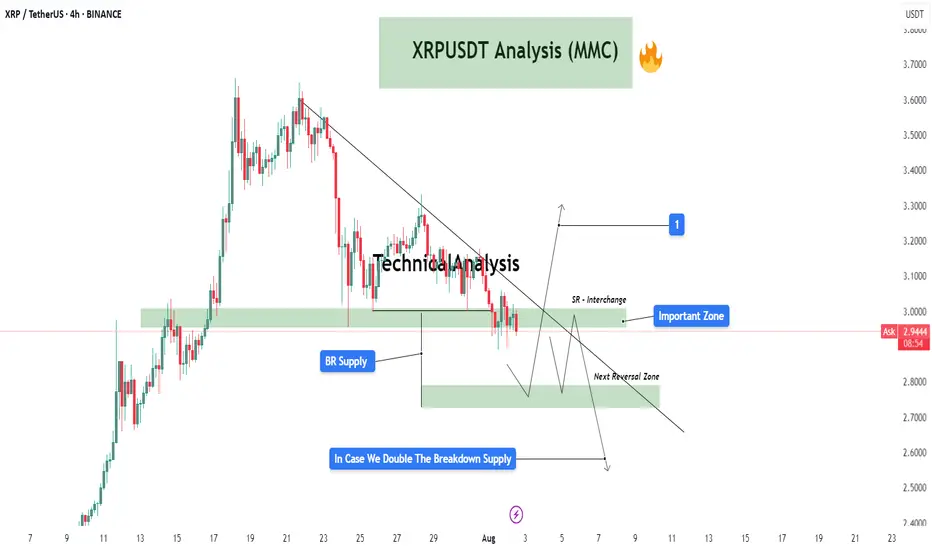
XRPUSDT Analysis (MMC) : Decision Point + Next Move Loading In this 4-hour chart of XRP/USDT, we're observing a critical structure forming under the Mirror Market Concepts (MMC) framework. Price action is compressing near an important descending trendline, suggesting that a breakout or breakdown is imminent. Let’s break it down zone by zone:
🔍 Key Zones & Price Structure:
Important Zone (SR Interchange Zone – $2.95 - $3.05)
This is a major supply-to-demand flip zone. It has served as both resistance and support in the past and is now acting as a potential interchange level. The price is hovering just below this area, retesting it after a significant bearish structure.
BR Supply Zone (Breakdown Retest Supply – $2.93 - $2.98)
After price broke down from this zone, it created a base for a retest. This level has since acted as a cap to further upside movement. It also coincides with the descending trendline, adding confluence to its strength as resistance.
Next Reversal Zone ($2.75 - $2.85)
In case the price fails to reclaim the Important Zone, we could see a bearish continuation move into the next zone of interest. This is a likely reversal or reaction area based on previous demand imprints and price imbalance.
SR Flip Watch
If price breaks above the trendline and sustains above the SR Interchange Zone, this could trigger a potential bullish breakout toward the $3.20+ region (labeled as target “1”). This move would be backed by trapped sellers and liquidity above the descending structure.
📈 Potential Scenarios:
✅ Bullish Case:
Break and close above the descending trendline.
Successful retest of the Important Zone as demand.
Push toward $3.20 - $3.30 where the next supply awaits (target 1).
❌ Bearish Case:
Rejection at the Important Zone and trendline resistance.
Breakdown below $2.90 confirms bearish pressure.
Possible liquidity sweep and reaction from the Next Reversal Zone ($2.75-$2.85).
If this zone fails to hold, continuation toward lower zones becomes likely.
🧠 MMC Perspective:
From a Mirror Market Concepts (MMC) standpoint, the market is currently at a reflection point where a decision between bulls and bears is about to play out. The clean diagonal structure plus clear horizontal liquidity pockets makes this setup ideal for anticipating manipulation traps and smart money moves.
AAVE Daily Chart – Key Buy Zone & Two ScenariosAAVE is currently moving within a well-defined ascending channel on the daily timeframe. The last major bullish leg began from the $120 support and surged nearly +180% to a local high near $330.
Now, after a 25% pullback, price is consolidating around the midline of the channel near $250. More importantly, there’s a strong bullish order block sitting between $220–230, making this a low-risk buy zone with a stop below the order block.
🔸 Scenario 1 (bullish preferred):
Price dips into the $220 OB zone, completes a possible ABC correction, and launches a new bullish leg targeting the channel top above $500.
🔸 Scenario 2 (bearish alternate):
If the $220 order block fails, deeper correction could follow toward the channel bottom near $135.
⏳ This is a critical area to watch for reaction – Smart Money will likely show its hand soon.
🔗 Analysis by CryptoPilot

TON/USDT – Daily Price Action Analysis🔹 Price has broken a major descending trendline and entered an ascending channel.
🔹 Currently testing the mid-range resistance zone around $3.60 – $3.70.
🔹 If buyers hold above this area, the next targets could be $4.40 – $4.80.
🔹 If rejected, key supports are at $3.20 and $2.90.

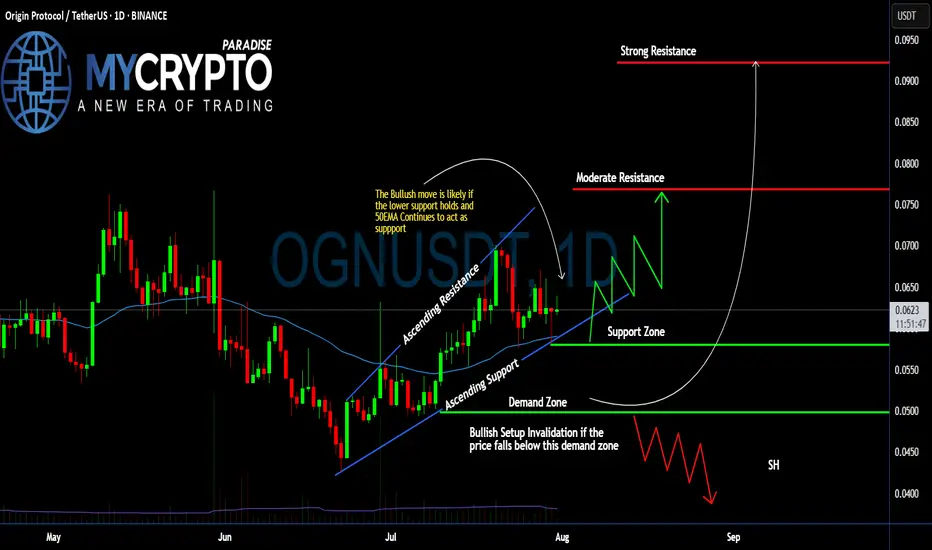
#OGN Ready For a Massive Bullish Move | Must Watch For BullsYello, Paradisers! Is #OriginProtocol about to explode to the upside, or is this a bull trap in disguise waiting to liquidate the impatient? Let’s break down what’s brewing on #OGNUSDT:
💎After forming a clean ascending channel, #OGN has been respecting both the ascending resistance and ascending support levels. Price is currently trading just above the 50 EMA, which has been acting as a dynamic support line since early July. This structure shows clear buyer interest around the $0.058–$0.062 zone—an area that aligns with volume cluster support.
💎The bullish scenario remains valid as long as #OGNUSD holds above the demand zone between $0.0499–$0.0580, and especially if it stays above the 50 EMA. As long as this structure is maintained, we could see a bounce toward the moderate resistance level at $0.076, where previous sellers stepped in and price stalled.
💎If buyers can break through that moderate resistance with strength and rising volume, the next key target lies at $0.092, which aligns with a strong resistance level and high-volume node on the visible range. This area is likely to trigger a reaction, so traders should remain agile.
💎However, if price breaks down below the demand zone, this would invalidate the current bullish setup and open the door for a potential move back toward the $0.045–$0.040 area. A broader shakeout would likely accompany this and could trap many late long entries.
Stay patient, Paradisers. Let the breakout confirm, and only then do we strike with conviction.
MyCryptoParadise
iFeel the success🌴
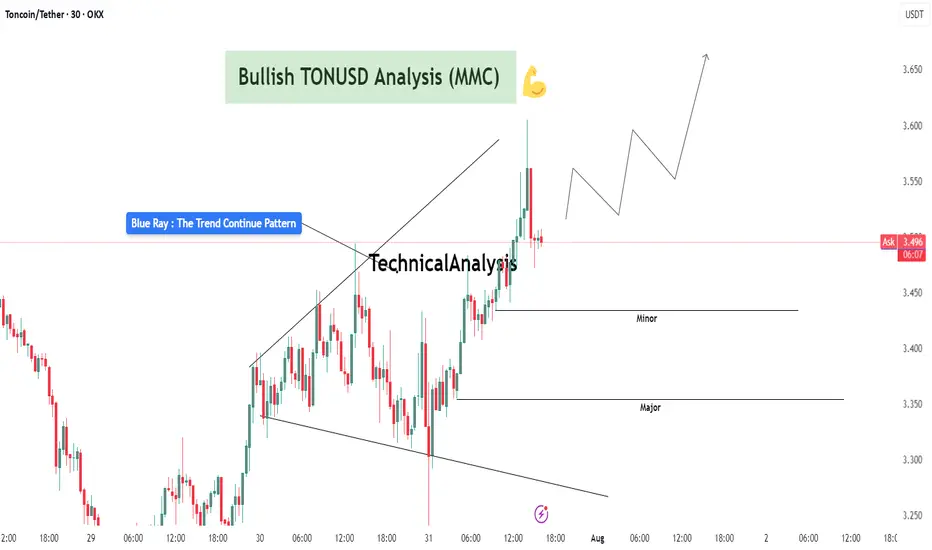
TONUSDT Analysis : Bullish Setup Breakout – Advanced MMC Analyze“Blue Ray Pattern Breakout Confirms Bullish Trend Continuation”
The 30-minute chart of TONUSDT highlights a clean and structured bullish setup based on the MMC (Mirror Market Concepts) methodology. The price action exhibits disciplined market behavior, respecting structural levels, breakout dynamics, and volume-based reactions.
🔷 1. Blue Ray Pattern – Trend Continuation Phase
This chart begins with the formation of the Blue Ray, a visual representation of trend consolidation and energy buildup. This pattern functions as a trend continuation flag or wedge. Prices compressed within a narrowing range, forming higher lows and lower highs, signaling accumulation under buyer control.
Once the pattern matured, we witnessed a decisive bullish breakout, where the price closed above resistance with conviction. This event marked a clear market intention shift and established a new impulsive leg.
🔍 2. Breakout Confirmation and Follow-Through
Post-breakout, TONUSDT experienced:
High-volume candles with elongated bodies, indicating increased buyer participation.
Immediate upside momentum that pushed the asset into a short-term overextended condition – often a healthy sign of strength when followed by a controlled pullback.
The breakout wasn’t just a false move – it was sustained, and the price held above the broken structure, proving that supply was absorbed and buyers were dominant.
🔑 3. Demand Zones (Minor and Major)
Two key MMC demand zones are highlighted:
🔹 Minor Demand Zone (~3.43–3.45):
This is the most immediate support and current price is hovering just above it. It's the first zone of interest for buyers and may serve as a re-entry or scaling point.
🔸 Major Demand Zone (~3.34–3.36):
In case of deeper retracement or volatility, this zone is expected to act as a strong bounce region based on past structure and MMC’s reversal logic. Price memory here suggests accumulation or reactive interest.
📐 4. Structure, Momentum, and Higher Timeframe Confluence
TONUSDT is in a confirmed uptrend, forming a clear sequence of higher highs and higher lows.
The structure supports a bullish flag breakout with minimal overhead resistance.
The projected path drawn on the chart illustrates a stair-stepping price pattern with continuation toward 3.60–3.70, if current levels hold.
📊 5. MMC Strategy Bias – Bullish
Using the MMC lens:
Blue Ray breakout confirms continuation
Volume absorption succeeded at the base of the flag
No signs of dominant supply entering post-breakout
Wave projection supports ongoing momentum
Structure favors buying dips, not shorting spikes
💡 Trader’s Takeaway:
TONUSDT is providing a textbook bullish opportunity under the MMC framework. As long as price stays above the Minor Demand Zone, continuation upward toward 3.60 and beyond remains in play. If price dips to the Major Zone, watch for strong buyer reactions for fresh entries.
Ideal for MMC traders and technical analysts looking to align with structured, logic-based entries and exits. This setup reflects market strength, technical clarity, and volume confirmation – a powerful trio for continuation plays.
BTCUSD Analysis : Blue Ray + MMC Bullish Scenario + Target Zone🟢 Today’s BTCUSD Analysis (MMC) – Strategic Insight into Institutional Behavior 💪
📊 Chart Breakdown: Understanding Price Through MMC
This 4H BTCUSD chart highlights critical behavior using Mirror Market Concepts (MMC) — where smart money traps, fakes, and flips market participants to create directional moves. Let’s break down the scenario:
🔸 1. Fakeout Zone – Smart Money Trap
Price initially surged to a local high, triggering a bullish fakeout, as shown in the green rectangle.
This move is designed to lure in breakout buyers above resistance, only to reverse sharply.
The sudden drop confirms smart money liquidation, catching retail longs off-guard.
A perfect example of a liquidity grab before shifting back into range.
📌 Fakeouts often mark the beginning of a new range or reversal setup in MMC methodology.
🔸 2. Blue Ray – Trend Continuation Structure
The consolidation after the fakeout forms the Blue Ray pattern, a recognizable trend continuation framework.
This structure signals smart money’s accumulation or re-accumulation phase.
Note how the price oscillates within the pattern, creating both lower highs and higher lows.
These compressions usually lead to explosive moves, either up or down, depending on liquidity build-up.
🔸 3. QFL – Quantity Following Line Event
Price briefly dips below the QFL level — another engineered stop-hunt to shake out premature longs and trap breakout sellers.
The reaction afterward shows strong buyer defense, confirming hidden demand.
MMC traders recognize this zone as a fake breakdown, setting up for the next trend wave.
🔸 4. Central Reversal Zone – The Decision Area
We’re currently hovering around the Central Reversal Zone, a key level of decision-making.
This is where liquidity from both buyers and sellers meets, making it a high-volatility zone.
Price could either:
(Scenario 1) Reject and fall lower to retest the trendline zone (marked with label 1).
(Scenario 2) Break above minor resistance and head toward the Next Reversal Zone (marked with label 2).
This structure aligns with MMC’s "Trap – Absorb – Break" cycle.
🔸 5. Major & Minor Resistance
Above the current price lies:
Minor Resistance (~$120,000): Immediate zone to clear for bullish continuation.
Major Resistance (~$121,000): Strong institutional supply, could act as the final hurdle before reversal.
If price clears these, BTC will likely target the Next Reversal Zone (~$122,500–123,500) for the next MMC reaction or short-term top.
🧠 Strategic Trade Outlook (MMC Logic)
✅ Bullish Playbook (Scenario 2):
Entry: Break and retest above $120,000 (Minor Resistance)
Confirmation: Hold above Central Reversal Zone with impulse
Target: $122,500–123,500 (Next Reversal Zone)
Risk: Close below $117,500 invalidates idea
🔻 Bearish Playbook (Scenario 1):
Entry: Rejection from $119,500–120,000
Target: Trendline support or prior QFL (~$116,000–115,500)
Invalidation: Clean 4H close above $120,500
📐 Key Concepts in This Analysis
Fakeout Trap: Retail euphoria liquidation
QFL Sweep: Smart money’s liquidity grab below structure
Blue Ray: Compression structure before continuation
Reversal Zones: Institutional interest areas where reactions occur
SR Flip Zones: Level conversion confirms trend maturity
📈 Summary
BTCUSD is currently in a smart money-controlled environment, compressing near key structural levels. The next move will be large, and by applying MMC, we’re prepared for both bullish breakout and bearish retest scenarios.
Be patient — traps come before trends.

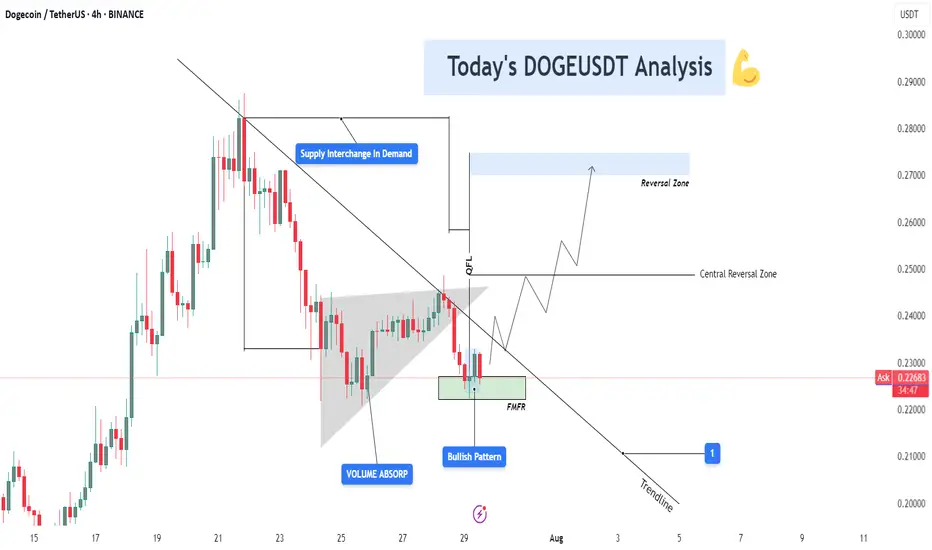
DOGEUSDT 4H – Bullish Reversal Building from FMFR Zone📊 Chart Context & Market Maker Concept Breakdown
DOGEUSDT on the 4H timeframe is setting up for a potential trend reversal, following a structured retracement into a strong demand zone that aligns with multiple smart money confirmations: QFL base, trendline break, volume absorption, and FMFR (Final Move Final Reaction). Let’s dive into the technical layers of this setup:
🔻 1. Downtrend Phase & Structure Setup
After peaking near $0.29, DOGE entered a controlled downtrend, respecting a descending trendline and forming a consistent lower-high structure.
Each rejection from the trendline reflects institutional distribution, gradually pushing price into lower demand levels where value buyers can step in.
🔄 2. Supply Flips into Demand (S/D Flip Zone)
A key level near $0.225 – $0.230 initially acted as a supply zone — but following QFL logic and smart money reaccumulation, it is now showing signs of demand activation.
The chart highlights “Supply Interchange in Demand”, which means that this zone has been repurposed — from distribution to accumulation — another MMC footprint.
📌 Interpretation: This is where large players flip their position bias and start loading for the next leg up.
🔵 3. Volume Absorption Confirmed
Prior to the current bounce, a strong volume absorption phase was detected within a falling wedge or triangular base, shown on the chart.
Despite sell-side pressure, buyers continued to absorb orders — a sign that selling is weakening, and accumulation is underway.
📌 Clue: Volume absorption often precedes an explosive breakout, especially when aligned with FMFR or QFL patterns.
🔁 4. Final Move Final Reaction (FMFR)
Price tapped into the green box zone one final time, marked as FMFR (Final Move Final Reaction) — a key MMC reversal signal.
This occurs when market makers fake a breakdown (creating panic) and then sharply reverse, trapping breakout sellers and scooping up liquidity.
A small bullish candle formation (Bullish Engulfing / Pin Bar) can be seen within this zone — the “Bullish Pattern” label marks this.
🧠 Smart Money Logic: Institutions want liquidity. FMFR fakes weakness to attract retail shorts, then reverses to ride liquidity to the upside.
🔗 5. QFL Base + Break of Structure Setup
A QFL (Quick Flip Level) pattern is forming. This represents a market structure flip, where price first drops from a base, reclaims it later, and continues in the opposite direction.
Breaking this base and confirming above it would mark a true reversal in structure.
🛠️ Technical Confluences at Work
Element Insight
🔹 QFL Structure Base level reclaim in play (structure shift)
🔹 Volume Absorption Smart money soaking up sell pressure
🔹 FMFR Reaction Final stop hunt before the rally begins
🔹 S/D Flip Supply turned to demand near $0.225 zone
🔹 Bullish Pattern Early confirmation of reversal
📈 Projection Path & Reversal Zones
Two projected zones are mapped for price behavior:
🔸 Central Reversal Zone (~$0.250):
First significant resistance where price may pause or react.
Ideal partial profit level or re-entry after pullback.
🔹 Main Reversal Zone (~$0.270–0.275):
Target area for a full liquidity sweep.
This was a previous high-volume supply zone.
If price reaches here, expect potential rejection or distribution unless momentum is strong.
🎯 Trade Setup Strategy (Based on Your Chart)
Entry Area: $0.225 – $0.229 (FMFR Reversal Zone)
Stop-Loss: Below $0.221 (beneath FMFR low)
Take Profit 1: $0.250 (central zone)
Take Profit 2: $0.270 – $0.275 (main reversal zone)
📐 Risk-to-Reward:
TP1: 1:2
TP2: 1:3+ depending on entry timing
🧠 Psychology Behind the Setup
This DOGE setup is engineered to trap emotional traders:
Retail sellers enter late near the bottom.
Smart money waits at FMFR zone, absorbing liquidity.
Volume builds quietly.
Market reverses explosively, catching retail off guard.
By recognizing this setup early, you’re aligned with Market Makers, not against them.
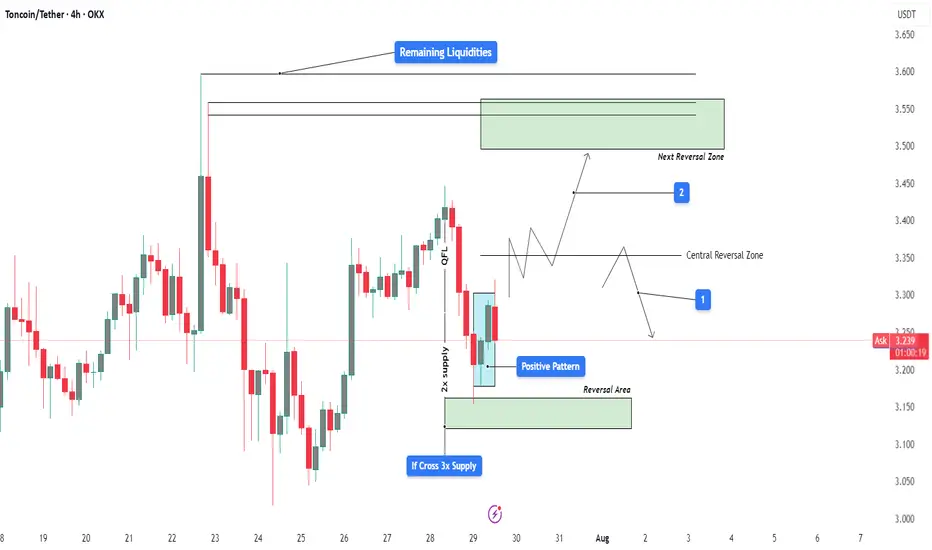
TONUSDT Bullish Reversal from Demand with QFL Base | MMC Setup📊 Technical Breakdown – 4H Chart
✅ Overview
TON/USDT is exhibiting early signs of a bullish reversal after a structured decline into a key smart money demand zone. The setup reflects multiple layers of confirmation—QFL base, multi-supply absorption, liquidity inefficiencies, and a positive reversal pattern—suggesting a high-probability opportunity for upside.
🔹 1. Impulsive Move & Liquidity Sweep
Price rallied aggressively on July 22–23, pushing toward $3.60, breaking short-term highs and triggering liquidity grabs above recent consolidation zones.
This surge absorbed significant buy-side liquidity, leaving a supply zone behind, now marked as the Next Reversal Zone.
After liquidity was collected and orders filled, the market reversed sharply, consistent with institutional profit-taking or engineered liquidation traps.
🧠 Smart Money Insight: Institutions often push price into illiquid zones (above highs) to trap retail and fill large orders. This marks the first phase of the trap.
🔻 2. QFL Base and Multi-Supply Absorption
The price structure created a Quick Flip Level (QFL) — a smart money concept where price forms a base, drops, then rallies, leaving behind an institutional demand zone.
The current pullback has revisited this exact QFL base, now reinforced by 3x supply absorption, enhancing the zone's strength.
This confluence increases the probability of a strong reaction to the upside from this level.
📌 Note: The “If Cross 3x Supply” label shows that this zone has absorbed multiple attempts to break down. It's now acting as a demand pocket.
🔄 3. Reversal Area – The Engine Room of Smart Money
The Reversal Area is carefully marked at $3.20–$3.28 — the ideal discounted price zone where large buyers tend to step in.
This zone is structurally important:
Past breakout level
Aligned with QFL base
Beneath stop levels of breakout traders
A Positive Pattern has now formed within this area—likely a bullish engulfing, morning star, or pin bar, depending on candle confirmation.
📌 Psychology: This zone acts as a trap. Retail traders often panic sell here, while smart money accumulates quietly before launching price upward again.
🧭 4. Dual Scenario Structure – Projected Paths
You’ve beautifully mapped two valid future price scenarios based on reaction to the Central Reversal Zone (~$3.35):
🔵 Scenario 1 – Healthy Pullback Before Continuation
Price climbs toward the central zone, then pulls back slightly to retest support near $3.28–$3.30 (label 1).
This allows further accumulation before price breaks higher.
This is a safer re-entry scenario for patient traders looking for a retest.
🟢 Scenario 2 – Direct Impulsive Rally to Next Reversal Zone
Price continues with bullish momentum, slicing through $3.35 and aiming for the Next Reversal Zone at $3.52–$3.60 (label 2).
This zone contains remaining liquidity, left uncollected from the previous impulse.
Price is likely to reverse or pause at this level again due to heavy supply.
📌 Key Tip: If price reaches that zone without significant resistance or exhaustion, it may signal continuation potential with minor corrections.
💼 Strategic Trade Plan (High-Probability Setup)
Entry Zone: $3.20 – $3.28 (Reversal Area)
Stop-Loss: Below $3.15 (beneath structure + QFL base invalidation)
Target 1: $3.35 (Central Reversal Zone)
Target 2: $3.52–$3.60 (Liquidity Completion & Next Reversal Zone)
🧮 Risk-Reward Estimate:
Conservative: 1:1.8
Aggressive: 1:2.5 or better if price reaches high liquidity zone.
🔄 MMC Flow Summary – What the Market Makers Are Doing:
Create a trap at the top (collect liquidity and fake the trend)
Force price down into demand (scare retail + grab stops)
Absorb sell orders in bulk at QFL/demand zone
Form bullish reversal pattern (positive structure)
Push price upward again, aiming for uncollected liquidity above
📌 This is a classic MMC cycle — engineered by large players, and now you’re aligned with their strategy.
🧠 Why This Matters
This chart isn’t just about entry and exit; it’s about understanding the underlying psychology and structure. By aligning with the smart money footprint — QFL, supply absorption, and liquidity targeting — you're maximizing edge and minimizing guesswork.
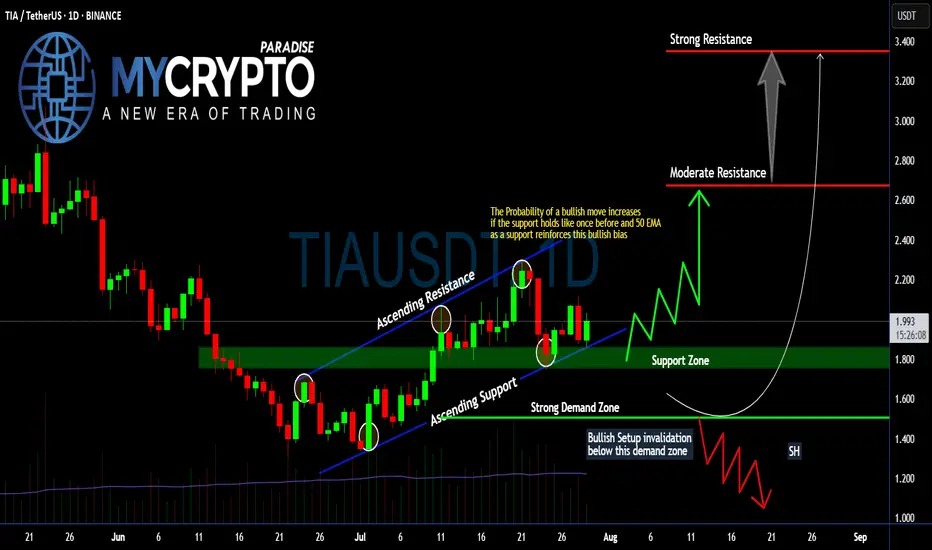
Will #TIA Continue to Soar or Bears Can Halt it? Must Watch Yello, Paradisers! Will we see #TIA continue to soar from here, or can bears halt its momentum? Let's see the latest setup of #Celestia to see what's going to happen:
💎Following a textbook ascending channel structure, #TIAUSDT has been respecting both its ascending resistance and ascending support, with each touchpoint confirming trader participation and growing confidence. Price is currently holding above the 50 EMA and within a crucial support zone between $1.80–$1.90—an area that previously triggered a strong impulse move to the upside.
💎The probability of a bullish continuation increases significantly as long as the #TIAUSD respects this support zone and the 50 EMA acts as dynamic support. If this level continues to hold, we expect a move toward the moderate resistance around $2.67, the key area where sellers previously stepped in aggressively.
💎But that’s not all—if bulls gain momentum and break above $2.67 with strong volume, the next price magnet becomes the $3.34 level, where strong resistance and high-volume node overlap. This level would likely be the point of exhaustion unless broader market momentum takes over.
💎However, caution is critical here. If price breaks below the strong demand zone around $1.507, this invalidates the bullish structure entirely and opens the door for a swift move down toward the $1.20–$1.00 range, where a potential market shakeout could occur. Remember, a failed bullish setup often becomes a powerful bear trap for undisciplined traders.
Stay patient, Paradisers. Let the breakout confirm, and only then do we strike with conviction.
MyCryptoParadise
iFeel the success🌴
BTCUSD Analysis (MMC) – Breakout Confirmed + Target Next Zone⚙️ Chart Context (4H BTC/USD)
As part of our Mirror Market Concepts (MMC) strategy, today's BTCUSD 4H chart is a textbook representation of market structure shift, SR interchange, demand reaction, and target projection. After consolidating within a compressed range under a key descending structure, Bitcoin has successfully broken out of bearish control, signaling a fresh phase of bullish momentum.
🧩 Breakdown of Technical Structure
🔹 1. Demand Zone Reaction (July 13–14)
The initial impulse move originated from a well-defined demand zone, marked by a strong accumulation and breakout. This zone—highlighted on the chart—acted as the institutional demand base, where buyers stepped in with volume and aggression. Price respected this zone precisely, confirming it as a valid MMC "Power Base."
Why this matters: Demand zones like these reflect institutional footprints. Once price reacts from such zones, they often become foundational for future bullish legs.
🔹 2. SR Interchange Zone – Structure Flip Confirmed
The descending green channel acted as dynamic resistance for several sessions. Every touch along this zone resulted in a lower high, confirming bearish order flow. However, BTC has now closed decisively above this structure, transforming this zone from supply to support—this is our classic SR Interchange concept in MMC.
Interpretation: This structure flip implies a strong change in sentiment. What was once a zone of rejection now becomes a potential support for continuation.
Expect retests of this zone before price resumes to higher reversal levels.
🔹 3. Minor and Major Resistance Zones
Above current price, two critical zones have been mapped:
Minor Resistance (~$120,000):
Acts as the first liquidity grab area. This is where early sellers may place stops or where short-term traders could book profits. MMC logic expects minor resistance to either cause a pause or a fakeout to lure in shorts.
Major Resistance / Central Reversal Zone (CRZ):
Spanning roughly $121,000 to $121,800, this is a key zone where price will likely meet decision-making. This CRZ is derived from previous structure congestion, imbalance fills, and projected Fibonacci confluence.
Next Reversal Zone (Final Target Area):
Located near $123,000, this is the outer reversal box where the bullish wave may either end, consolidate, or reverse entirely. This is the final target for swing traders or MMC practitioners looking for exhaustion.
🧭 Price Forecast Structure – Predictive Pathway
The forecast path shown on the chart illustrates a stair-step rally, with bullish impulses followed by shallow pullbacks:
First, price may pull back slightly to retest the breakout zone (green SR area).
Then a leg upward to minor resistance (~$120K).
A healthy rejection or small correction before breaking into the CRZ (~$121.2K).
Final move toward the outer reversal zone at ~$123K.
This fractal progression is a common MMC pattern seen during structure shifts—not impulsive straight-line rallies, but controlled, zone-to-zone movements.
🔍 Strategic Insights & Trade Plan
📌 Conservative Entry:
Wait for a retest of the breakout zone (SR Interchange) around $118,200–$118,500.
Look for bullish rejection candles or order flow confirmation on LTF (lower timeframes).
📌 Aggressive Entry:
Break and close above $120,000, confirming liquidity clearance and path toward CRZ.
🎯 Target Zones:
TP1: $121,200 – Central Reversal Zone
TP2: $123,000 – Outer Reversal Zone
❌ Stop-Loss Ideas:
Below $117,000 (structure invalidation)
Below recent bullish impulse candle low
🧠 MMC Concepts in Action:
SR Flip: Strong indication of market shift
Demand Rejection: Institutional footprint detected
Zone Mapping: Controlled zone-to-zone movement
Liquidity Logic: Price moves where orders rest – CRZ = likely reaction
Reversal Framing: Structure analysis ahead of time, not after the move
📊 Conclusion:
This BTCUSD 4H analysis showcases a strong MMC-style breakout scenario. The reaction from demand, shift in SR structure, and projected reversal zones give us a clean roadmap. As long as the structure remains valid and price respects the new SR zone, this bullish move remains high-probability.
Trade with structure. Trust the zones. Mirror the Market.

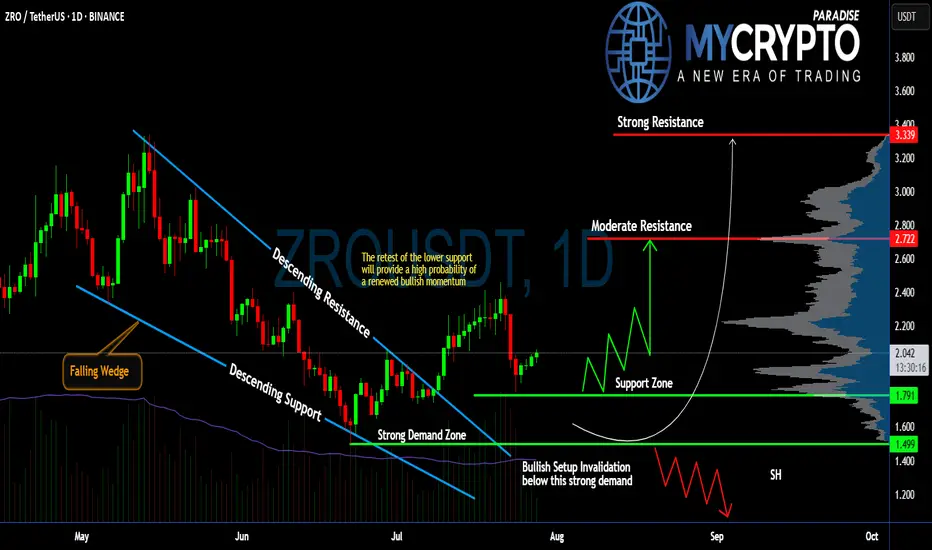
Will #ZRO Continue to Climb or Not? Must Watch For BullsYello, Paradisers! Are we witnessing the beginning of a powerful bullish reversal on #ZROUSDT, or is this just a fakeout setup? Let’s dissect this setup of #LayerZero:
💎After weeks of consistent bleeding, #ZRO has printed a classic falling wedge pattern, often a precursor to bullish reversals. This wedge has now been broken to the upside, with price currently trading around $2.037, suggesting renewed buyer interest following the breakout from descending resistance.
💎What’s crucial here is the retest of the wedge’s descending support, which aligns perfectly with a strong demand zone between $1.499 and $1.791. As long as #ZROUSD respects this zone, the probability of a bullish continuation remains high. This zone also serves as a clear invalidator for the setup—if price closes below $1.499, the bullish thesis will be off the table.
💎From here, if bulls can maintain control, we’re eyeing a potential move toward the moderate resistance at $2.722. That’s the first real hurdle where profit-taking or short interest could spike. A clean break above that level would open the path to the strong resistance around $3.339, where a heavy supply zone is likely to cap further upside.
💎Until then, we expect a series of zigzag corrections above the support zone before any sustained push higher. However, be cautious, losing the $1.499 support turns the structure bearish and could drag the price toward the $1.20 region, or lower.
Stay patient, Paradisers. Let the breakout confirm, and only then do we strike with conviction.
MyCryptoParadise
iFeel the success🌴