XRP Holds Firm—Will Bulls Push It Higher?FenzoFx—XRP bounced from the $2.08 weekly resistance, aligning with the bullish Fair Value Gap. Currently, XRP consolidates at $2.17, with key resistance at $2.21.
A breakout above $2.21 could trigger bullish momentum toward $2.27. However, if XRP closes below $2.08, the downtrend may resume, targeting $2.00.
Cryptoanalysis

Bearish Pressure Eases—Can Litecoin Recover?FenzoFx—Litecoin remains bearish after breaking below $93.55, though selling pressure eased near $83.0. Currently, LTC/USD is testing the bearish Fair Value Gap at $87.5.
A recovery toward $93.55 is possible if price closes above the $88.0–$90.0 zone, allowing bullish momentum to extend toward $92.00.
However, a dip below $85.0 would invalidate this outlook, with the next bearish target at $81.0.

BTC/USDT – Trendline Breakdown Alert!Bitcoin has broken below its ascending trendline on the 4H chart, signaling a potential shift in momentum. 📉
Current Price: $103,322
Immediate Support Levels: $101,539 | $97,205
Target Zone: ~$97K if bearish momentum continues
Resistance: $105,101 | $108,941
If the momentum is sustained above $105,101, we can see a rally to the immediate resistance of $ 112,000.
Stay tuned for detailed updates !!
Watch for confirmation below $101.5K — a sustained drop could open the gates to further downside. Trade safe! 🚨
#Bitcoin #BTCUSDT #CryptoTrading #TechnicalAnalysis #TradingView #ScramblerG

Bitcoin is bearish | stay cautious (1H)This analysis is an update of the analysis you see in the "Related publications" section
We have been warning about a potential Bitcoin correction for some time. It appears that wave G has ended, and key levels have been lost. If the price reaches the red box, it is expected to be rejected downward.
The green zone is a relatively strong support area for Bitcoin, and we should closely watch this level.
A daily candle closing above the invalidation level would invalidate this analysis.
For risk management, please don't forget stop loss and capital management
Comment if you have any questions
Thank You

Litecoin’s Sharp Drop—Will the Downtrend Continue?FenzoFx—Litecoin dropped 6.2% yesterday, marking its largest daily range this week. It failed to hold within the High Volume Node box, and selling pressure in the Asian session pushed the price below weekly support to a new low of $89.3.
Currently, LTC/USD is consolidating near the 61.8% Fibonacci retracement level, a key resistance zone. If this level holds, the downtrend may resume, targeting weekly support levels.
Given that Litecoin has already reached its average daily range, no major moves are expected today.

"PEPE 1H Analysis - Breakout Incoming? 📊 *PEPE/USDT – 1H Technical Analysis*
An ascending triangle pattern is developing on the 1-hour timeframe, which often indicates potential bullish momentum.
🟢 Price is approaching a key resistance near *0.00001516*.
🟡 A clean breakout above this level with strong volume may open the door for further upside.
🔴 Watch for *confirmation* before considering any move.
🔍 This chart is purely for educational and analytical purposes.
No financial advice. Do your own research before making any trading decisions.
#PEPE #PEPEUSDT #Crypto #TechnicalAnalysis #TradingView #Altcoins

DOGE|Bearish Triangle Formation On30-Min Chart-Breakdown Ahead?📉 DOGE Bearish Triangle Breakdown | 30-Min Chart
This chart highlights a classic *bearish triangle formation* in DOGE's market cap on the 30-minute timeframe. The pattern shows a series of lower highs with horizontal support around the 32.45B zone.
🔍 Key Observations:
- Pattern: Bearish Triangle
- Resistance: ~34.7B
- Support Zone: ~32.45B
- Target Zone (Post-Breakdown): ~31.3B
A breakdown below the support level could signal further downside movement. However, confirmation is key — traders should watch for volume and candle close below support.
🕒 Timeframe: 30-Minute Chart
📆 Analysis Date: May 29, 2025
---
⚠ *Disclaimer:*
This analysis is shared purely for *educational purposes* and does not constitute financial advice. Please do your own research and risk management before making any trading decisions.

LTC Consolidates After Taking the Buy Side LiquidityFenzoFx—Litecoin surged to $99.5 in the Tokyo session but failed to hold gains, dropping below $97.85. LTC/USD is now consolidating at $96.60, with sellers gaining control.
Since LTC has already exceeded its daily range, a further pullback is expected. The weekly low zone of $93.50–$93.00 could offer a low-risk buy entry.
The bullish outlook remains intact as long as LTC holds above $93.00, with targets at $96.5 and $97.88 this week.

BTC in Bearish Wedge _ Breakdown or Bonus at Demand Zone?🔍 Technical Breakdown:
Bitcoin is currently trading within a *bearish wedge pattern* on the 1H timeframe. Price action is compressing, indicating a potential breakout soon.
⚠ *Bearish Bias:*
If the rising support breaks down, we expect a move toward the *103,000–102,000 support zone*, which has previously acted as strong demand.
📉 *RSI* is trending lower, showing weakening momentum.
📉 *MACD* crossover favors sellers (if applicable).
📌 Watch for reaction in the *reversal zone* to assess bounce or continuation.
---
📊 *Key Levels:*
- Resistance: 108,800 – 109,200
- Support Zone: 103,000 – 102,000
- Reversal Area: 102,000 – 101,800
---
📌 *Trade Plan:*
- Bearish bias below wedge
- Neutral bias inside wedge
- Bullish if price breaks and holds above wedge top
---
💬 Let me know your thoughts below.
🔁 Like, Comment & Follow for more clean setups!
---
📍This is for educational purposes only. Not financial advice.

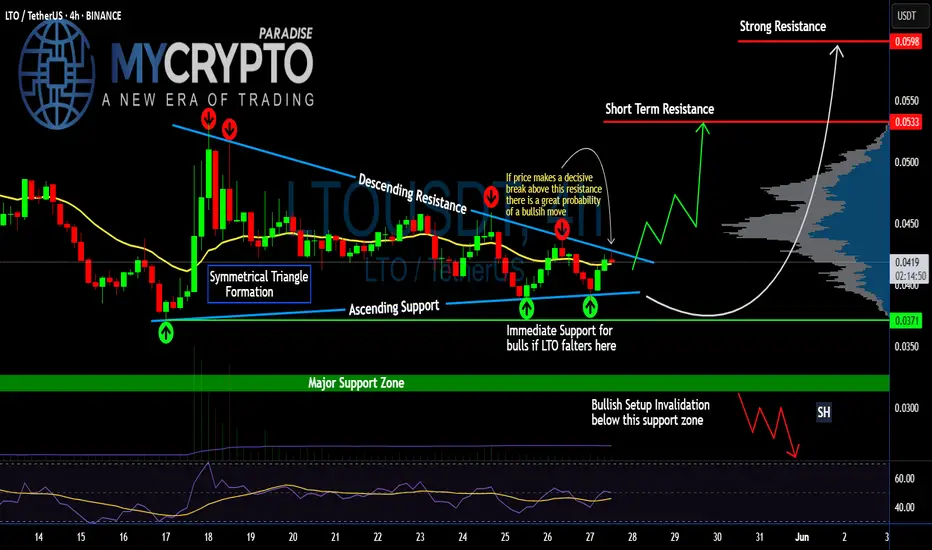
Is #LTO Ready for an Explosive Move or Another Trap Ahead? Yello Paradisers! Are you watching how #LTO is quietly tightening within a triangle while the rest of the market looks away? This might just be the last moment of silence for #LTONetwork:
💎#LTOUSDT is currently consolidating within a clean symmetrical triangle, wedged tightly between a descending resistance and an ascending support trendline. This pattern has already seen multiple touches on both edges, suggesting price is nearing the point of decision.
💎What makes this formation more compelling is how #LTOUSD is holding just above the immediate support at the $0.0371 zone and 20EMA is also acting as support. This area has acted as a launchpad twice already, keeping bullish hopes alive. Price is once again pressing against the upper boundary of the triangle, increasing the odds of a breakout on the next attempt.
💎If bulls manage to push above the descending resistance and we see a confirmed breakout with strong volume, the first upside target sits at $0.0533, which is a key short-term resistance level. From there, momentum could carry the price toward $0.0598, where a strong historical resistance lies based on the volume profile.
💎However, the bullish structure is clearly invalidated on a break below $0.0321. Any decisive move under this support zone would shift the short-term outlook in favor of the bears, potentially opening a path toward lower support.
Discipline, patience, robust strategies, and trading tactics are the only ways you can make it long-term in this market.
MyCryptoParadise
iFeel the success🌴
XRPUSDT 4H | Untested Demand Zone RevisitIn this 4-hour chart analysis of XRPUSDT, I’m focusing on a clear and well-defined untested demand zone between 2.05–2.13 USDT . Unlike the first demand zone (already tested and played out), this second zone has not been retested since its formation, making it a fresh area of interest for a potential long setup.
Why this matters :
Untested demand zones often act as powerful magnets for price when revisited, as they represent areas where large buy orders might be waiting to be filled. Because this zone has not been revisited yet, there’s a higher probability for a bullish reaction when price returns to it.
Key Technical Factors :
✅ The 2.05–2.13 demand zone was formed following a significant bullish impulse that created a clear break of structure to the upside.
✅ Price is currently consolidating above this demand zone and also above a potential bearish CHoCH at 2.0784 . This suggests that the bullish structure is still valid unless price breaks below 2.0784.
✅ My bullish target is 2.65 USDT , where previous highs were formed and potential liquidity exists.
✅ My stop loss is set just below the demand zone, around 2.05 , to protect against a deeper retracement or a shift in market structure.
My Thought Process :
I expect that if price returns to the demand zone, there will be a strong chance for buyers to step in and push the market higher. However, I’m aware that if price breaks below 2.0784 , it would signal a bearish CHoCH and invalidate the long scenario. Therefore, patience is key — I’ll wait for price to either test the zone and react strongly or stay above 2.0784 to keep the bullish bias intact.
Clear Trade Setup :
📌 Entry Zone : 2.05–2.13
🛑 Stop Loss : Below 2.05
🎯 Take Profit : 2.65
🧩 Invalidation : Break below 2.0784
💬 Let me know if you have a similar zone marked out or if you see a different setup! Let’s share ideas and refine our strategies together.

LTC Eyes $97.88: Bullish Momentum HoldsFenzoFx—LTC/USD surged to $95.4 in the London session, stabilizing above Tokyo’s session high. Institutional traders increased long orders, signaling further upside potential. A bullish hammer at $93.5 confirms this critical support level. The expected target is $96.5, followed by $97.88 later this week.
The bullish trend holds unless LTC falls below $93.1, which would invalidate the outlook.

LTC Approaching Key ResistanceFenzoFx—Litecoin (LTC) gained $2.0, reaching $96.9 and approaching weekly highs. During the London session, it is preparing for the next bullish move, with a potential test of $97.88 in New York to complete its range increase.
However, entering long at this level is risky in the short term. A retest of the FVG area ($94.0–$95.0) may occur in the late New York session before further gains.
As long as LTC holds above $93.1, the bullish trend remains intact, with $97.8 as the immediate target and $104.0 expected later this week.

XRP's Path Forward: Will the Uptrend Continue?FenzoFx—XRP (Ripple) rose from $2.266, validating this demand zone for the week. The uptrend stalled at $2.360 during the early London session due to profit-taking and new market participants.
We expect XRP/USD to decline toward the FVG area at $2.30–$2.31 before resuming its uptrend. A break above $2.36 could trigger a move toward $2.38, followed by $2.40.
The bullish outlook is invalidated if XRP falls below the $2.26 support level.
Trade XRP/USD swap free and low spread at FenzoFx.

Litecoin is Profit Taking at Critical Juncture FenzoFx—Litecoin's uptrend started at $92.34 and hit a weekly high of $102.5, tested by buyers in today's Tokyo session. This resistance may be retested in London or New York.
The selling push at $102.5 left a long-wick candlestick but lacked strong volume, indicating buyers are still active. Today's range is 76% of yesterday's move, supporting this outlook.
Bearish View : LTC/USD remains bearish below $103.0. We expect a retest at this level during the London session before declining toward $99.0.
Invalidation : If LTC/USD closes above $103.0, the bullish target shifts to $110.0.

XRP (Ripple) is at a Critical Supply Zone: Will it Fall or Rise?FenzoFx—Ripple (XRP) is testing the resistance level, which expands from $2.40 to $2.46, with the Stochastic Oscillator hinting at an overbought market.
A new bearish wave could emerge if the resistance holds. In this scenario, the price could dip toward the 50.0% Fibonacci retracement level at $2.37, backed by the 50-SMA.
The bearish outlook should be invalidated if XRP/USD exceeds and stabilizes above $2.46.
Trade XRP/USD with low spread, no commission and no swap at FenzoFx.

GRASS Looks Bullish (1D)It appears that a triangle has completed and the B-D resistance line has been broken. Buy/long positions can be considered during pullbacks.
We have identified two entry points for potential entries.
Targets are marked on the chart.
A daily candle closing below the invalidation level will invalidate this analysis.
For risk management, please don't forget stop loss and capital management
When we reach the first target, save some profit and then change the stop to entry
Comment if you have any questions
Thank You

FILUSDT — the formation is repeating, the structure is familiar.Filecoin(FIL) - is a decentralized storage system with the goal of "storing humanity's most important information." During its initial coin offering (ICO) in 2017, the project raised $205 million. The launch was initially planned for mid-2019, but the mainnet launch date was postponed until block 148,888, which occurred on October 15, 2020.
📍 CoinMarketCap : #50
📍 Twitter(X) : 667.3K
🔍 What I observe:
I’ve added the full trading history to the chart for better understanding (the chart on exchanges is cut off). The coin is liquid. I also added the prices for the public and private offerings.
There’s a large horizontal channel, or more specifically, a channel within a channel, which has been active for about 1111 days.
After another drop, a descending wedge formed, and now we are witnessing a breakout of its resistance (a retest is possible).
These patterns are ones I regularly track and trade, based on personal experience accumulated over the years and my strategy.
📊 I’ve plotted the nearest resistances and target prices with movement percentage calculations.
💭 It’s quite possible that this formation in the lower part of the wedge, coinciding with the area of lows on the support of the outer channel, was used to gather liquidity and shake out weak hands.
I also want to point out the large wicks in this zone - a characteristic pattern for accumulation points and subsequent reversals.
______
📌 Not financial advice. Observing structure and recurring phases.
Operate within your strategy and with an awareness of risks.

Litecoin Approaches $104 ResistanceFenzoFx—Litecoin's uptrend from $93.35 continued, reaching $100.00.
Price is now targeting the $103.00–$104.00 resistance zone, where selling pressure may emerge. A pullback to $98.00 is possible if the level holds. Traders should watch for bearish signals during the NY session.
Trade LTC/USD with FenzoFx, Low Spread, No Commission, No Swap.

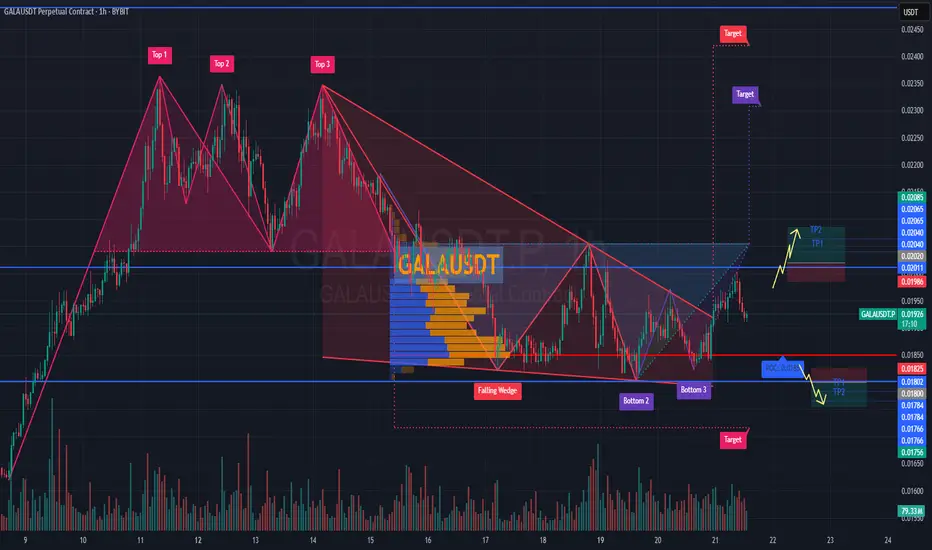
Forecast for #GALAUSDT📉 Forecast for BYBIT:GALAUSDT.P (1H TF)
🕒 Current Situation: The price is in a key decision zone near POC $0.01851, consolidating after a breakout from the Falling Wedge pattern.
➡️ The direction depends on the reaction to this area.
✅ Overview:
➡️ A Triple Bottom (Bottom 1-2-3) pattern is visible — a bullish signal.
➡️ Price broke out of the wedge and is now retesting.
➡️ Two scenarios remain: LONG if support holds or SHORT if it breaks.
📢 Bullish sign: candle wicks down + rising volume on bounce.
🧭 Watch price action and volume near $0.0185–0.0190.
************************
📈 LONG SCENARIO - Conditions: Holding above $0.0190
Entry: BYBIT:GALAUSDT.P from $0.02020
🛡 Stop loss: $0.01986
🎯 TP Targets:
💎 TP 1: $0.02040
💎 TP 2: $0.02065
💎 TP 3: $0.02085
📍 Confirming bullish strength after wedge breakout.
**************************
📉 SHORT SCENARIO - Conditions: Break and close below $0.0185
Entry: BYBIT:GALAUSDT.P from $0.01800
🛡 Stop loss: $0.01825
🎯 TP Targets:
💎 TP 1: $0.01784
💎 TP 2: $0.01766
💎 TP 3: $0.01756
📢 Confirmation: high volume + multiple closes below POC.
⚠️ Losing $0.0185 reactivates the bearish structure toward $0.01700.
🚀 Conclusion: We are in a decision zone.
📍 Hold above POC = bullish setup.
📍 Breakdown = bearish setup.
📢 Wait for confirmation with volume and price reaction BYBIT:GALAUSDT.P
Bearish Reversal Confirmed – BTC Rising Wedge TrapBitcoin (BTCUSD) on the 1H timeframe is displaying a bearish reversal structure after failing to sustain a breakout above key resistance. The recent price action has formed a Rising Wedge Pattern, which typically precedes a downside correction, especially when formed near a key supply zone. Let’s break down the setup:
🔍 Technical Analysis Overview:
🔹 1. Rising Wedge Pattern (Bearish)
A rising wedge is visible near the top of the recent bullish impulse. This wedge is characterized by converging trendlines with higher highs and higher lows, but with diminishing momentum. It typically signals a weakening uptrend and a potential trend reversal or correction once price breaks below the lower wedge boundary.
The breakout to the downside has already begun, confirming bearish intent.
🔹 2. SR Interchange Zone
The blue zone marked in the chart represents a Support-Resistance Interchange (SR Flip). This was previously an area of consolidation and breakout, acting as a key decision zone. Price is expected to retest this zone after the wedge breakdown before continuing further down.
This creates a perfect "Break → Retest → Drop" scenario, often favored by institutional and swing traders.
🔹 3. Consolidation Structure
Before the wedge formation, Bitcoin was stuck in a prolonged consolidation phase. This type of ranging price action often accumulates orders before a breakout. Once broken, these zones serve as magnets for pullbacks or liquidity grabs, and are frequently retested.
🔹 4. Target Zone
The measured move from the rising wedge pattern points to a target near $101,617, which aligns with a previous structural low and a potential demand zone. This area could serve as the next major support level.
🎯 Trade Strategy & Setup:
Entry: After confirmation of breakdown and a clean retest of the SR zone.
Stop Loss (SL): Just above the wedge high and structural resistance (~$108,020).
Target (TP): $101,617 (downside projection based on wedge height and price structure).
📌 Risk-Reward Setup: 1:3+ possible if retest confirms.
🧠 Trader’s Insight:
This setup reflects a common smart-money behavior where price forms a bullish-looking structure (rising wedge), entices buyers, and then traps them with a swift breakdown. The SR retest provides a low-risk shorting opportunity. Patience is key — let price come to your level before entering.
🚨 Risk Note:
If BTC reclaims and holds above the $108,020 level, the bearish thesis may be invalidated. Always wait for confirmation before execution.

LTC Started the Bullish Move We Were ExpectingFenzoFx—Litecoin is holding strong at the $93.35 support, fueling a new bullish wave. Bears tested this level in the last session, but it remained intact.
As long as LTC stays above $93.35, the next target is $100.12, with potential for $102.95 if buying pressure increases.
>>> Trade LTC swap free at FenzoFx.

BTC/USD Eyes Breakout Analysis On Weekly Time Frame.Bitcoin (BTC/USD) Weekly Chart Analysis
After facing a long term resistance at 70,000$ which was significant barrier for Bitcoin in the past, breakout occurred recently, indicating a strong bullish signal and a shift in market structure.
BTC is currently trading around $103,025, facing a new resistance zone.
as the fundamental shows that it may break the resistance again after scalping and we may see the bitcoin at the 120,000$.
But the technical analysis indicates that we may see a retest her to validating the zone now as support.
After the breakout, BTC faced selling pressure around the $105,000–$110,000 range, creating a new resistance zone.
If the resistance is not breached, there is the possibility of a rejection occurring which may result in a retracement down to $79,902, which would be a 28.72% drop.
And i think From there if the resistance isn’t broken out of, then it’s most likely a rejection comes and we can expect a fall back to $79,902 which is a 28.72% retracement.
A breakout above the current resistance could trigger a 46% rally towards the $120,409 target.
This would continue the bullish trend post-breakout, supported by momentum and volume.
we will stay focused here and wait for the breakout of the resistance.
