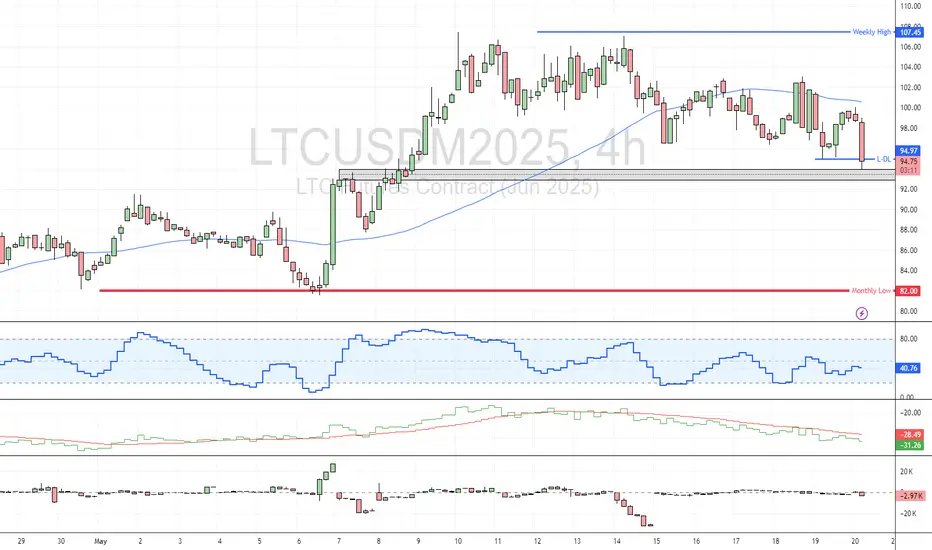
LTC Once Again Presents a Buying Opportunity for ScalpersFenzoFx—Litecoin once again is testing the $93.0 resistance area, while the price has been below the 50-period simple moving average. This level hasn't been fully tested; therefore, if it holds, LTC will likely rise toward the $100.0 resistance.
Please note that a new bearish wave toward $88.0 could develop if LTC/USD dips and stabilizes below the aforementioned support area.
Cryptoanalysis
Ethereum is on Bullish TrackFenzoFx—Ethereum resumed its bullish trend after testing last week's low at 2,340. Price action and candlestick patterns support the current momentum.
The Stochastic Oscillator at 65.0 suggests the market is not overbought, indicating a likely continuation of the uptrend. The next bullish target is last week's high at 2,755.
Bearish Scenario : If ETHUSD falls and holds below 2,340.0, the downtrend from 2,755 may extend to 2,130.0.
Trade ETH/USD at F enzo F x

BMT Rebuy Setup (4H)After the heavy drop in BMT, the price is now approaching demand zones.
If it reaches the green zone, we can consider entering a buy position there.
Risk and capital management should not be forgotten.
Targets are marked on the chart. A daily candle closing below the invalidation level will invalidate this analysis.
For risk management, please don't forget stop loss and capital management
When we reach the first target, save some profit and then change the stop to entry
Comment if you have any questions
Thank You

Solana – Speculative Long Trade Setup Ahead of Narrative CatalysDespite BTC and ETH rallying, SOL has lagged, making it a potential rotation play as capital moves across majors. With attention building around the Internet Capital Markets narrative, SOL may soon attract speculative inflows, especially given its historical performance during sector-wide momentum shifts.
🔹 Entry Zone:
$152 – $154
🎯 Take Profit Targets:
🥇 $172 (local resistance / prior rejection zone)
🥈 $181 (next HTF resistance and possible momentum breakout zone)
🛑 Stop Loss:
$144 (invalidates current short-term bullish structure)

Will #JASMY Retest Trigger a Rebound or a Breakdown? Key LevelsYello Paradisers! Have you prepared yourself for what’s about to unfold with #JASMYUSDT? The #JasmyCoin setup is showing signs of a major move:
💎#JASMYUSD has just completed an impulsive move from the Major Demand Zone around 0.01509 and is currently retesting the ascending support after breaking down from the short-term channel. This is the critical moment where disciplined traders prepare their next move, not after the bounce, but before it.
💎What we’re seeing now is a textbook retest of the ascending support, after an aggressive move from the major demand zone. The price is currently hovering just above the 0.01742 support level, a critical area that aligns with the high-volume node from the visible range volume Profile (VRVP), making this a high-probability reaction zone.
💎If the #JASMY price holds here, and we start seeing buyer strength reclaim the broken ascending channel, this could trigger a sharp bounce targeting the mid-term resistance at 0.02221. Above that, the next magnet will be the major resistance sitting around 0.02512, a level likely to attract profit-taking or even large-scale short entries from smart money.
💎However, failure to hold this support and a confirmed breakdown below the 0.01509 zone would invalidate the bullish structure entirely. In that case, we would be looking for a possible bearish continuation, driving the price toward 0.01400 and possibly lower, where more liquidity pockets remain untapped. That move would also trap late long entries and clean out weak hands — the exact kind of shakeout we warn about.
Play it safe, respect the structure, and let the market come to you!
MyCryptoParadise
iFeel the success🌴

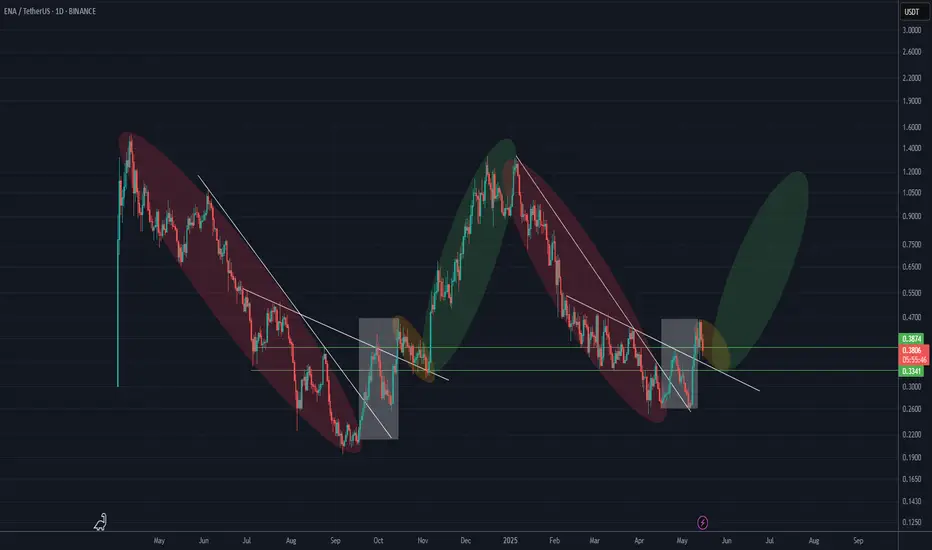
ENA is repeating a bullish fractal (1D)Look at the red, white, yellow, and green boxes in order, and then pay attention to the white trigger lines. You’ll notice that the previous phases | the end of the bearish trend (red box), followed by a bullish move for breakout (white box), then a pullback (yellow box), and finally the main bullish move (green box) | are now repeating.
Also, the price is currently sitting within the trading range marked by the two green lines, which is a key area. After the pullback is completed, a bullish wave is expected to begin, potentially reaching at least around the previous all-time high (ATH).
For risk management, please don't forget stop loss and capital management
Comment if you have any questions
Thank You
BITCOIN Analysis (1H)We have a CHoCH (Change of Character) in the internal structure, and a bullish order block has been cleared. Price is currently within a supply zone, and there is a resistance line above the current price level.
It appears that price is aiming to pull back to lower support zones. These lower zones are fresh and unmitigated, so we expect that upon reaching them, price may bounce back upward toward the previous high.
A 4-hour candle closing above the invalidation level would invalidate this bias.
Do not enter the position without capital management and stop setting
Comment if you have any questions
thank you

Ethereum: 96% of Hedge Funders Were Short on Monday!FenzoFx—Ethereum is trading bearishly, having broken below the 50-SMA. Currently, 96.0% of hedge funders are short, while 52.0 percent of institutional traders were long at the beginning of the week.
If ETHUSD remains under the 50-period moving average, the downtrend may persist, with a potential dip toward the 2,420-dollar support. Retail traders should watch for bullish signals, such as a candlestick pattern, near this level.

Bitcoin Will Like Decline: Institutional Traders are SellingFenzoFx—Bitcoin is overbought, as indicated by the Stochastic Oscillator. Meanwhile, 52 percent of institutional traders are holding sell positions.
If resistance between $106,000 and $109,000 holds, the price may drop toward $96,000.

DYM New Update (3D)It seems a fractal pattern is repeating. The red boxes represent the drop waves, while the green boxes indicate the sideways waves.
It appears that the second drop wave, with over a 92% decline, has ended, and the price has entered a trading range phase.
The price corrections can be considered as opportunities for buy/long positions, and the top of the red box can be regarded as the peak of this wave.
For risk management, please don't forget stop loss and capital management
Comment if you have any questions
Thank You

SWARMS Is Bulish (12H)A key flip zone on the SWARMS chart has been reclaimed.
The trigger line has been broken, and we have a bullish CH (Change of Character) on the chart.
As long as the flip zone holds, price may move toward the identified targets.
A daily candle close below the invalidation level would invalidate this analysis
Do not enter the position without capital management and stop setting
Comment if you have any questions
thank you

BLUR IS Super Bullish (2D)It seems that the price is moving within a diametric pattern, and based on the 3D timeframe, along with the break of the trendline, wave E appears to be completed. The price is now entering wave F of this diametric, which is a bullish wave and could extend up to the red zone.
A key level has also been reclaimed, which further strengthens the bullish outlook.
Targets are marked on the chart.
The analysis will be invalidated if a daily candle closes below the invalidation level.
For risk management, please don't forget stop loss and capital management
Comment if you have any questions
Thank You

LPT Buy/Long Setup (4H)With the strong bullish momentum and upward movement, a swap zone has formed on the chart.
The price is gradually pulling back to this level. We can look for a buy/long position around the green zone.
A daily candle close below the invalidation level will invalidate this analysis.
For risk management, please don't forget stop loss and capital management
Comment if you have any questions
Thank You

Is #XTZ Ready For a Major Breakout or Another Trap Ahead?Yello Paradisers! Are you prepared for what might be one of the sneakiest reversals brewing quietly on #XTZUSDT? Let's see the current setup of #Tezos:
💎#XTZ is trying to break out of a descending broadening wedge formation, a setup that typically signals the end of a corrective structure and the potential beginning of a major impulsive move. We’re likely witnessing the very first wave of this new impulse, and what happens next will depend entirely on how the price reacts to the overhead dynamic resistance.
💎The 1st impulsive wave appears to be nearing completion, and based on structure and current momentum, a minor pullback is both expected and healthy. This retracement will likely serve as a reset before the next leg higher begins, offering a potential entry for those who missed the breakout. However, we do not expect this correction to break below the origin of the first wave — doing so would undermine the integrity of the new trend.
💎Currently, the #XTZUSD is facing strong resistance from the EMA, which it must convincingly break and reclaim. This EMA level has repeatedly acted as a lid on price action, and until it’s cleared, any upside move remains tentative. However, if buyers step in with real volume, we could see a rapid acceleration toward the mid-term resistance at $0.916. That level has historically marked a shift in market control. And beyond it, the next major resistance lies at $1.134, a key supply zone that could trigger heavy distribution.
💎On the downside, the structure remains clean. The $0.491 – $0.516 zone is now our major support, and it must hold. If the price falls below this support and closes with weakness, it will invalidate the current bullish thesis and likely lead to a deeper correction.
Play it safe, respect the structure, and let the market come to you!
MyCryptoParadise
iFeel the success🌴

ASTR Buy/Long Setup (12H)Two major trigger lines have been broken, and the price is currently sitting at a key level.
A bullish CH (Change of Character) is visible on the chart.
If the demand zone holds, the price may move toward the targets marked on the chart.
A daily candle closing below the invalidation level will invalidate this analysis.
Do not enter the position without capital management and stop setting
Comment if you have any questions
thank you

NOTUSDT – broken faith and potential for a reversalNotcoin(NOT) - is a Web3 gaming project launched on January 1 within the TON ecosystem. Technically, Notcoin is an application inside the Telegram messenger. The project attracted users' attention through an announced token airdrop. The developers invited users to mine tokens simply by tapping on their smartphone screens. Within a few months, the game's audience exceeded 35 million people.
📍CoinMarketCap: #170
📍Twitter(X): 2.4M
________________
The NOT token dropped by -94.5% following its listing and a wave of hype. Such a decline is typically accompanied by a loss of faith in its growth and potential.
🔍 What I observe:
The price is moving within a descending channel.
A reversal pattern, the "inverse head and shoulders," is forming in the current zone, with a potential upside of around ~75%.
The key point is a breakout above the outer resistance of the channel.
The token has high liquidity.
NOT is traded on all major exchanges, including the top-tier ones.
It has excellent access to marketing and PR, which is important for pump scenarios.
💭 All key levels, possible scenarios, and targets are marked on the chart. Take them into account when building your own strategy.
________
📌 Not financial advice. Personal view and experience.

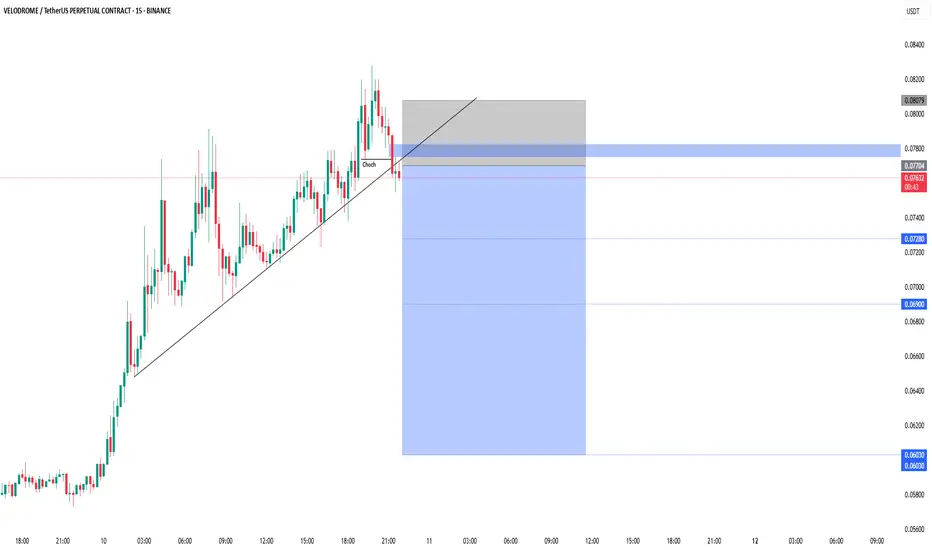
VELODROME/USDT — Trendline Break, Down is coming??Price has broken the ascending trendline and formed a clear Change of Character (ChoCh) to the downside.
This retest offers a potential short opportunity if rejection confirms from this zone.
Entry: Around 0.0770–0.0780
Stoploss: Above 0.0807
Target Levels:
• TP1: 0.0728
• TP2: 0.0690
• TP3: 0.0630
A break below 0.0728 could accelerate momentum to the downside. Waiting for price action confirmation is recommended before entry.
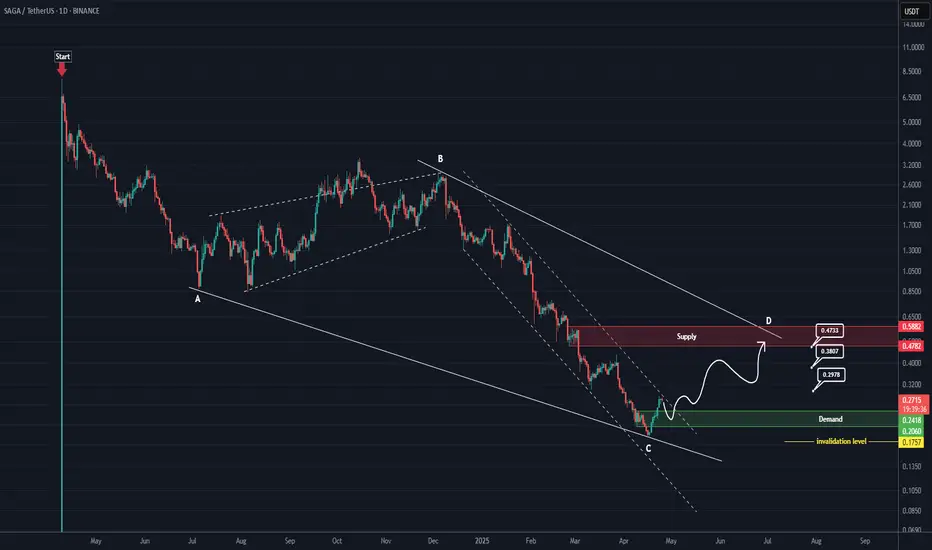
SAGA RoadMap (1D)From the point where we placed the red arrow on the chart, it appears that SAGA's correction has begun.
This correction seems to be either a diametric or a symmetrical pattern. Now, considering the extended duration of wave C, its relative comparison with the other waves, the heavy drop, and the formation of a demand zone at the bottom, wave C seems to have ended.
A rebuy can be considered on the pullback to the green zone.
The targets are marked on the chart.
A daily candle closing below the invalidation level will invalidate this analysis.
For risk management, please don't forget stop loss and capital management
Comment if you have any questions
Thank You
SYS looks very bullish (1D)It seems that a diametric pattern has completed, and the price has reclaimed a key level. A pullback to this level is expected to hold as support, potentially leading the price toward higher zones.
The targets are marked on the chart, and as long as the green zone is maintained, a move toward those targets is expected.
A daily candle closing below the invalidation level would invalidate this analysis.
For risk management, please don't forget stop loss and capital management
When we reach the first target, save some profit and then change the stop to entry
Comment if you have any questions
Thank You

DEGEN Buy/Long Setup (4H)A significant trendline has been broken. The price has formed a bullish CH (Change of Character) on the chart. In addition to the identified support zone, a key level also passes through this area, which the price has successfully retested.
As long as the green zone holds, a move toward the targets is expected.
The closure of a daily candle below the invalidation level would negate this analysis.
Do not enter the position without capital management and stop setting
Comment if you have any questions
thank you

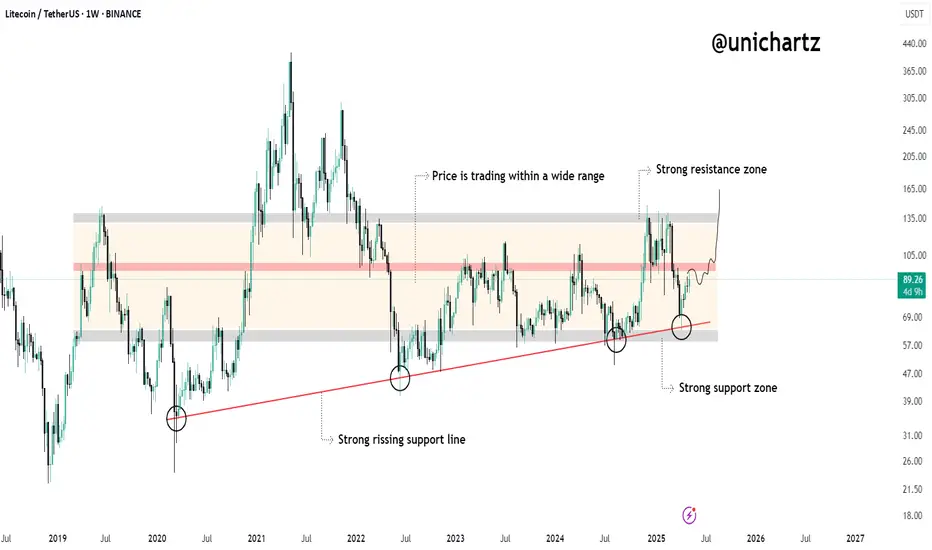
Is $LTC Lining Up for a Breakout Move?LTCUSDT is moving inside a wide range that's been respected for over 3 years — with price bouncing between a strong support zone ($50–$60) and a strong resistance zone ($130–$145).
Key Highlights:
Strong Support Zone:
Price recently bounced off a long-term horizontal support area near $60 — the same zone that sparked multiple rallies in the past.
Rising Trendline:
A clean, rising diagonal support has held since 2020 — each retest has led to upward momentum. The latest bounce confirms this structure is still valid.
Current Structure:
Price is climbing from the base of the range. If it breaks through the mid-zone and holds, we could see an attempt toward the upper resistance around $130+.
DYOR, NFA
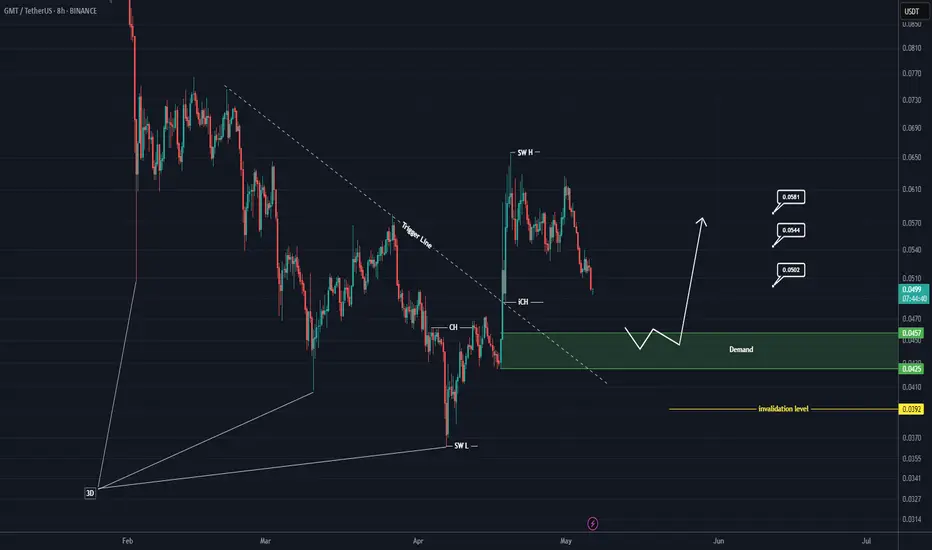
GMT Rebuy Setup (8H)Given the broken 3D pattern at the bottom and the trendline break, our demand zone is considered highly valuable. Therefore, we will look to enter a buy position within the green zone, which has been the origin of a strong move.
The price is currently in a support zone, but we will only enter a position if it reaches the green zone marked on the chart.
A daily candle closing below the invalidation level will invalidate this analysis.
For risk management, please don't forget stop loss and capital management
When we reach the first target, save some profit and then change the stop to entry
Comment if you have any questions
Thank You
No Altseason Until BTC.D Hits 70%?Bitcoin Dominance (BTC.D) is currently climbing and approaching a major resistance zone between 71.38% and 73.06%. This area has proven to be a strong turning point in the past, acting as a top back in December 2017, September 2019, and again in 2021. These repeated rejections suggest that this zone is likely to remain a key resistance.
Right now, BTC.D is sitting around 64.66% and still has room to push higher. However, if it enters the resistance zone again, there’s a strong chance it may face selling pressure and start reversing. The white arrow on the chart shows the possible move into resistance, while the red projection outlines the expected rejection and potential decline back toward the 54.63% level—another important support zone from the past.
In simple terms, BTC dominance might be nearing its peak, and once it reaches the upper zone, we could start seeing altcoins gain more strength as dominance falls. This chart helps anticipate when the market might shift from BTC-led rallies to altcoin outperformance.
