The Spring of OM: Wyckoff Signals a Rebirth After the CrashMANTRA ( BYBIT:OMUSDT.P ) Technical Analysis: Post-Crash Recovery and Wyckoff Accumulation Insights
TradingView
On April 13, 2025, MANTRA (OM) experienced a significant price drop, declining approximately 88% within 24 hours. This sharp downturn was attributed to a combination of factors, including market-wide volatility and potential large-scale sell-offs. Despite this abrupt decline, technical indicators suggest that OM may be entering a Wyckoff Accumulation Phase, presenting potential investment opportunities.
Understanding the Recent Price Movement
Following the crash, OM's price stabilized around $0.70, with a 24-hour trading volume exceeding $2.3 billion. The Relative Strength Index (RSI) and Commodity Channel Index (CCI) indicators both entered oversold territories, indicating a potential for price reversal.
CoinMarketCap
CentralCharts
Wyckoff Accumulation Phase Analysis
The Wyckoff Method identifies specific phases in market cycles, with the Accumulation Phase characterized by large investors ("smart money") buying assets at lower prices. Key features of this phase include:
Selling Climax (SC): A sharp price decline with high volume, as seen in OM's recent drop.
TradingView
Automatic Rally (AR): A quick rebound following the SC, indicating initial buying interest.
Secondary Test (ST): Price revisits the SC level to test support, often with lower volume.
Spring: A false breakout below support levels to shake out weak holders, potentially observed in OM's price action.
Mudrex
Sign of Strength (SOS): A strong price increase with higher volume, signaling the end of accumulation.
Currently, OM's price behavior aligns with the early stages of this accumulation pattern.
Investment Considerations
For investors considering entry points:
Risk Tolerance: Given the recent volatility, only risk capital should be used.
Technical Confirmation: Await confirmation of the SOS phase before significant investment.
Volume Analysis: Monitor trading volumes for signs of increased institutional interest.
Understanding the Wyckoff Accumulation Phase can provide insights into potential market reversals.
Cryptocrash

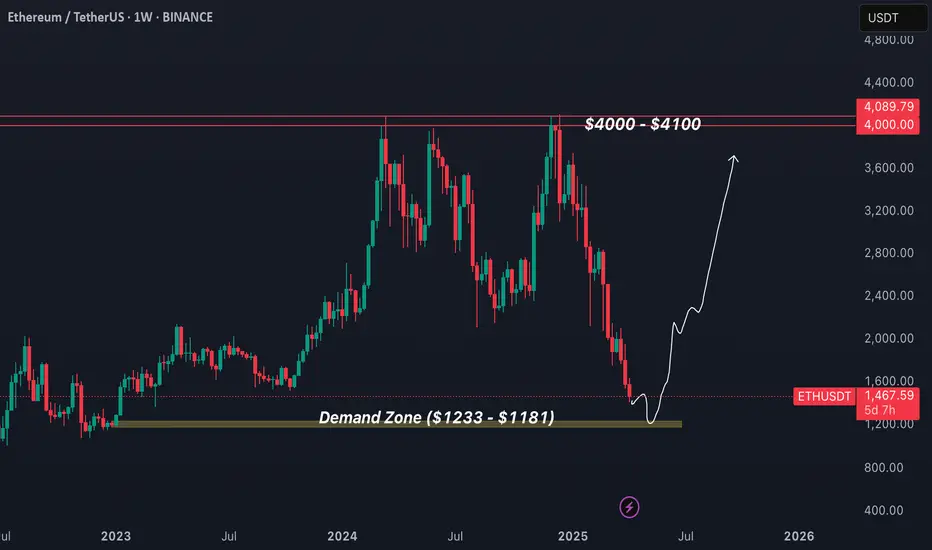
Ethereum Weekly Analysis #ETH can dump till it's Demand Zone Area of ($1233 - $1181) before upward momentum.
TOTAL3 UPDATE!!! GET YOUR ALTS BAGS READY !!TOTAL3 has reached PRZ zone of bat pattern aligning with elliott wave count. Frrom here we may see major shift in alts. Get ready for the ultimate altseason boyz!!!

BITCOIN ($BTC) DIPS TO $82K—FEAR OR FORTUNE?BITCOIN ( CRYPTOCAP:BTC ) DIPS TO GETTEX:82K —FEAR OR FORTUNE?
(1/9)
Good Morning, TradingView! Bitcoin ( CRYPTOCAP:BTC ) slumped to $ 82,000, lowest since Nov ‘24 💰 Market’s glum, let’s unpack this crypto dip! 🌐
(2/9) – PRICE SLIDE
• Drop: $ 82K, 20% off $ 109K high 📊
• Month: Altcoins down 30%+ 💧
• Fear Index: 10/100, rock bottom 😟
CRYPTOCAP:BTC ’s shivering, gloom’s thick!
(3/9) – TECH TELL
• 200-Day MA: $ 81,500, support holds 🌟
• RSI: 28, oversold, bounce hint 🚀
• Past: Aug ‘24 $ 49K to $ 100K 📈
CRYPTOCAP:BTC ’s teetering, rebound or rubble?
(4/9) – MARKET MOOD
• Fear: Lowest since FTX ‘22, $ 16K 🌍
• History: Extreme fear sparks rallies 🌞
• Outflows: $ 1B from ETFs, trade woes 💼
CRYPTOCAP:BTC ’s testing, panic or patience?
(5/9) – RISKS IN PLAY
• Trump: Tariff talk, no crypto juice ⚠️
• Volatility: Bear turn stings 🐻
• Stablecoins: Inflows, sideline cash 🔒
CRYPTOCAP:BTC ’s wobbly, can it dodge the funk?
(6/9) – SWOT: STRENGTHS
• Base: $ 82K holds, tough nut 💪
• Past: Fear flips to gold, $ 100K+ 🏋️
• Liquidity: Central banks ease 🌿
CRYPTOCAP:BTC ’s gritty, battle-tested!
(7/9) – SWOT: WEAKNESSES & OPPORTUNITIES
• Weaknesses: Sentiment sinks 😕
• Opportunities: Fear buys, rate cuts 🌏
Can CRYPTOCAP:BTC vault past the blues?
(8/9) – CRYPTOCAP:BTC ’s $ 82K dip, what’s your take?
1️⃣ Bullish, $ 100K rebound soon 😎
2️⃣ Neutral, Holds, risks linger 🤷
3️⃣ Bearish, $ 70K slide looms 😞
Vote below! 🗳️👇
(9/9) – FINAL TAKEAWAY
CRYPTOCAP:BTC ’s $ 82K slump spooks, fear at 10 🪙 $ 1B ETF outflows sting, but history hints bounce, gem or gloom?

The Future of Meme CoinsWhat does the future hold for meme coins?
I often think meme coins caused the collapse of many "serious" altcoin projects and now the flood of new meme coins will do the same to large cap meme coins.
Too much money being spread thin across them all. Large/Mid cap meme coins like Shiba, Pepe, Doge, Fartcoin, have all been bearish since mid-December 2024 and mid January 2025. TrumpCoin was the nail in the coffin.
This is a nose dive right back to the last support area (white line), where you could potentially long up to the new resistance. (pink line)

BTC remains bearish next targets 57.7k and 56kIn this video, I provide an update on my previous trading analysis.
I'll discuss the current targets for the bearish scenario and highlight the key levels to watch. Additionally, I present a bullish counter-idea and explain where the invalidation of the bearish thesis might occur. This way, you'll be well-prepared no matter which direction the market takes. Stay tuned to catch all the important details!

BTC SHORT The chart indicates a potential move where Bitcoin (BTC) is currently testing an area of interest around 60,715.9 USDT. The price is approaching a key resistance zone marked as MMSM, which could provide a selling opportunity if the price fails to break above it convincingly.
Trade Setup:
Stop Loss: Place a stop loss just above the 62,500 USDT level to protect against potential false breakouts above the resistance zone.
The initial target for this trade would be around the 55,940.7 USDT level, where there is an imbalance wick, which could serve as the first point of profit-taking. Further downside targets could be around the 48,889.4 USDT level, representing a more extended move.
Risk/Reward: This setup offers a favorable risk/reward ratio, as the downside potential outweighs the risk if the resistance level holds.
Additional Notes:
- If price breaks and holds above the 62,121.2 USDT level, reconsider the short idea as it would invalidate the current bearish setup/structure.

BTC Bullish Target $70K vs. Bearish Drop to $41K | ICTIn this video, I dive deep into two potential scenarios for the market:
A bullish scenario targeting $70,000 and a bearish scenario pointing towards $41,000.
I explore the concept of a smart money reversal and the market maker sell model to provide a detailed analysis of possible price movements.
Additionally, I discuss the bearish price structure and what it could mean for the market in the near term. Whether you're bullish or bearish, this analysis will help you understand the key levels to watch and the strategies that may unfold.
I would love to get some feedback! 🔥

BTC SHORT TO 41kTrade Rationale:
Price has reached a significant resistance level, and there is a clear bearish structure indicating potential downside movement. The current setup offers a high risk/reward ratio, targeting a return to the previous low, with a stop loss placed just above the recent high.
This trade is based on a continuation of the bearish trend observed over the past several weeks.

Nifty , BankNifty and Bitcoin UpdateHello Traders,
Checkout the latest update on Nifty , BankNifty and Bitcoin. I hope we have updated you in very advance about this downfall and you all have saved your funds

IO/USDT NEW INCREASE VOLUMEIO can show in the coming time new confirmation depending on volume.
The coin shows interesting signals for new uptrend
we will follow the trend for more.
New updates follow this chart view.

BTC Nuked again. What to expect now?BTC with a massive downside move into a Sellside Liquidity Pool.
Many altcoins have hit monthly lows.
Fear and greed indicator showing Fear right now.
Is Bitcoin going lower? What can we expect?
I will discuss this in the Video.

Altcoins ready to dump soon.The market cap saw a significant rise from 2017 to 2021, peaking above 1.2T USD.
This was followed by a sharp decline, and subsequent fluctuations between 2021 and 2023.
There is a prominent dip into a highlighted blue zone around late 2022 to early 2023, suggesting a strong support level.
Future Projections (2024-2031):
The projection line indicates a rise in market cap approaching 800B in 2024-2025, touching a region marked as "Buyside Liquidity."
A recommended shorting point is marked in early 2025, suggesting a peak before a decline.
The market cap is projected to dip back into the blue support zone by 2026.
Another significant drop is anticipated around 2027, reaching another highlighted grey support zone, where a buy opportunity is suggested.
Annotations
Short here: Indicated near the projected peak in 2025, suggesting this as an optimal point to short the market.
Buy here: Indicated in the projected dip around 2027, suggesting this as an optimal point to buy.
This analysis can guide investors in timing their trades based on historical trends and projected market movements.

BTC at the bottom of week range!Bitcoin hit the bottom of the range ✅ Alarm was right pointing for range bottom at ~58k, as BTC dipped to 58414 on that move.
Now the main question - is it over? Shortly - if you are a respected TA, you can't say so yet. Why? Because week candle is only developing, so we won't have any clarity till next week close at least. Day candle shown nice bearish impulse with long tail, which can be taken as a first step of a bounce pattern, but to confirm it we'll need another 1-2 Day candle to close. Which brings us back to the idea, that this week it's all about guessing, but no mindful conclusions.
Week close above ~60622-59600 will increase chances for a bounce from range bottom. Close below will keep momentum to dip lower. That is the only thing we can say now for sure.
Nearest liquidity pools:
above - 61840 / 62440 / 63260 / 64920
below - 60235 / 59820 / 59460 / 58040
Lines on the chart:
🔸67577 - May close
🔸63195 - week open
🔸60651 - April close
🔸59112 - March low
🔸56537 - May low
🔸53245 - Nov'21 low
Trend: D 🔽 W 🔼 M 🔼
🤑 F&G: 30 < 51 < 53 < 63 < 64

BITCOIN Short Term relief possbile - Still BEARISHIn this Video I am talking about the High Time Frame and Lower Timeframe view.
I explain what potential trades we are currently looking for.

NOT is not over yetBINANCE:NOTUSDT.P is heading towards 4H FVG around 0.0145 and will dip there in any case before the bounce. Its a good level and correlates with developing Day 20SMA. Wicks below possible even in bullish scenario and might reach 0.012-0.013 zone - this is a good zone to look for long entries.
Its not short signal. I'd rather look for those dips for longs, as now its too late to short with proper risk reward.
If I'm wrong and there will be no dip, condition to return back to bullishness is acceptance above developing VAL (around 0.0186).
Everything else depends on BTCUSDT chart, which looks heavy on week timeframe and if close below 67800 might continue falling lower.

A Speed Bump or a Sign of Things to Come?The recent dip in the crypto market, triggered by escalating tensions between Iran and Israel, serves as a stark reminder of the market's volatility. Bitcoin prices plummeted to GETTEX:59K before a swift recovery, leaving many investors wondering: was this a blip on the radar or a harbinger of things to come?
**The Iran-Israel Factor:**
Geopolitical tensions have historically impacted traditional markets, and crypto appears increasingly susceptible as well. The news of a potential war undoubtedly spooked investors, leading to a sell-off. However, the market's swift bounce back suggests that the long-term outlook might remain bullish.
**Bull Run on Hold?**
The upcoming Bitcoin halving, scheduled for sometime in 2024, is a highly anticipated event that often precedes bull runs. While the recent crash might cause a temporary setback, historical data suggests that these halvings often lead to price increases due to a reduced supply of new Bitcoins.
**Full-Fledged War? A Bearish Threat?**
A full-blown war would undoubtedly have a significant negative impact on global markets, including crypto. Increased risk aversion and economic uncertainty could trigger a prolonged bear market. It's important to monitor the situation closely and adjust your strategy accordingly.
**The Power of Diversification:**
Regardless of the bull or bear market predictions, diversification remains a crucial strategy. Spreading your investments across various cryptocurrencies and asset classes can help mitigate risk.
**The Final Word: It's All Speculation**
The future of the crypto market, especially in light of geopolitical events, is inherently uncertain. While a bull run is still possible after the halving, external factors can always play a role.
Here's where **you** come in! Join the discussion in the comments below!** Share your thoughts:
* Do you think the recent crash is a sign of a larger correction?
* How will a potential full-fledged war impact the crypto market?
* What strategies are you using to navigate the current market climate?
**By fostering a community of informed investors, we can all navigate the ever-evolving world of cryptocurrency.**
**Disclaimer:** This is for informational purposes only and should not be considered financial advice. Always conduct your own research and consult with a financial professional before making any investment decisions.

Quick Bitcoin UpdateHello Traders,
Checkout the latest bitcoin update. When everyone was in fear we again told you to enter in market as this is the oppurtunity and you can see if you enter in any coin 12 hours ago then you are earning easy 10% returns (without leverage).
Now it's on you whom you want to follow , the one's who goes with where market goes and post late updates or with Crypto Blast who always post quick updates and also post levels in well advance.

$MYRO, how low it could go?We could see a selling pressure at .37, where price reversed and plummeted by almost 40% impacted by the recent market drop.
If we can get some good reaction around .22 to .20 area (local support), there's a chance we retest previous support .26 to .27
However, any rejection we get at this level (.26 to .27) is a short opportunity targeting .16 to .14


Bitcoin Crash!? Why? Where are we headed?BTCUSDT is headed for a dive. Retracing 20% from ATHs. I want to see 59k and below on BTC. I will start accumulating positions once BTC reaches that level

Open your fkin eyes! BTCI see lot of bullish tweet. Lot of leverage longs at top. Lot of big influencers calling for new highs. I have seen this FOMO, this euphoria, this sentiment almost 3 years ago. I remember it. And now i see the same pattern. It's not perfect. But it's pretty the same. When BTC will start to drop? 14-15 Feb. When it will bottom? Mid April. When you seen it? Here. Now save you ass and don't long Bitcoin.

BTC Will Dump from 43.4k ZoneShared my Idea about BTC Dump BTC Have Huge Funding on different exchanges its Time to be Careful with Longs
Entry - 43.4k to 43.5k
SL - 43.8k
Target :
42.5k
41.8k
40.4k
