BITCOIN This is what happened on the last 1D MA100 double test.Bitcoin (BTCUSD) hit yesterday its 1D MA100 (green trend-line) for the second time in 6 days and is reacting on a bullish note early today following basically 4 straight flat 1D candles.
We mentioned the importance of the 1D MA100 as a Bull Cycle demand level on previous analyses. What we didn't discuss though is how BTC behaved the last time we had a 1D MA100 double test on such short time-frame.
As you can see, the last time Bitcoin had a 1D MA100 Double Test within a 1-week time-frame was on October 10 2024 and the one before that on May 08 2024. The common characteristics of both those fractals was that the 1D RSI held the 43.00 level (just like it's doing today) and the price rebounded to hit the respective Resistance Zone from the previous High. Channel Up patterns emerged on both occasions, the difference is that in May 2024 BTC got rejected on the Resistance Zone, while on October 2024 it broke to the upside aggressively following the U.S. elections.
As a result, we can target at least $108k on the short-term. Since long-term Accumulation Phases like March - October 2024 only take place two times at most during each Cycle (and we've already had this twice already), we give more probabilities to an extended rally like November - December to a new All Time High. Long-term traders may seek to sell these positions when the 1D RSI approaches the 85.00 profit taking level (overbought).
But what do you think? Is BTC starting a rally to at least $108000? Feel free to let us know in the comments section below!
-------------------------------------------------------------------------------
** Please LIKE 👍, FOLLOW ✅, SHARE 🙌 and COMMENT ✍ if you enjoy this idea! Also share your ideas and charts in the comments section below! This is best way to keep it relevant, support us, keep the content here free and allow the idea to reach as many people as possible. **
-------------------------------------------------------------------------------
💸💸💸💸💸💸
👇 👇 👇 👇 👇 👇
Cryptocurrencies

BTC - Key Zones & Liquidity InsightsBINANCE:BTCUSDT is currently oscillating within a new trading range, establishing a trustable support zone while facing a weaker resistance trendline and resistance zone. Given this setup, a breakout isn’t the primary expectation just yet.
🔹 Key Observations:
Support Zone Strength: The support zone is stronger than the resistance, making it less likely for BTC to break downward easily.
Resistance Weakness: The resistance trendline and zone appear weaker, meaning any rejection could be temporary.
Liquidity Perspective: As seen on the liquidity chart, there’s favorable liquidity above the resistance zone, increasing the probability of a short-term push higher to hunt liquidity.
💡 Potential Scenarios:
1️⃣ BTC could move toward the resistance zone, tapping into liquidity before reacting.
2️⃣ If buyers step in aggressively, a short-term liquidity grab above resistance might trigger further upside.
3️⃣ Failure to reclaim key levels could lead to continued range-bound movement.
🚀 Stay ready for the next Bitcoin move! Follow for real-time updates and professional insights! 🔔

SOLUSD Triple bottom initiates new rally to $380.Solana (SOLUSD) has been trading within a Channel Up pattern since the July 29 2024 High. The recent February 03 2025 Low isn't just a Higher Low on the Channel Up but also a Triple Bottom on the Support Zone and a Double Bottom on the 1D MA200 (orange trend-line).
Needless to say, this shows that technically this is a level of high demand, thus long-term Support and within the next 30 days maximum, it should initiate the new Bullish Leg of the pattern, similar to the September 06 2024 Low. Even the 1D RSI sequences between those fractals are identical.
Since the previous Bullish Leg rose be +119.43%, we see no reason to do otherwise now, hence our new long-term Target is set a $380.00.
-------------------------------------------------------------------------------
** Please LIKE 👍, FOLLOW ✅, SHARE 🙌 and COMMENT ✍ if you enjoy this idea! Also share your ideas and charts in the comments section below! This is best way to keep it relevant, support us, keep the content here free and allow the idea to reach as many people as possible. **
-------------------------------------------------------------------------------
💸💸💸💸💸💸
👇 👇 👇 👇 👇 👇

BITCOIN Pure 2-month symmetry targets $102.5k and $108k.Bitcoin (BTCUSD) has been practically consolidating for more than 2 months (since November 22 2024) within a Rectangle pattern and what's more striking is the amazing symmetry it has been displaying.
Right now the price has broken above a Lower Highs trend-line following the February 03 2025 Low near the Rectangle's Bottom and every time it has done so within this pattern, a rally towards the Higher Highs trend-line started.
It is interesting to mention that so far the range from the first High to the last High of this trend-line has been 101 4H candles (roughly 25 days). Since on the new (blue) phase that started on the February 03 High, we had our first, we can expect it to conclude near the top of the Rectangle by February 26.
This technical symmetry can help us set our next short-term Targets. Target 1 is at $102500, just below Symmetrical Resistance Zone 1 and Target 2 is at $108000, just below Symmetrical Resistance Zone 2 (top of the Rectangle as mentioned). Needless to say, the current 4H RSI pattern resembles the bullish break-outs above both of the previous first Lower Highs fractals.
Do you think this symmetry will play out in the same way once again? Feel free to let us know in the comments section below!
-------------------------------------------------------------------------------
** Please LIKE 👍, FOLLOW ✅, SHARE 🙌 and COMMENT ✍ if you enjoy this idea! Also share your ideas and charts in the comments section below! This is best way to keep it relevant, support us, keep the content here free and allow the idea to reach as many people as possible. **
-------------------------------------------------------------------------------
Disclosure: I am part of Trade Nation's Influencer program and receive a monthly fee for using their TradingView charts in my analysis.
💸💸💸💸💸💸
👇 👇 👇 👇 👇 👇

BITCOIN You can't get a more bullish symmetry than this.Bitcoin (BTCUSD) marginally breached its 1D MA100 (green trend-line) two days ago and immediately rebounded in a mirror price action like last year's bounce of January 23 2024. We analyzed this on our previous publication but what we bring you today is the amazing RSI based symmetry of the two fractals.
The dominant long-term pattern remains a Channel Up and this is what will most likely guide BTC to the finish line and the Top of this Cycle. This pattern displays two (blue) Accumulation Channels, which is the formation we're currently at.
In fact Bitcoin has most likely started the process of breaking above this Channel as the January 23 2024 1D MA100 bounce was the starting point of the Bullish Leg (green) that made a Higher High at the top of the long-term Channel Up.
As mentioned, what's incredibly interesting is the 1D RSI symmetry between the two Accumulation Channels. As you can see on the current Accumulation Channel, the time between the 2nd RSI Lower High (blue circle) and 3rd (yellow circle) was 25 days and between the 3rd and 4th (red circle) was 32 days. The respective ranges on the previous Accumulation Channel were 25 and 34 days, which showcase a striking degree of symmetry.
The Bullish Leg peaked on the 2.618 Fibonacci extension from the last High (red circle) and as a result, we can expect the new rally to follow an equally symmetric/ proportional rise and target the new 2.618 Fib at $145000.
Can this be the case by March/ April 2025 or is it to soon? Feel free to let us know in the comments section below!
-------------------------------------------------------------------------------
** Please LIKE 👍, FOLLOW ✅, SHARE 🙌 and COMMENT ✍ if you enjoy this idea! Also share your ideas and charts in the comments section below! This is best way to keep it relevant, support us, keep the content here free and allow the idea to reach as many people as possible. **
-------------------------------------------------------------------------------
💸💸💸💸💸💸
👇 👇 👇 👇 👇 👇

TONUSD Be ready for $12.00 this Summer.It has been almost 5 months (September 12, see chart below) since the last time we analyzed Toncoin (TONUSD) and made our bearish call:
As you can see, it successfully hit our 3.50 Target and the 0.618 Fibonacci level. With that being a direct contact with the bottom (Higher Lows trend-line) of the 1-year Channel Up, while the 1D RSI got oversold (<30.00), we expect the new Bullish Leg to start.
All previous oversold RSI hits (with the exception of Aug 05 2024) have been bottoms and with +300% being a standard rise within this pattern, we expect to see $12.000 as the next High.
-------------------------------------------------------------------------------
** Please LIKE 👍, FOLLOW ✅, SHARE 🙌 and COMMENT ✍ if you enjoy this idea! Also share your ideas and charts in the comments section below! This is best way to keep it relevant, support us, keep the content here free and allow the idea to reach as many people as possible. **
-------------------------------------------------------------------------------
💸💸💸💸💸💸
👇 👇 👇 👇 👇 👇

HBARUSD Few consolidation days, then $0.65Hedera (HBARUSD) breached through its 1D MA100 (green trend-line) yesterday but recovered immediately as the 1D RSI almost turned oversold (<30.00). We expect a few more days of consolidation and buy accumulation, similar to the April 13 2024 consolidation on the 1D MA200 (orange trend-line), before the next Bullish Leg.
On the April fractal, the price rebounded to the 1.236 Fibonacci extension to make a peak on the Higher Highs trend-line. With the two fractals having also similar 1D RSI patterns, similar rebound would place our Target at 0.6500.
-------------------------------------------------------------------------------
** Please LIKE 👍, FOLLOW ✅, SHARE 🙌 and COMMENT ✍ if you enjoy this idea! Also share your ideas and charts in the comments section below! This is best way to keep it relevant, support us, keep the content here free and allow the idea to reach as many people as possible. **
-------------------------------------------------------------------------------
💸💸💸💸💸💸
👇 👇 👇 👇 👇 👇

DOGEUSD Giant Bull Flag or Channel Down rebound?Dogecoin (DOGEUSD) is trading within a 2-month Channel Down, which on the wider scale may be a Bull Flag for this Bull Cycle. Regardless of the time-frame, the price got sold aggressively today and hit its 1D MA200 (orange trend-line) for the first time since October 25 2024.
If that's just a 1D Channel Down, then today's Low is technically a bottom on the pattern's Lower Lows trend-line. The previous one (December 20 2024), rebounded towards almost the 0.786 Fibonacci retracement level.
With an oversold (<30.00) 1D RSI for the first time since August 07 2024 making the buy opportunity even stronger, we expect the new Bullish Leg to target 0.3800 (just below the 0.786 Fib).
-------------------------------------------------------------------------------
** Please LIKE 👍, FOLLOW ✅, SHARE 🙌 and COMMENT ✍ if you enjoy this idea! Also share your ideas and charts in the comments section below! This is best way to keep it relevant, support us, keep the content here free and allow the idea to reach as many people as possible. **
-------------------------------------------------------------------------------
💸💸💸💸💸💸
👇 👇 👇 👇 👇 👇

BITCOIN Can a 1D MA100 rebound reverse the 'Tariffs narrative'?Just a week ago (January 27, see char below) we made a case of why it was essential for Bitcoin (BTCUSD) to test and rebound on its 1D MA100 (green trend-line), if the market was to find the necessary Support to move it forward through the rest of the year and the Bull Cycle:
Well BTC went on to confirm our expectation and hit the 1D MA100 for the first time in almost 4 months (since October 11 2024).
That analysis was focused on the current Bull Cycle (2023 - 2025) and the recurring 1D MA100 rebound sequence within the 2-year Channel Up, which has so far provide its Higher High both times.
Today's analysis examines if this is a pattern that emerged and held during the previous Bull Cycles as well. The results are eye opening.
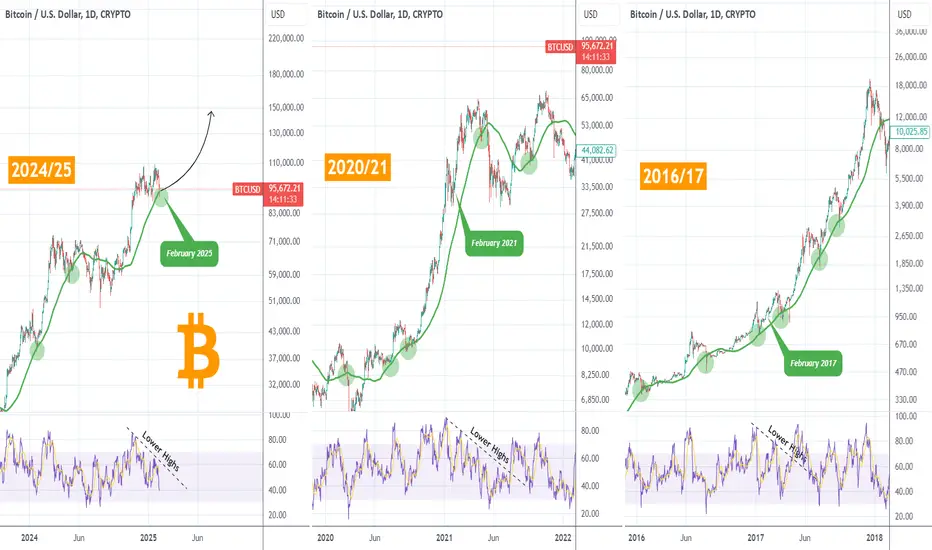
During the last two years of each of the past 3 Bull Cycles, a 1D MA100 contact has most of the times (9) met with an incredible rebound, making it the most efficient buy entry on such basis. It was only 3 times this failed to initiate an immediate rebound (April 2024/ ETF led rally corrected, April 2021/ Musk led rally corrected, March 2020/ COVID flash crash), all valid reasons fundamentally.
Is this new all-out Trade War another one of those events? Not impossible, but this chart shows that it is 3 times more probable for this 1D MA100 contact to produce an aggressive rebound. If we narrow the sample to just the last year of the Bull Cycle, it was only once that a 1D MA100 failed to produce an instant rally.
As a result, it is now more probable to see a rally similar to the one that followed the January 2024 or October 2024 1D MA100 contacts, which were within a +85% / +90% range. Even the 1D RSI patterns among the Cycle fractals at the start of each final Bull year are similar.
So what do you think? Do you expect this technical 1D MA100 contact to reverse the dismal Tariffs sentiment? Feel free to let us know in the comments section below!
-------------------------------------------------------------------------------
** Please LIKE 👍, FOLLOW ✅, SHARE 🙌 and COMMENT ✍ if you enjoy this idea! Also share your ideas and charts in the comments section below! This is best way to keep it relevant, support us, keep the content here free and allow the idea to reach as many people as possible. **
-------------------------------------------------------------------------------
💸💸💸💸💸💸
👇 👇 👇 👇 👇 👇
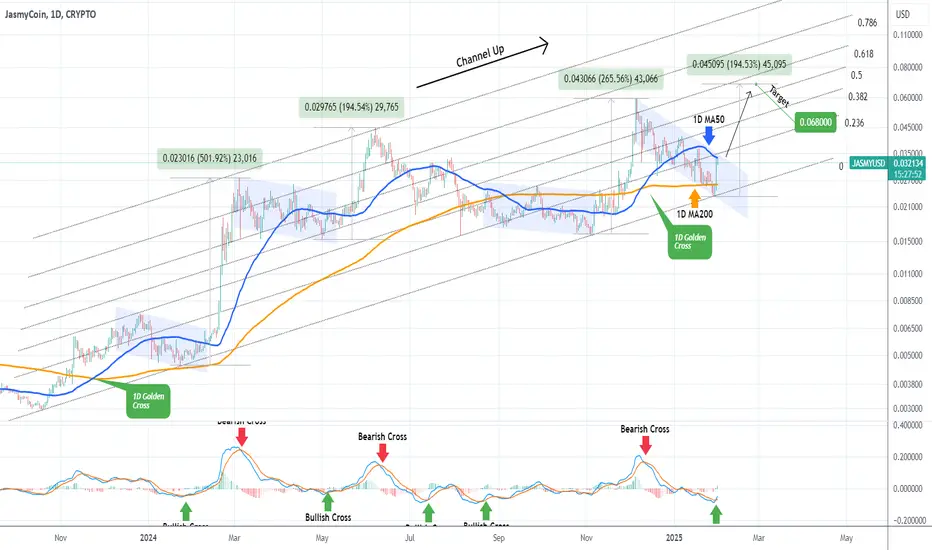
JASMYUSD testing the 1D MA50 for a break-out. $0.068 on sight.JasmyCoin (JASMYUSD) has been trading within a 15-month Channel Up and the price made this week a direct contact with its bottom. This is technically a Higher Low for the pattern and naturally it immediately reacted with a rebound.
The price is currently testing its 1D MA50 (blue trend-line), which happens to be at the top of the Bearish Leg (blue Channel) of the previous High. This is a Bull Flag pattern, which has always produced a rally eventually, with the lowest % rise being +194.50%.
With the 1D MACD just completing a Bullish Cross below the 0.0 mark, we expect Jasmy to break-out and go for at least another +194.50% rise from its bottom. Target 0.06800.
-------------------------------------------------------------------------------
** Please LIKE 👍, FOLLOW ✅, SHARE 🙌 and COMMENT ✍ if you enjoy this idea! Also share your ideas and charts in the comments section below! This is best way to keep it relevant, support us, keep the content here free and allow the idea to reach as many people as possible. **
-------------------------------------------------------------------------------
💸💸💸💸💸💸
👇 👇 👇 👇 👇 👇
106K Showdown: Can BTC Send?Bull
Breaking levels—momentum needs to keep rolling.
If this is the send, eyes on the usual markers.
106K is still the big bad bulls need to break.
Clear that, and we start looking for idealized moves.
Let’s see if they’ve got the juice.
Here is the ideal path if it can break above.

LTCUSD looking for a break-out to $255.Last time we looked at Litecoin (LTCUSD) was 3.5 months ago (October 10 2024, see chart below) when we gave the most timely buy signal, right before it started the strongest rally of its Bull Cycle yet:
Since however the break-out wasn't as aggressive as we initially expected, we have to downgrade our Target. The sequence in terms of 1W RSI is so far similar to the previous Cycles, it's just that the price hasn't responded as aggressively as then.
As you can see, LTC made the expected 1W RSI peak (December 02 2024) and then as the price started to consolidate, it declined, entering a Channel Down. This is no different that the previous RSI Cycle peaks (Dec 28 2020 and May 01 2017).
The difference is that in 2017 the price responded with a huger continuation rally just shy off the 4.0 Fibonacci extension from the consolidation stage, while in 2020 it 'only' managed to reach the 2.5 Fib.
The current pattern appears to have more in common with 2020/21, so we are downgrading our Target to match the current 2.5 Fib at $255.00. It is not impossible to reach $400 by the end of this Cycle (year) but it is best to pursue it only if you can accept elevated risk.
-------------------------------------------------------------------------------
** Please LIKE 👍, FOLLOW ✅, SHARE 🙌 and COMMENT ✍ if you enjoy this idea! Also share your ideas and charts in the comments section below! This is best way to keep it relevant, support us, keep the content here free and allow the idea to reach as many people as possible. **
-------------------------------------------------------------------------------
💸💸💸💸💸💸
👇 👇 👇 👇 👇 👇

Bull Flag breakout for SWFT!!!SWFT appears to be showing bullish strength over these recent months..
Sell offs get gobbled up....
The williams alligator is trending upward which is inherently bullish.
SWFT is consolidating into a bullish flag or bear flag.
The downward sloping resistance has been tested over half a dozen times, the base of the pattern coincides with the previous high...
Price target of 4c in the near term.

WIFUSD targeting $3.00 on this Channel Down bottom signal.Dogwifhat (WIFUSD) has been trading within a Channel Down pattern on the 1W time-frame, which on the greater scale looks like a giant Bull Flag. Regardless of that, the price almost hit the pattern's bottom (Lower Low trend-line) and with the 1W RSI stabilizing like on the August 05 2024 Low, we should now see that start of its technical Bullish Leg.
The previous Bullish Leg reached marginally above the 0.786 Fibonacci retracement level, so our current Target is $3.000.
-------------------------------------------------------------------------------
** Please LIKE 👍, FOLLOW ✅, SHARE 🙌 and COMMENT ✍ if you enjoy this idea! Also share your ideas and charts in the comments section below! This is best way to keep it relevant, support us, keep the content here free and allow the idea to reach as many people as possible. **
-------------------------------------------------------------------------------
💸💸💸💸💸💸
👇 👇 👇 👇 👇 👇

BITCOIN Rebounded on a Double Support. Will it continue higher?Bitcoin (BTCUSD) experienced a sharp sell-off yesterday following the DeepSeek news but managed to recover more than 50% of the losses as it rebounded on the Double Support level.
The obvious level that catches your eye is the 4H MA200 (orange trend-line) which was tested for the first time in 12 days. The second is the Pivot trend-line, which was formerly a Lower Highs trend-line initiating from the December 17 2024 All Time High (ATH).
At the same time, it almost touched the bottom (Higher Lows trend-line) of January's Channel Up. Technically that is similar with December's Channel Up, which also had a Pivot trend-line test that delivered a rebound and a Higher High to the December 17 ATH.
As a result, if the price breaks above the 4H MA50 (blue trend-line), we expect a Higher High (new ATH), on a minimum 112000 estimate. If the price gets rejected on the 4H MA50 however, we expect a Double Bottom test of the 98000 level (or slightly below), similar to those of December 23 and January 13.
The reason that both scenarios are plausible is the fact that they both got their 4H RSI oversold (<30.00) and then rebounded.
The above show that even in the event of a 96000 Low, BTC is a buy even on the current levels, as once again we are closer to the technical bottom than the Cycle's Top. The technical upside remains enormous in 2025.
So which scenario do you think will prevail? Feel free to let us know in the comments section below!
-------------------------------------------------------------------------------
** Please LIKE 👍, FOLLOW ✅, SHARE 🙌 and COMMENT ✍ if you enjoy this idea! Also share your ideas and charts in the comments section below! This is best way to keep it relevant, support us, keep the content here free and allow the idea to reach as many people as possible. **
-------------------------------------------------------------------------------
💸💸💸💸💸💸
👇 👇 👇 👇 👇 👇

Bitcoin - 4H let's understand the where we are!Following the USA election, the crypto market experienced a significant rally, seemingly pricing in expectations around the Inauguration of Donald Trump. As the market has likely anticipated much of the impact from potential upcoming policies, we could see oscillations between sharp rises and falls in the coming days. A downward correction appears more probable as the immediate effects seem baked into current prices.
Technical Analysis: BINANCE:BTCUSDT broke out of a trading range, achieving its target with a ~9% rise, equivalent to the range's height.
The price hunted liquidity above the previous highs, which reinforces the possibility of a fall.
A decline from the current zone is likely, with key support zones highlighted on the chart.
📈 Watch for reaction near $102,600 and $100,100 zones.
💬 Like, follow, and comment for more timely market insights! 🚀

BITCOIN The beauty of the 1D MA100 coming to the rescue.Bitcoin (BTCUSD) is pulling back quite aggressively today along with most of the market, as once again political in combination with China's manufacturing sector shrinking, are pitting a dent to buying sentiment.
Having touched its 1D MA50 (blue trend-line) again, we once again view these fundamentals/ news as means to justify the technicals. And BTC's chart on the 1D time-frame clear shows that there is a technical 'necessity'/ tendency to test the 1D MA100 (green trend-line) before more upside can be realized.
As you can see within its +2 year Channel Up, BTC goes through a mini (Megaphone) consolidation phase half-way through its Bullish Leg (we are currently on its 3rd such Leg) that hits its 1D MA100 before it can justify a rebound to the Channel's new Higher High.
During that test, the 1D RSI forms the exact same Channel Down that hits its 1st Support level at 36.00. The Sine Waves clear show that cyclically it is time for this test so we expect this pull-back to be extended to around 94000 - 93000. The bounce that will follow should test at least the top of the Channel Up at $150000.
But what do you think. Do you view the 1D MA100 as a 'fair' buy entry again? Feel free to let us know in the comments section below!
-------------------------------------------------------------------------------
** Please LIKE 👍, FOLLOW ✅, SHARE 🙌 and COMMENT ✍ if you enjoy this idea! Also share your ideas and charts in the comments section below! This is best way to keep it relevant, support us, keep the content here free and allow the idea to reach as many people as possible. **
-------------------------------------------------------------------------------
💸💸💸💸💸💸
👇 👇 👇 👇 👇 👇

VINE/USDT DAY TRADE VOLUMEVINE/USDT DAY TRADE VOLUME
has good chance to recovery for day trade to new uptrend

DOGE about to rally on Double Bottom Bullish Cross signalDogecoin (DOGEUSD) has been trading within a Channel Up pattern since the December 20 2024 bottom. A very distinct buy signal emerges every time the price makes a Double Bottom near the Higher Lows trend-line of the pattern and the 4H MACD forms two Bullish Crosses in a row.
As you can see, this has already happened two times, with the price reaching at least the 2.618 Fibonacci extension for a Higher High and this is the 3rd time within the Channel Up that we see this indicator combo.
As a result, we turn bullish short-term, targeting 0.43250 (Fib 2.618 ext).
-------------------------------------------------------------------------------
** Please LIKE 👍, FOLLOW ✅, SHARE 🙌 and COMMENT ✍ if you enjoy this idea! Also share your ideas and charts in the comments section below! This is best way to keep it relevant, support us, keep the content here free and allow the idea to reach as many people as possible. **
-------------------------------------------------------------------------------
💸💸💸💸💸💸
👇 👇 👇 👇 👇 👇

BITCOIN We are nowhere near the Top!Bitcoin (BTCUSD) on the 1M time-frame is as straightforward as it can get. The message is clear: We are nowhere near the Top yet.
The LMACD flashes its Cycle Top signal when it tests the Lower Highs trend-line. If this happens to be above the Pi Cycle's Top (red trend-line), then we have a complete Sell Signal for the Cycle. This is expected to take place towards the end of this year.
Similarly, the bottom takes place below the Pi Cycle's Bottom (green trend-line) and is confirmed by a LMACD Bullish Cross. Those indicators are the Blueprint to BTC's Cycles.
Do you agree with this? Feel free to let us know in the comments section below!
-------------------------------------------------------------------------------
** Please LIKE 👍, FOLLOW ✅, SHARE 🙌 and COMMENT ✍ if you enjoy this idea! Also share your ideas and charts in the comments section below! This is best way to keep it relevant, support us, keep the content here free and allow the idea to reach as many people as possible. **
-------------------------------------------------------------------------------
💸💸💸💸💸💸
👇 👇 👇 👇 👇 👇

ETHEREUM trapped between MAs but preparing a massive surge.Ethereum (ETHUSD) has been trading since the start of the year within the 1D MA50 (blue trend-line) and 1D MA200 (orange trend-line). Despite this technical 'trap', there are two bullish patterns that outweigh this range and those are primarily the Channel Up since the July 18 2022 market bottom and in the last 10 months an Inverse Head and Shoulders (IH&S) pattern.
The latter is in the process of forming the Right Shoulder and as long as the 1D MA200 holds, it should complete it within 6 weeks maximum. On top of that, we have a recently formed 1D Golden Cross and in terms of 1W RSI, we are on similar grounds as January 2024.
On all cases, a strong rally followed in the form of the Channel's Bullish Leg. Assuming it follows the technical target of the IH&S, we are expecting a peak on the 2.0 Fibonacci extension at $7400.
-------------------------------------------------------------------------------
** Please LIKE 👍, FOLLOW ✅, SHARE 🙌 and COMMENT ✍ if you enjoy this idea! Also share your ideas and charts in the comments section below! This is best way to keep it relevant, support us, keep the content here free and allow the idea to reach as many people as possible. **
-------------------------------------------------------------------------------
💸💸💸💸💸💸
👇 👇 👇 👇 👇 👇

DOGEUSD preparing a rally to $1.60Dogecoin (DOGEUSD) is trading on its 1D MA50 (blue trend-line) as despite yesterday's attempted break-out, the pull-back brought the price down around this key trend-line again.
The key for buyers is now to turn this level into a Support and hold it, as this is what took place during the September - November 2024 rally. As you can see, once the price broke above the 1D MA50 and re-tested as Support, it sustained a 2-month rally, which reached the 3.0 Fibonacci extension from its bottom point (August 05 2024).
We can clearly see how similar the two fractals are, both started with a correction (red Rectangle) and then after the bottom, a Channel Down (also evident on their 1D RSI sequences) paved the way for the rally.
As a result, if DOGE tests the 1D MA50 again and holds it this time, we will have a confirmed buy signal to target $1.600 (Fibonacci 3.0 extension).
-------------------------------------------------------------------------------
** Please LIKE 👍, FOLLOW ✅, SHARE 🙌 and COMMENT ✍ if you enjoy this idea! Also share your ideas and charts in the comments section below! This is best way to keep it relevant, support us, keep the content here free and allow the idea to reach as many people as possible. **
-------------------------------------------------------------------------------
💸💸💸💸💸💸
👇 👇 👇 👇 👇 👇

$TIA: Ready to Breakout After 5 Months of Consolidation?
I think LSE:TIA is finally primed for a breakout after spending the last five months consolidating in the tight $4–$6 range. The lows have been respected multiple times, and we're now seeing the buildup of potential for a significant move.
I’m eyeing an entry at $4.85, which would be a perfect spot to load up if we get a retrace into that zone. If it does dip back there, it's a max bid scenario for me.
However, I'm also prepared to jump in a bit higher if needed, especially if I get left behind as the breakout gains momentum. It's a balancing act between waiting for the perfect entry and not missing out on the move entirely.
Let’s see how it plays out—I'm keeping a close watch!
