TRUMP reached $15B in market cap! Should this even be legal??OFFICIAL TRUMP (TRUMPUSDT) was launched officially on Friday by President Donald Trump, reaching a market capitalization peak of $15 billion.
It naturally falls into the category of memecoins and even though the token may very well keep rising with its technical corrections and rallies, the big question that is on everyone's mind is this:
SHOULD IT EVEN BE LEGAL?
This post isn't a political one, we wouldn't care any less if the token was named Bidencoin or Obamacoin. Our concern falls purely in the economic sphere and the financial consequences a price collapse may have on its (naive?) investors and the whole crypto market in general.
Obviously, having released only 20% of supply to the general public while the remaining 80% of tokens that have yet to be publicly released are owned by the Trump Organization affiliate CIC Digital LLC and Fight Fight Fight LLC (a company formed in Delaware on Jan. 7), is in principle a positive step and a small sign towards proper governance. But naturally the token’s website includes a disclaimer noting TRUMP is “not intended to be, or the subject of” an investment opportunity nor a security of any type, and is “not political and has nothing to do with” any political campaign, political office or government agency.
Again to avoid confusion, the token may very well extend the current rally, after all it has been on 3 enormous straight green candles, and even double in price and enter the top 10 of crypto with more than $30B cap.
But can you image the consequences to the whole market if some of that 20% of public supply or any of the 6 wallets that own more than $600 million each, makes a rug pull? Beyond the ethical aspect, should it be legal for the President of the United States to have such a large stake on this kind of venture? Does the idea of a 'free market' apply under the above conditions?
We are just raising our concerns and nothing more, as it took us, the whole crypto community, 25 years to get the market from a state of ridicule to a global force that is already reshaping the world as we know it. And it is our responsibility to question moves and call potential dangers if we see one. How will it reflect to crypto investors if the U.S. President's coin goes from no 15 in the market cap to bust? It took a lot of years and effort for the first BTC ETF to attract high profile capital to the market from investors that would otherwise never though of buying cryptocurrency if it weren't for Blackrock and others to back it up with an ETF. Will those people or even normal investors maintain their appetite if the U.S. President fails to safeguard even his own coin?
Lots of questions, tough answers. Feel free to tell us what you think about TRUMP's coin.
-------------------------------------------------------------------------------
** Please LIKE 👍, FOLLOW ✅, SHARE 🙌 and COMMENT ✍ if you enjoy this idea! Also share your ideas and charts in the comments section below! This is best way to keep it relevant, support us, keep the content here free and allow the idea to reach as many people as possible. **
-------------------------------------------------------------------------------
💸💸💸💸💸💸
👇 👇 👇 👇 👇 👇
Cryptocurrencies

USUALUSDT: What Price Action Is Telling Us Today - Usual◳◱ With Super Trend in play and the price at 0.5389, the market whispers opportunity. Breaking past 0.8931 | 1.196 | 1.6671 could spark a rally, while 0.422 | 0.2538 anchors bullish sentiment.
◰◲ General Information :
▣ Name: Usual
▣ Rank: 288
▣ Exchanges: Binance, Kucoin, Gateio, Mexc
▣ Category / Sector: N/A
▣ Overview: Usual project overview is currently unavailable. I'll try to update this in the upcoming analysis.
◰◲ Technical Metrics :
▣ Current Price: 0.5389 ₮
▣ 24H Volume: 92,622,307.521 ₮
▣ 24H Change: -3.145%
▣ Weekly Change: -13.97%%
▣ Monthly Change: -41.17%%
▣ Quarterly Change: N/A%
◲◰ Pivot Points :
▣ Resistance Level: 0.8931 | 1.196 | 1.6671
▣ Support Level: 0.422 | 0.2538
◱◳ Indicator Recommendations :
▣ Oscillators: BUY
▣ Moving Averages: STRONG_SELL
◰◲ Summary of Technical Indicators : SELL
◲◰ Sharpe Ratios :
▣ Last 30 Days: 1.10
▣ Last 90 Days: 3.20
▣ Last Year: 3.20
▣ Last 3 Years: 3.20
◲◰ Volatility Analysis :
▣ Last 30 Days: 3.18
▣ Last 90 Days: 2.94
▣ Last Year: 2.94
▣ Last 3 Years: 2.94
◳◰ Market Sentiment :
▣ News Sentiment: N/A
▣ Twitter Sentiment: N/A
▣ Reddit Sentiment: N/A
▣ In-depth BINANCE:USUALUSDT analysis available at TradingView TA Page
▣ Your thoughts matter! What do you think of this analysis? Share your insights in the comments below. Your like, follow, and support are greatly valued and help sustain high-quality content.
◲ Disclaimer : Disclaimer
The content provided is for informational purposes only and does not constitute financial, investment, or trading advice. Always conduct your own research and consult a qualified professional before making any financial decisions. Use of the information is solely at your own risk.
▣ Explore the Power of Charting with TradingView
Unlock a wide range of financial analysis tools, data, and features to elevate your trading experience. Take a tour and see the possibilities. If you decide to upgrade your plan, you can receive up to $30 back. Discover more here - affiliate link -

ETHEREUM The Parabolic Rally to $10k has started!Ethereum (ETHUSD) is having a strong recovery rebound this week after marginally breaking below the 1W MA50 (blue trend-line) earlier. This indicates enormous buying pressure on the Bull Cycles first core Support level (the second being the 1M MA50 (red trend-line) which supported twice last Aug/Sep).
In comparative terms, relative to ETH's previous Bull Cycle, we are around the October 2020 levels, which was the last consolidation before the Cycle's main Parabolic Rally started. This is also evident on the 1W RSI fractals among the two. The rally exceeded by a small margin the 1.5 Fibonacci extension and formed the Cycle Top.
As a result, we expect ETH to hit at least the $10k level before this Cycle tops towards the end of the year. Technically, we should see the 1W MA50 support until the end.
-------------------------------------------------------------------------------
** Please LIKE 👍, FOLLOW ✅, SHARE 🙌 and COMMENT ✍ if you enjoy this idea! Also share your ideas and charts in the comments section below! This is best way to keep it relevant, support us, keep the content here free and allow the idea to reach as many people as possible. **
-------------------------------------------------------------------------------
💸💸💸💸💸💸
👇 👇 👇 👇 👇 👇

BITCOIN The minimum target of this Cycle is $185kIf you follow us for long, you know that we are very fond of using Fibonacci levels on Bitcoin (BTCUSD) Cycles in order to project future tops and bottoms. Today is one of those analyses, in fact it is a strong variation of the following Inverse Head and Shoulders call:
As you can see, that was based on the condition that BTC would make a first hit and rejection on the 0.786 Fib retracement and then (as it happened on the previous Cycle) would go for a Cycle Top on the 2.0 Fibonacci, which gives us a $165k Target.
Since the 0.786 Fib never really offered the rejection of the previous 3 Cycles, we are introducing a variation model with new parameters.
We take the Fib extension from the bottom of each Cycle to the moment it made contact with the 1W MA50 (blue trend-line). As you can see by applying these conditions, every Cycle since BTC's inception has hit at least the 5.0 Fibonacci extension, with all Cycles in fact making a perfect Top there with the exception of 2017, which even exceeded it.
As a result, we can claim that this Cycle will have a minimum peak at $185000.
How realistic do you think this is for the 'bad case scenario'? Feel free to let us know in the comments section below!
-------------------------------------------------------------------------------
** Please LIKE 👍, FOLLOW ✅, SHARE 🙌 and COMMENT ✍ if you enjoy this idea! Also share your ideas and charts in the comments section below! This is best way to keep it relevant, support us, keep the content here free and allow the idea to reach as many people as possible. **
-------------------------------------------------------------------------------
💸💸💸💸💸💸
👇 👇 👇 👇 👇 👇

BITCOIN vs GOLD Cycles. Yellow metal leads, BTC lags.In our early years as a channel we used to do a lot of analyses on the similarities of Bitcoin (BTCUSD) and Gold (XAUUSD) and how Gold Cycles could help predict BTC's future prices. The latter is called the 'digital Gold' after all.
Going back to our roots, we present to you today our latest cross-cycle comparison between the two assets, which offers interesting insights. As you can see, the Cycles of those two aren't always aligned. The correlation tends to end when Gold peaks and when it bottoms.
As you can see since 2018, when Gold starts a Bull Cycle, Bitcoin tends to lag behind, still being on its Bear Cycle. Then the two converge and correlate until Gold peaks and start its Bear Cycle. That is still relatively early for Bitcoin's bullish trend, which remains on its Bull Cycle, in fact has around 1 year ahead of it. As a result, the two start to diverge again.
Based on this model, it appears that Gold's Bull Cycle has peaked and Bitcoin is entering (black circle) its last stage of its Bull Cycle, with a Parabolic Rally being prepared. Still not too late to buy the 'Digital Gold' on this Cycle.
Do you agree with this correlation? Feel free to let us know in the comments section below!
-------------------------------------------------------------------------------
** Please LIKE 👍, FOLLOW ✅, SHARE 🙌 and COMMENT ✍ if you enjoy this idea! Also share your ideas and charts in the comments section below! This is best way to keep it relevant, support us, keep the content here free and allow the idea to reach as many people as possible. **
-------------------------------------------------------------------------------
💸💸💸💸💸💸
👇 👇 👇 👇 👇 👇

The Whispered Secrets Behind CGPTUSDT’s Movements - ChainGPT◳◱ On the BINANCE:CGPTUSDT chart, the BollingerBand Breakout pattern suggests an upcoming trend shift. Traders might observe resistance around 0.4838 | 0.6085 | 0.8686 and support near 0.2237 | 0.0883. Entering trades at 0.3872 could be strategic, aiming for the next resistance level. Currently, the price is trading near 0.3872, with key support at 0.2237 | 0.0883 and resistance at 0.4838 | 0.6085 | 0.8686.
◰◲ General Information :
▣ Name: ChainGPT
▣ Rank: 267
▣ Exchanges: Binance, Kucoin, Huobipro, Gateio, Mexc, Hitbtc
▣ Category / Sector: N/A
▣ Overview: ChainGPT project overview is currently unavailable. I'll try to update this in the upcoming analysis.
◰◲ Technical Metrics :
▣ Current Price: 0.3872 ₮
▣ 24H Volume: 94,764,005.058 ₮
▣ 24H Change: 13.582%
▣ Weekly Change: 65.21%%
▣ Monthly Change: 101.73%%
▣ Quarterly Change: 170.98%%
◲◰ Pivot Points :
▣ Resistance Level: 0.4838 | 0.6085 | 0.8686
▣ Support Level: 0.2237 | 0.0883
◱◳ Indicator Recommendations :
▣ Oscillators: NEUTRAL
▣ Moving Averages: STRONG_BUY
◰◲ Summary of Technical Indicators : BUY
◲◰ Sharpe Ratios :
▣ Last 30 Days: 3.22
▣ Last 90 Days: 2.45
▣ Last Year: 1.13
▣ Last 3 Years: 0.87
◲◰ Volatility Analysis :
▣ Last 30 Days: 3.32
▣ Last 90 Days: 2.17
▣ Last Year: 1.47
▣ Last 3 Years: 1.51
◳◰ Market Sentiment :
▣ News Sentiment: N/A
▣ Twitter Sentiment: N/A
▣ Reddit Sentiment: N/A
▣ In-depth BINANCE:CGPTUSDT analysis available at TradingView TA Page
▣ Your thoughts matter! What do you think of this analysis? Share your insights in the comments below. Your like, follow, and support are greatly valued and help sustain high-quality content.
◲ Disclaimer : Disclaimer
The content provided is for informational purposes only and does not constitute financial, investment, or trading advice. Always conduct your own research and consult a qualified professional before making any financial decisions. Use of the information is solely at your own risk.
▣ Explore the Power of Charting with TradingView
Unlock a wide range of financial analysis tools, data, and features to elevate your trading experience. Take a tour and see the possibilities. If you decide to upgrade your plan, you can receive up to $30 back. Discover more here - affiliate link -

FILUSD Accumulation almost over. Next stop $19.00.Filecoin (FILUSD) has been consolidating around its 1W MA50 (blue trend-line) for the past 4 weeks and appears to be at the end of the Lower Highs pattern similar to the one in 2019/20.
Both patterns held FIL's historic Support Zone, printed identical 1W RSI Cup formations and the past pattern initiated a strong 1-year rally above the Symmetrical Resistance Zone once the Lower Highs broke. Essentially the Descending Triangle patterns are Accumulation Phases before the Bull Cycle's main rally.
As a result, even though one last test of the Support Zone is technically viable, the upside at this time is already considerably greater than the risk involved, so in our opinion it is worth going long and have a modest 1W MA200 (orange trend-line) Target at $19.00.
-------------------------------------------------------------------------------
** Please LIKE 👍, FOLLOW ✅, SHARE 🙌 and COMMENT ✍ if you enjoy this idea! Also share your ideas and charts in the comments section below! This is best way to keep it relevant, support us, keep the content here free and allow the idea to reach as many people as possible. **
-------------------------------------------------------------------------------
💸💸💸💸💸💸
👇 👇 👇 👇 👇 👇

Missed the First Move on $ALGO – Still Eyeing Big Upside!Completely missed this one, same as CRYPTOCAP:HBAR , and now I’m looking to get in. Hate missing the first move when it’s right there, especially with the monthly blocks showing the setup.
The plan is to enter closer to 33c, though I’m not sure if it’ll give that opportunity. My target is $2.30, just below ATHs.
CRYPTOCAP:ALGO still has plenty of upside.

BITCOIN This week forms the bottom before it turns Parabolic.Bitcoin (BTCUSD) continues to repeat the 2014 - 2017 Cycle in great detail. So far besides the Bear Cycle Lower Highs that broke only after the Cycle bottom was priced, BTC has respected the replicated the two Accumulation phases above the 1W MA50 (blue trend-line), which is 2016 marked the last long-term buy opportunities before the market went on a Parabolic Rally in 2017.
As you can see, even the 1W RSI suggests that in relative terms we are in a pre-parabolic run pull-back similar to January 2017. There are high probabilities that this week is the one that forms the new bottom that will push the market to a continuous rally towards December 2025.
If the top is priced on the 7.0 Fibonacci extension from the Cycle bottom, as it did on December 2017, then we can expect to see at least $200k.
Buy what is your take on this? Do you think we are that close before a parabolic rally? Feel free to let us know in the comments section below!
-------------------------------------------------------------------------------
** Please LIKE 👍, FOLLOW ✅, SHARE 🙌 and COMMENT ✍ if you enjoy this idea! Also share your ideas and charts in the comments section below! This is best way to keep it relevant, support us, keep the content here free and allow the idea to reach as many people as possible. **
-------------------------------------------------------------------------------
💸💸💸💸💸💸
👇 👇 👇 👇 👇 👇

AVAXUSD Will the 1W MA50 hold and push the Cup & Handle higher?Avalanche (AVAXUSD) is about to complete a Cup and Handle (C&H) pattern on the 1W time-frame and currently the Handle part has found Support for 3 straight weeks on both the 1W MA50 (blue trend-line) and the 1W MA200 (orange trend-line).
This is also on the 0.5 Fibonacci retracement level of the Cycle. Technically we should see in the coming weeks the start of the 2nd Bullish Leg of the Bull Cycle and if it follows the C&H dynamics, we can expect it to target the 2.0 Fibonacci (blue) extension at $240.00.
-------------------------------------------------------------------------------
** Please LIKE 👍, FOLLOW ✅, SHARE 🙌 and COMMENT ✍ if you enjoy this idea! Also share your ideas and charts in the comments section below! This is best way to keep it relevant, support us, keep the content here free and allow the idea to reach as many people as possible. **
-------------------------------------------------------------------------------
💸💸💸💸💸💸
👇 👇 👇 👇 👇 👇

BITCOIN Cycle Top can be as high as $200kBitcoin (BTCUSD) has started 2025 on high volatility amidst geopolitical and economic news input. 2025 is the last year of this Bull Cycle, according to the Cycles Theory which for more than a decade has been very accurate at predicting Cycle Tops and Bottoms.
** LGC, MMB and Pi Cycle *
On today's analysis we present to you this view in more detail by displaying Bitcoin's Logarithmic Growth Channel (LGC) with the addition of the Mayer Multiple Bands (MMB) and the Pi Cycle trend-lines. From the MMB we use its extremes, the 3SD above (red trend-line), which is the Mayer Top and the 3SD below (black trend-line), which is the Mayer Bottom. From the Pi Cycle we use a tighter range, its top trend-line (orange) and bottom trend-line (green), which form a zone that typically serves as more of a 'Fair Value' before the Bear Cycle's extreme selling and Bull Cycle's extreme buying (Parabolic Rally).
** Current Cycle in 2025 **
As mentioned, BTC has entered the last year of its current Bull Cycle. Based on this cyclical pattern, the 3 previous Tops have been either on a November or December. As a result, we expect the new Cycle Top to start forming by November 2025. The last one was formed above the Pi Cycle Top (never hit the Mayer Top) and on the 2nd LGC Zone from the top.
This suggests that even if the price barely tests the bottom for the LGC 2nd Zone from the Top, by November 2025 we should be close to $200000. Technically the projected Peak Zone should be within the 180k - 200k range. That may still be below the Pi Cycle Top, so technically we can argue that it is a fair scenario to expect and not an overly optimistic.
Unrealistic or not, this is what 3 separate traditional long-term models suggest.
But what do you think? Is a $180-200k Top a realistic expectation within 2025? Feel free to let us know in the comments section below!
-------------------------------------------------------------------------------
** Please LIKE 👍, FOLLOW ✅, SHARE 🙌 and COMMENT ✍ if you enjoy this idea! Also share your ideas and charts in the comments section below! This is best way to keep it relevant, support us, keep the content here free and allow the idea to reach as many people as possible. **
-------------------------------------------------------------------------------
💸💸💸💸💸💸
👇 👇 👇 👇 👇 👇

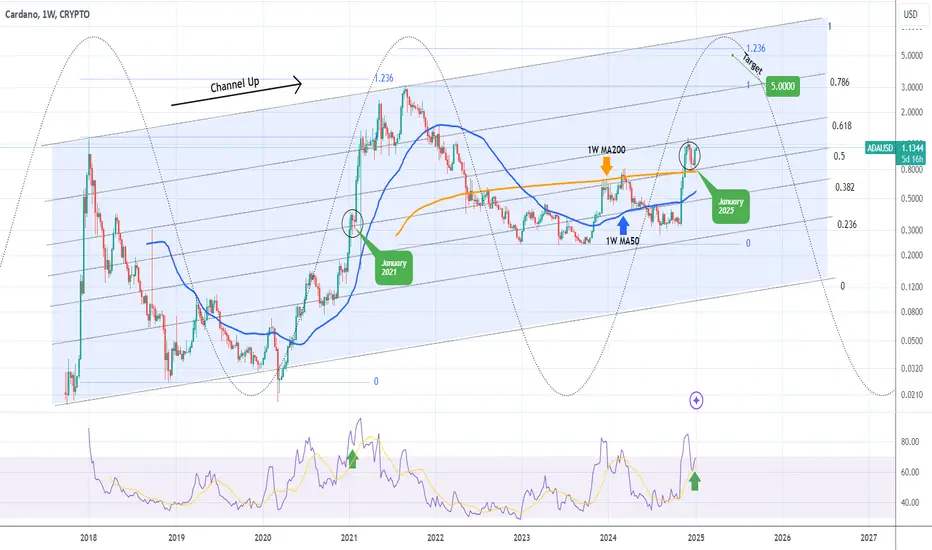
CARDANO Mega rally starting first to $3 then top expected at $5Last time we looked at Cardano (ADAUSD) we gave a confident medium-term buy signal (November 18 2024, see chart below):
Today, having seen a very strong closing to the year last week and especially since the price bounced off the 1W MA200 (orange trend-line), we are making a long-term call towards the top of the Cycle.
Technically ADA's historic pattern is a Channel Up and if we draw its Fibonacci levels, the price is currently within the 0.5 - 0.618 range. That is exactly where it was during the same stage of the previous Cycle in January 2021. As the 0.5 Fib held, once it closed a 1W candle above the 0.618, the price skyrocketed to the 0.786 Channel Fib and tested the previous All Time High (ATH).
We can see the amazing symmetry between the Cycles on the 1W RSI fractals too. As a result, our next immediate Target for ADA is near the previous ATH at $3. Beyond that, we expect the Cycle to top at $5, which is marginally below the 1.236 Fibonacci extension, which was where the August 2021 Cycle Top was priced.
-------------------------------------------------------------------------------
** Please LIKE 👍, FOLLOW ✅, SHARE 🙌 and COMMENT ✍ if you enjoy this idea! Also share your ideas and charts in the comments section below! This is best way to keep it relevant, support us, keep the content here free and allow the idea to reach as many people as possible. **
-------------------------------------------------------------------------------
💸💸💸💸💸💸
👇 👇 👇 👇 👇 👇
Bitcoin - A quarter of a million dollars - is it possible?Good Morning, Good Evening!
A new year brings new candles, new opportunities and new challenges. I decided to write down my new thoughts and, where appropriate, reflect on my previous analyses.
Naturally, my primary focus is on the asset that leads the cryptocurrency market – Bitcoin.
I must mention that I am not someone with formal education in this field. I am self-taught, placing a strong emphasis on using Technical Analysis as the main component of my decision-making process. This stems from my belief that although the chart is difficult to read, it largely allows for the interpretation of the hidden intentions of "smart money." I want to stress that the following words reflect only my personal point of view, which may not be correct, and that this publication is by no means investment or educational advice as understood by any law regulating such matters. I simply intend to ramble about topics I don’t fully understand.
Background
Since its inception, Bitcoin has been in a continuous long-term upward trend. Throughout this time, there have been four minor reaccumulation structures and four major ones, occurring chronologically. Each structure has taken progressively longer to form, and the upward trend has been gradually flattening over time.
Technical Analysis and Thoughts
In this analysis, I will apply tools from volume analysis, Wyckoff methodology, Volume Spread Analysis (VSA), and Elliott Wave Theory.
At the beginning, I will refer to an analysis I published about a year and a half ago on this platform: "Comparative Analysis of BTC," 24.09.2023 (links attached).
Looking back at my previous analysis, I see that my reasoning and chosen tools were correct. As is often the case in attempts to master the market using Technical Analysis, the price action deviated from the expected scenario. However, the primary trend remained intact.
I missed certain key structures, such as the Spring, which I would interpret differently today. But I will get to that later.
The key resistance levels, derived from price structure and Fibonacci extensions, appear to have been recognized by the market. The price stalled just below the resistance level at 2.618, an extension based on the Spring-Buying Exhaustion range from 2015 and 2017/2018 reaccumulation phases.
Similarly, the external measurement of 1.618, calculated from the 2017/2018 Spring to the 2021 Upthrust, was respected by market participants. Both levels align perfectly with significant price points.
I mentioned that today I would approach the topic differently. This is due to the revealed market structure (it's always easier to analyze when you can see everything, right? 😉) as well as the experience I've gained by continuously expanding my analytical horizon.
Looking at the latest high-order reaccumulation structure (December 2021 – March 2024), I realize I made an error in my interpretation. The overall price action indicates a lack of supply around the $16K level.
Interestingly, BTC/USDT on Binance shows significant accumulation, which I deduce from Bag Holding candles.
The core point of my argument is that I have witnessed the formation of a large accumulation structure, whose elements align with the Wyckoff methodology. The market behaved as expected based on this interpretation.
One particularly important element is the Last Point of Supply (LPS), represented by the March 2024 – November 2024 reaccumulation phase. I discussed this process in detail in my September 6, 2024 publication titled "Bitcoin – Technical Analysis."
The ~250-day trading range, during which the price was stuck, allowed Smart Money to accumulate assets from those willing to sell. Despite the temporary stagnation, which I currently observe, the upward trend will likely continue.
The strength of this trend is confirmed by the use of volume-weighted average price (VWAP) anchored to the Test of Phase C, according to Wyckoff's methodology.
When analyzing the three most recent tests in the three highest-order reaccumulation structures, I observe that the price moves within a channel defined by the second and third standard deviations.
I think that the current sideways structure is a Back Up to the Creek from the latest high-order reaccumulation phase. Its characteristics resemble a reaccumulation phase.
At this stage, I am unsure whether this structure will directly lead to a breakout to significantly higher price levels, or whether it will result in an Upthrust of a higher-order structure, followed by another Spring.
The structure shows declining volume and several Bag Holding candles, marked with green arrows on my chart.
The Upthrust does not exhibit distribution characteristics but instead suggests a lack of demand.
The candle marked with a question mark is interesting due to its dual nature. However, upon closer examination of the 4-hour interval, it appears to be an Upthrust of a lower-tier structure, aimed at absorbing supply.
I want to highlight the relationship between the Test of Phase C and the structure forming along previous peaks.
Considering the two most recent reaccumulation phases, the situation is as follows:
I do not take into account overly optimistic price movements that exceed the 8.0 external retracement level, due to the flattening of the global trend over time.
Instead, I consider more realistic targets based on Fibonacci levels, such as 3.618 and 2.618 extensions, indicating a price range between $170K and $230K.
In my September 24, 2023 analysis, I mentioned $240K as a 3.618 external retracement level measured from March 2020 to October 2021.
Using 1:1 geometry, I estimate that the price could reach around $250K, which aligns with my other methods.
Conclusion of the Analysis
I have presented various methods to identify the direction and potential range of Bitcoin's price movement.
Although it is difficult to pinpoint the exact peak of the trend, the analysis provides sufficient signals to expect supply levels within the indicated price ranges.
Confirmation of a trend reversal would require a high-order distribution structure visible on higher time frames.
Final Thoughts
I have intentionally referred to my previous analyses to maintain continuity and to highlight both successes and mistakes.
The purpose of this reflection is to improve my analytical process by identifying what I did well and where I need to focus more in future analyses.
I believe that Technical Analysis, practiced for over a century, holds a certain beauty and logic. The process of applying it, and reaping its rewards, is an intellectual delight.
Ultimately, the weakest link is not the tool, but the person using it. Therefore, continuous improvement and patience are essential. The chart is the only reliable source that reveals the intentions of Smart Money or Composite Man, depending on the interpretation of market personality.
Thank you to everyone who has taken the time to read my thoughts. I hope you found them insightful, and that your time was well spent.
Wishing you health, perseverance, and successful trades.
May you master the art of recognizing well-formed market structures.
CatTheTrader

BITCOIN New year, same thing..Bitcoin (BTCUSD) has just reclaimed the 1D MA50 (blue trend-line) over the weekend and is so far successfully holding it below the price action, making it a Support.
The exact same price action took place in January last year (2024). In fact, as these 1D charts very vividly illustrate, the whole sequence from the September 06 2024 Low to today, is very similar to the sequence from the September 11 2023 Low to (so far) January 2024.
This incredible degree of symmetry is also extending to their 1D RSI and MACD fractals. The first formed Bearish Divergences under Lower Highs trend-lines, which when broken confirm the new rally, while the latter (MACD) was the early buy signal when it formed a Bullish Cross below the 0.00 mark.
If BTC continues to copy the January 2024 fractal, then we should be expecting a few more days of sideways price action, that will pave the way for the new (2nd) Rally Phase of the whole pattern. The 2nd rally peaked on the 1.618 Fibonacci extension from the September 11 2023 Low, so if the pattern replication continues, we may see a peak above $150k.
So do you think the early 2024 bullish break-out will be repeated? And if yes, are you expecting a peak as high as $150000? Feel free to let us know in the comments section below!
-------------------------------------------------------------------------------
** Please LIKE 👍, FOLLOW ✅, SHARE 🙌 and COMMENT ✍ if you enjoy this idea! Also share your ideas and charts in the comments section below! This is best way to keep it relevant, support us, keep the content here free and allow the idea to reach as many people as possible. **
-------------------------------------------------------------------------------
💸💸💸💸💸💸
👇 👇 👇 👇 👇 👇

Technical Analysis of WAGYUSWAP (WAGYU/USDT) Technical Analysis of WAGYUSWAP (WAGYU/USDT)
Chart Pattern: Falling Wedge
Structure: WAGYU/USDT is currently forming a falling wedge pattern, which is considered a bullish reversal pattern. The narrowing of price action indicates reduced volatility, often leading to an upward breakout.
Support: The green trendline represents strong support, with multiple touches confirming its validity.
Resistance: The red trendline represents descending resistance that needs to be broken for bullish confirmation.
Indicators Analysis
VMC Cipher B Divergences: Bullish divergences observed with higher lows in the indicator and lower lows in price. This supports a potential upward momentum.
RSI (14): Currently near neutral levels (~45), indicating room for upward movement before becoming overbought. A breakout of the wedge may push RSI above 50, strengthening the bullish scenario.
Money Flow Index (MFI): Fluctuating near 50, suggesting balanced buying and selling pressure. A spike above 60 would indicate increased buying momentum.
Stochastic Oscillator: Oversold levels (25.35), aligning with the potential for a price rebound. A crossover to the upside would be a confirmation signal.
Key Levels
Support Levels:
$0.0005847: Immediate support level.
$0.0005000: Strong psychological support.
Resistance Levels:
$0.0009113: First target upon breakout.
$0.0013197: Strong mid-term resistance.
$0.0015666 - $0.0019185: Long-term targets, contingent on market sentiment and volume.
Volume Analysis
Volume Decline: Falling wedge patterns often witness declining volume. An increase in volume during a breakout above resistance will confirm bullish momentum.
Trading Plan for WAGYU/USDT (Spot Trading Only)
1. Entry Strategy
BUY IMMEDIATELY
2. Exit strategy
OUT at 0.1 usdt
Market Sentiment: Monitor Velas ( LSE:VLX ) price movement, as the analysis mentions its correlation with WAGYUSWAP's performance.
Volume Confirmation: Entry and breakout trades must be supported by a significant volume increase to validate the move.
Macro Conditions: Keep an eye on overall cryptocurrency market trends, as they can impact price dynamics

Final Opportunity to Bid on $WIFGiven the active monthly and weekly trends, it's a good opportunity to bid into the mid-impulse zone. If the price fails to hold at $3, I’ll look to buy closer to $2.50.

SUIUSD Still holding the 1D MA50 after 4 months! Bullish to $10.Sui (SUIUSD) has been trading within a Channel Up since the August 05 2024 market bottom. The last 10 days of December are seeing a vicious test of the 1D MA50 (blue trend-line), which is so far holding as Support.
In fact the last time we had a 1D candle close below it, was 4 months ago (September 05 2024). With the 1D RSI making a bullish reversal and breaking above its MA (yellow trend-line) while the 1D MACD is about to make a Bullish Cross, both indicators in similar fashion as the bottoms of October and September 2024, we treat the current consolidation above the 1D MA50 as the strongest buy signal of the past 2 months.
The previous two Bullish Legs both rose by exactly +219.25%, so our Target is currently a little below that margin at $10.000.
-------------------------------------------------------------------------------
** Please LIKE 👍, FOLLOW ✅, SHARE 🙌 and COMMENT ✍ if you enjoy this idea! Also share your ideas and charts in the comments section below! This is best way to keep it relevant, support us, keep the content here free and allow the idea to reach as many people as possible. **
-------------------------------------------------------------------------------
💸💸💸💸💸💸
👇 👇 👇 👇 👇 👇

IOTA/USDT NEW INCREASE PossibilityIOTA/USDT NEW INCREASE Possibility
Data shows that IOTA can show new volume coming time frames.

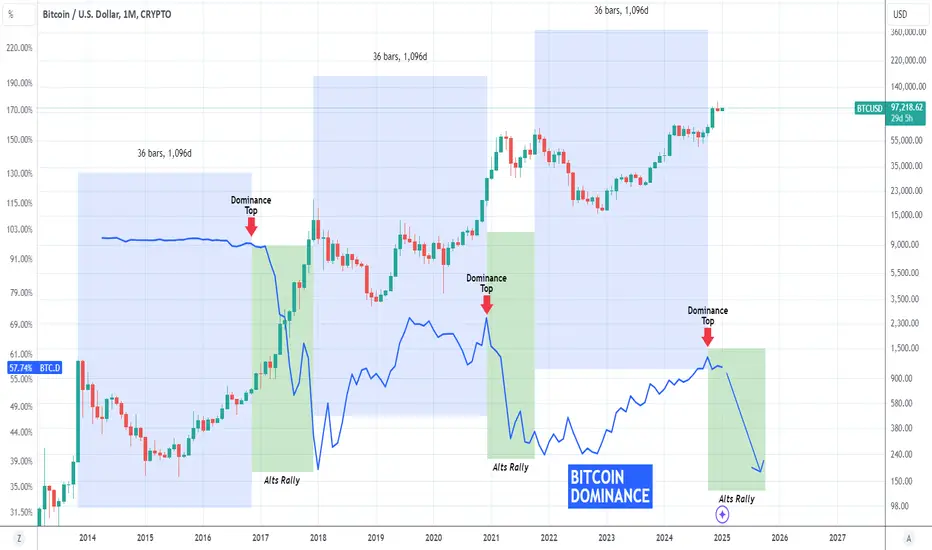
BITCOIN Dominance drop is about to trigger a massive Altseason!Bitcoin (BTCUSD) closed December on a marginally bearish 1M candle and is expected to start the 3rd year (2025) of the current Bull Cycle on strong bullish pressure.
As you can see on this chart, BTC Dominance (blue trend-line) has started to decline already since October 2024. That is when Bitcoin completed 36 months (1096 days) from the previous Cycle top (green candle).
This is a highly cyclical pattern as BTC Dominance during previous Cycles dropped every time Bitcoin completed 36 months from the previous All Time High (ATH). That was when the Altseason started, which is the most aggressive part of the Altcoin market.
Based on this chart we are about to see an accelerated drop on Bitcoin's dominance, with earnings and added capital being transferred to Altcoins, causing a new Altseason.
-------------------------------------------------------------------------------
** Please LIKE 👍, FOLLOW ✅, SHARE 🙌 and COMMENT ✍ if you enjoy this idea! Also share your ideas and charts in the comments section below! This is best way to keep it relevant, support us, keep the content here free and allow the idea to reach as many people as possible. **
-------------------------------------------------------------------------------
💸💸💸💸💸💸
👇 👇 👇 👇 👇 👇
SOLUSD charging for the 1D MA50. New rally started.Solana (SOLUSD) made a new 10-day High as it is rising aggressively today towards the 1D MA50 (blue trend-line), which is the first level of Resistance. We expect this rally to be the start of the new Bullish Leg of the 5-month Channel Up for three reasons.
Firstly, last week's Low was exactly on Support Zone 2, which is the pivot level of the October 29 High. We've had the same bounce on Support Zone 1 when the previous Bullish Leg of the Channel Up started on September 06 2024.
Secondly, the December Low almost tested the 1D MA200 (orange trend-line) before rebounding, which is the long-term Support. This is now exactly on the bottom of the Channel Up.
Thirdly, the December 22 Low also made the 1D RSI rebound on the oversold barrier (30.00). As you can see, every time the RSI touched this oversold level since April 13 2024, it was a strong buy signal to at least the 0.786 Fibonacci retracement level.
As a result, our short-term Target 1 is $242.00 (the 0.786 Fib). Beyond that, if the price breaks above Resistance 1 (265.00), we will buy the bullish break-out and target the top (Higher Highs trend-line) of the Channel Up at $380 (Target 2). As you can see, that would be a +119% rise from the December Low, similar to the % rise of the first Bullish Leg.
-------------------------------------------------------------------------------
** Please LIKE 👍, FOLLOW ✅, SHARE 🙌 and COMMENT ✍ if you enjoy this idea! Also share your ideas and charts in the comments section below! This is best way to keep it relevant, support us, keep the content here free and allow the idea to reach as many people as possible. **
-------------------------------------------------------------------------------
💸💸💸💸💸💸
👇 👇 👇 👇 👇 👇

Hoping for a Dip, but Also Some Thrills: Shorting $ADA!CRYPTOCAP:ADA Short Setup:
Wanted some extra adrenaline in my life, so I’m shorting CRYPTOCAP:ADA here.
Simple setup: First time testing the monthly block. If this week closes below $1.18, it will add confluence.
Aiming for sub-80c. BINANCE:ADAUSDT

STEEM/USDT BREAK Possibility STEEM/USDT BREAK Possibility
The coin has a high chance of breaking in the coming time.
We will follow this coin to see if it can gain new levels.
Normally this coin is not standard for trading, but it shows a new volume trending view.

DOGEUSD Don't let this consolidation discourage you.Dogecoin (DOGEUSD) has been trading sideways for the past 10 days, ever since the December 20 Low, following the 1D MA50 (blue trend-line) bearish break-out from the December 08 High. That was a -45% decline and naturally the current inability to reclaim those levels has many investors worried.
Technically however, this is nothing more than a standard Accumulation Phase, where investors tend to take their time and buy DOGE below the 1D MA50 following a rally's correction. During this Bull Cycle, we have already seen two such phases and the one most common to the current one is the one exactly one year ago following the December 10 2023 High.
As you can see both of those Highs were formed after a 1D Golden Cross. The January - February 2024 Accumulation Phase took place also after the 1D RSI bottomed on the 34.00 level. After this 2-month consolidation, the price started the Parabolic Rally sequence that peaked on the 3.0 Fibonacci extension.
If the pattern continues to be repeated, we are looking at a $1.500 Target at least by March - April 2025.
-------------------------------------------------------------------------------
** Please LIKE 👍, FOLLOW ✅, SHARE 🙌 and COMMENT ✍ if you enjoy this idea! Also share your ideas and charts in the comments section below! This is best way to keep it relevant, support us, keep the content here free and allow the idea to reach as many people as possible. **
-------------------------------------------------------------------------------
💸💸💸💸💸💸
👇 👇 👇 👇 👇 👇
