Crypto TOTAL Market cap on the verge of a correctionThe crypto market just had a decent recovery from its latest crash on Black Monday. Now, it seems we can expect another low based on the market structure and technical analysis.
Historically, September has often been a red month for markets. What I expect is a quick flash in the market before it goes up to make new highs, starting the main bull market we've all been waiting for.
This correction to $1.5T will provide the liquidity and fuel for strong bullish momentum toward the main target of $6-7T in the TOTAL Crypto Market Cap IMO. DYOR
Cryptocurrencies

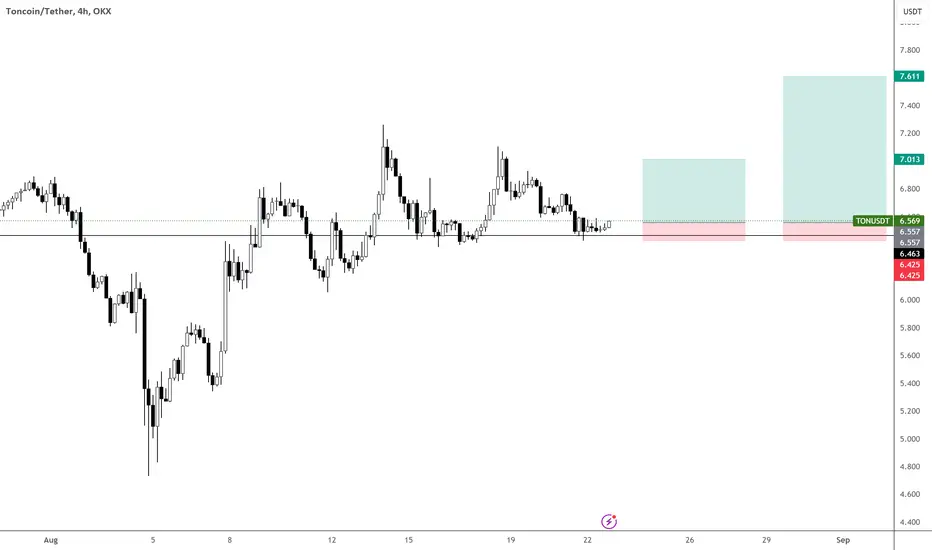
TON - TONS of COINS MOVING!!!Why not try to bet on things with strength?
This one still keeping the trend intact. Many have been acted strongly like NYSE:FET LSE:ONDO $RUNE. Worth to try this one out.
Had two bearish retest at $7 with no real follow through. Still staying above $6.4.
Time to go long and wait what the weekend can bring us.
BITCOIN Why holding this Support Zone for 6 months targets $100kBitcoin (BTCUSD) will close the month of August this week and the 1M candle not only rebounded aggressively on the 1W MA50 (red trend-line) but also held the Symmetrical Pivot Zone for the 6th straight month.
This Zone is critical because during the previous Cycle in late 2021 it served as Resistance and since the recent March 2024 break-out, it has been acting as Support.
The Bullish Waves on the 2-year Channel Up indicate that after this month closes, $100000 is well within reach.
Do you think this is the start of the 100k rally? Feel free to let us know in the comments section below!
-------------------------------------------------------------------------------
** Please LIKE 👍, FOLLOW ✅, SHARE 🙌 and COMMENT ✍ if you enjoy this idea! Also share your ideas and charts in the comments section below! This is best way to keep it relevant, support us, keep the content here free and allow the idea to reach as many people as possible. **
-------------------------------------------------------------------------------
💸💸💸💸💸💸
👇 👇 👇 👇 👇 👇

Bitcoin - The Dip Takes No Prisoners!I doubt it will go below $58k. So stop thinking another pullback will come to re-enter back in. That's not going to happen, 55k was the second best entry option for those who missed the retest at 50k.
Time to look for another entry closer to 58-59k
The price action is very telling and, for the most part, the bottom is in. Will we get a double confirmation on another retest of 53-54k? Not likely.
Slow climb from here to leave everyone on the sidelines!

Popcat - Can the cat bounce?Have a good feeling about this coin.
Great performance in comparison with recent memes.
Will try to buy as close to 40c in anticipation of a higher low.
Overall market still undecisive but there a few clear opportunities and I see Popcat as one. Already mentioned RUNE as a long term play and obviously SOLANA.
Keep in mind BTC needs to hold above 54-55k or things go from neutral to extremely bearish.
SL: Will manually close this one if it fails.

GALAUSD keep an eye for this +200% profit opportunity.Gala (GALAUSD) has been trading within a Channel Down, similar to all such patterns since the past 2 years. In fact this is the 3rd straight Channel Down occurrence since August 2022 and they've all bottomed around the same levels, before breaking-out the formation above them.
What confirmed the bullish break-out each time has been a 1D candle closing above the 1D MA50 (blue trend-line). This level is being tested today for the first time since June 07 2024. If we do get that candle closing above, consider it a buy signal and the minimum Target the previous Channel break-outs have achieved has been a little above the 0.786 Fibonacci retracement level.
As a result, our medium-term Target is 0.0600.
-------------------------------------------------------------------------------
** Please LIKE 👍, FOLLOW ✅, SHARE 🙌 and COMMENT ✍ if you enjoy this idea! Also share your ideas and charts in the comments section below! This is best way to keep it relevant, support us, keep the content here free and allow the idea to reach as many people as possible. **
-------------------------------------------------------------------------------
💸💸💸💸💸💸
👇 👇 👇 👇 👇 👇

BITCOIN The Volatility Index is showing the way to 100kBitcoin (BTCUSD) undoubtedly shares a relationship with the Volatility Index (VIX), even though not 100% tight, being a speculative financial asset. Naturally the two are on a negative correlation, meaning that when volatility hits the market and VIX rises, BTC rises and vice versa, similar to what happens against stocks.
Following the massive volatility spike on the weeks of July 29 and August 05, VIX quickly corrected back to its 1W MA50 (blue trend-line), which has been its pivot line since the Channel Down started 2 years ago.
Bitcoin on the other hand is already significantly above its 1W MA50, as on the week of VIX's aggressive volatility, it managed to test it and held. Opposite to VIX, Bitcoin has been trading on an upward trend, illustrated on today's analysis by a Fibonacci Channel. Initially the 1.0 Fib has been its top but then when broken, it topped on the 1.5 Fib extension.
As a result, we expect that when VIX finally closes below its 1W MA50, it will seek its 1-year Support, the Diverging Lower Lows trend-line and that will propel Bitcoin to its 1.5 Fib extension again. If that takes place towards the end of the year, we expect $100k to have been reached.
Do you think this correlation model will materialize 100k for Bitcoin? Feel free to let us know in the comments section below!
-------------------------------------------------------------------------------
** Please LIKE 👍, FOLLOW ✅, SHARE 🙌 and COMMENT ✍ if you enjoy this idea! Also share your ideas and charts in the comments section below! This is best way to keep it relevant, support us, keep the content here free and allow the idea to reach as many people as possible. **
-------------------------------------------------------------------------------
💸💸💸💸💸💸
👇 👇 👇 👇 👇 👇

BITCOIN 5month correction is over. Is 200k the minimum Target??Almost 1 year ago (September 05 2023, see chart below), we published the following idea on Bitcoin (BTCUSD), which very illustratively presented the potential course of the new Bull Cycle:
As you can see, BTC managed to trade an entire year rising within this green Arc pattern and always below the Cyclical Pivot trend-line that emerged from the bottom of the 2018 Bear Cycle.
Given that historically the Bull Cycle lasts post-Halving almost the time it lasted from the bottom to the Halving, we should expect its top around December 2025 - January 2026 and if it is on the Cyclical Pivot trend-line, then it could be as high as $400k.
However, even on a less optimistic scenario where it lasts 1064 days (152 weeks) from the Bottom (not counting FTX crash), like the 2015 - 2017 Bull Cycle, we can expect a peak a little over $200000 on the Cyclical Pivot trend-line.
It is important to notice that the 1W RSI is recovering from the overbought volatility correction, indicating that BTC should now resume the long-term bullish trend and make a new All Time High soon. Needless to say, the 1W MA50 has to hold, in order to support this bull trend as in all previous Cycles.
But what do you think? Has the market started the new bullish wave and if so, will it reach at least 200k? Feel free to let us know in the comments section below!
-------------------------------------------------------------------------------
** Please LIKE 👍, FOLLOW ✅, SHARE 🙌 and COMMENT ✍ if you enjoy this idea! Also share your ideas and charts in the comments section below! This is best way to keep it relevant, support us, keep the content here free and allow the idea to reach as many people as possible. **
-------------------------------------------------------------------------------
💸💸💸💸💸💸
👇 👇 👇 👇 👇 👇

Bitcoin(BTC/USD) Daily Chart Analysis For Week of Aug 16, 2024Technical Analysis and Outlook:
During this week's trading, Bitcoin underwent a retest of our Mean Resistance level of 61700 and, subsequently, the Mean Support level of 57400, marking the completion of the Interim Coin Rally at 62600. The presence of intermediary selling pressure may lead to a decline in the coin's price action toward the Mean Support level of 56600, 54000 and potentially result in a retesting of the completed Interim Coin Dip at 50000. On the positive side, the overall trend remains optimistic, with a focus on retesting the completed Interim Coin Rally at 62600 and potential extensions to the Mean Resistance levels of 65500 and 68500, respectively.

BTCThink we are inside w4 and are about done here with wave E of 4.
It is always possible for the 4th to test all the way down to the 4th to one lesser degree.
But when inside a triangle is the only exception.
So if my triangle is correct then no retest to $36-$40k

BITCOIN Can it reach at least 150k?Bitcoin (BTCUSD) closed last month (July) in green and even though August started on a very strong decline, the market has managed to recover most of its losses before the middle of the month.
This shows incredible buying force right on the 0.786 Fibonacci retracement level of the 2021 All Time High (ATH). Today's study is centered around the 1M time-frame and the Bullish Crosses of the MACD. In the past 10 years, we have had this formation only 5 times, all of which during Bull Cycles.
The most recent one was in June 2023 and needless to mention, BTC had a remarkable rally (its first of the Bull Cycle) after it. From a time perspective within the Cycle, the June 2023 Cross, resembles the Bullish Crosses of November 2019 and December 2015. They were formed 25 and 23 months respectively after the High of the previous Cycle and following their formation, BTC peaked exactly 24 months (731 days) later.
The June 2023 MACD Bullish Cross was formed 19 months after the previous Cycle High, so if it follows the previous peak patterns, then Bitcoin should peak around June 2025. Symmetrically, it appears that we are currently in a above 0.786 Fib consolidation phase (blue circles) as November 2020 and February 2017.
The bullish break-outs that followed after such consolidations, initiated the Bull Cycles' 2nd rallies to the eventual ATH. If we were to make a rough projection on that high, we can look into the Channel Up since 2014. That pattern formed the Cycle Highs above it every time (red arcs), so technically we could be looking at values between 200k - 300k.
However even if we follow a 'conservative' path within the Channel Up, if BTC hits the top of that dotted Channel, it will reach a price as high as $150000, which in our opinion is a very desirable level to start taking long-term profits.
But what do you think about this whole scenario? Is the 1M MACD Bullish Cross symmetry about to start the 2nd rally of this Cycle and if yes, can it reach 150k at least? Feel free to let us know in the comments section below!
-------------------------------------------------------------------------------
** Please LIKE 👍, FOLLOW ✅, SHARE 🙌 and COMMENT ✍ if you enjoy this idea! Also share your ideas and charts in the comments section below! This is best way to keep it relevant, support us, keep the content here free and allow the idea to reach as many people as possible. **
-------------------------------------------------------------------------------
💸💸💸💸💸💸
👇 👇 👇 👇 👇 👇

SUIUSD Very strong bullish break-out signal.Sui (SUIUSD) has gone +140% from last week's Low (August 05) and broke above two major medium-term Resistance levels: 1) The Internal Lower Highs trend-line) and 2) The 4-month blue Channel Down.
The last time the price broke above such major Lower Highs trend-line was on November 04 2023. That initiated a rally that peaked just below the 1.236 Fibonacci extension, which gave way to the 4-month blue Channel Down.
An equally strong bullish signal is the break-out of the 1W RSI above its MA line. As a result, we have strong reasons to turn bullish on Sui on the long-term, targeting 2.7000.
-------------------------------------------------------------------------------
** Please LIKE 👍, FOLLOW ✅, SHARE 🙌 and COMMENT ✍ if you enjoy this idea! Also share your ideas and charts in the comments section below! This is best way to keep it relevant, support us, keep the content here free and allow the idea to reach as many people as possible. **
-------------------------------------------------------------------------------
💸💸💸💸💸💸
👇 👇 👇 👇 👇 👇

A Guide on How to Stay on the Right Side of Market RiskStaying on the right side of the market is the only thing that matters in investing. The goal is simple: be long the things that go up and avoid the things that go down. Although this sounds straightforward, investors often focus too much on the upside potential and forget about the downside. In reality, avoiding the downside is by far the most important factor that will have the biggest impact on your total returns. This is because a -50% loss will always require a +100% gain just to break even.
Step 1: Follow the Trend
The most effective method to stay on the right side of the market is by following the trend, primarily through moving averages. The two most common types are the Simple Moving Average (SMA) and the Exponential Moving Average (EMA). The EMA assigns more weight to recent price movements, making it more responsive and effective for signalling the start of a downtrend, while the SMA offers a clearer view of the longer-term trend.
The simplest way to construct a trend-following indicator is to combine a short-term EMA with a long-term EMA. A buying signal is triggered when the short-term EMA crosses above the long-term EMA, and a selling signal is triggered when it crosses below. This systematic approach ensures clear and actionable signals.
Optimizing this strategy involves backtesting various EMA combinations to strike a balance between minimal trading frequency, lowest maximum drawdown, and highest profit factor. It’s also crucial to select assets that have historically adhered to trends, as these are more likely to continue doing so.
Assets that typically adhere to trends, such as cryptocurrencies, fiat currencies, commodities, and tech stocks, are often driven by speculative or uncertain future expectations. By incorporating a longer-term SMA and adding a safety margin to the calculation, you can help minimize false signals from the EMAs.
It’s advisable to compare asset performance not only against the USD pair but also against the safest investable asset in the selected asset class. This comparison helps determine if the additional risk is worth taking.
Step 2: Draw the Lines
Trend-following strategies are effective only with a clear market trend. Without it, prices may exhibit range-bound movements and generate false signals. Drawing trend lines and identifying horizontal support and resistance levels are crucial for enhancing the accuracy of these signals. The most reliable entry points typically follow a confirmed breakout from these lines, with older lines often indicating more significant breakouts.
When drawing trend lines, it’s crucial to use both normal and logarithmic chart scales. The most reliable trend lines appear consistent across these scales, with a breakout observed on both further confirming the trend.
Additionally, identifying reliable patterns like head and shoulders, inverse head and shoulders or double tops and bottoms can further validate trend breakouts. TradingView’s pattern recognition tools can automate this process and provide price targets, which can be helpful but are not always guaranteed.
Step 3: Understand the Macro
Following current macroeconomic conditions can enhance your understanding of the overall business cycle. The primary macro forces that influence asset markets are growth, inflation, and policy. These factors are subjective and not directly quantifiable, making them unsuitable for direct investment decisions. However, they are useful for assessing the market’s risk appetite, which should influence only your position size and not your systematic approach.
The US Composite Leading Indicator (CLI) is one of the most informative macroeconomic indicators, providing insights into potential economic growth trends and helping anticipate inflections in the business cycle.
Monitoring the US inflation and unemployment rates is also beneficial, as they significantly influence monetary policy. While minor fluctuations may not provide much insight, sustained trends that align with the Federal Reserve’s targets of 2% inflation and low unemployment are indicative of a healthy economy.
Furthermore, tracking global liquidity can reveal the real-time effects of monetary and fiscal policies implemented by major central banks and governments. This serves as a valuable tool to assess the market’s risk appetite.
In conclusion, this guide helps investors stay on the right side of the market by adopting a systematic approach that captures bull markets while avoiding major downturns. Recognizing that the future is unpredictable and that markets are driven by momentum, this method can both preserve and grow your wealth in a less stressful way. A disciplined, systematic approach, executed dispassionately, is essential for navigating market uncertainties. All indicators discussed are publicly available or can be accessed on my profile.
Disclaimer: This article is for informational and educational purposes only and should not be construed as investment advice.

BITCOIN is right on track and even stronger than previous CyclesBitcoin (BTCUSD) has experienced a sharp drop over the past 2 weeks, causing a test of the 1W MA50 (blue trend-line), which as explained in a previous analysis, this has only happened once during a Bull Cycle.
As today's idea shows though, what caused massive panic and liquidations recently, can be seen as merely a technical attempt of the market to re-adjust and harmonize what was a very aggressive bull run up until March, towards the mean, relative to past Cycles.
More specifically in the last 2 Cycles, as you can see, 630 days after the Cycle bottom, Bitcoin was trading just below its 0.236 Fibonacci retracement level, while on the current Cycle the recent drop took place just over it. This means that the current bull run came closer to the trend of the last two, but remains more aggressive.
As a result, we expect BTC to resume the rally and continue on a more aggressive tone than in the past and by early 2025 break above 100k and possibly by next Summer reach the -0.618 Fibonacci extension, a level that was achieved during all past Cycles.
So what do you think? Has this BTC Cycle been normalized after the recent drop and is now ready to resume the uptrend? Feel free to let us know in the comments section below!
-------------------------------------------------------------------------------
** Please LIKE 👍, FOLLOW ✅, SHARE 🙌 and COMMENT ✍ if you enjoy this idea! Also share your ideas and charts in the comments section below! This is best way to keep it relevant, support us, keep the content here free and allow the idea to reach as many people as possible. **
-------------------------------------------------------------------------------
💸💸💸💸💸💸
👇 👇 👇 👇 👇 👇

Bitcoin(BTC/USD) Daily Chart Analysis For Week of Aug 9, 2024Technical Analysis and Outlook:
Bitcoin encountered a substantial decline during this week's trading session, reaching Mean Support 55800 and Key Support 53800, and subsequently retesting completed Outer Coin Dip 54000. The considerable selling pressure finalized Outer Coin Dip 51000 and major Key Support 50700. The overall upward trend remains ongoing, leading to the establishment of a new Mean Resistance 61700 and the completion of the Interim Coin Rally 62600. The potential extension towards Mean Resistance 65500 and 68500 holds significant promise for the forthcoming week's sessions. The likelihood of temporary downward pressure toward the Mean Support at 57400 exists before the coin resumes its upward trajectory.

HNTUSD can go 10x from here.It was quite long ago (December 06 2023, see chart below) the last time we looked into Helium (HNTUSD) but it did offer nonetheless a solid bullish break-out opportunity:
Now Helium is having (if the week concludes at least on the current levels) the strongest 1W bullish reversal of the Cycle. It broke above both the 1W MA50 (blue trend-line) and the Lower Highs trend-line of February. That is a clear technical bullish break-out that aims at the final Resistance of the 1W MA200 (orange trend-line).
A similar pattern was formed during its previous Bull Cycle with the current rebound resembling the November 2020 bounce. This initiated a +3067% rise before the next medium-term pull-back.
As a result, we see strong evidence for an upcoming +1380% rise from the current level with our Target being $90.00.
-------------------------------------------------------------------------------
** Please LIKE 👍, FOLLOW ✅, SHARE 🙌 and COMMENT ✍ if you enjoy this idea! Also share your ideas and charts in the comments section below! This is best way to keep it relevant, support us, keep the content here free and allow the idea to reach as many people as possible. **
-------------------------------------------------------------------------------
💸💸💸💸💸💸
👇 👇 👇 👇 👇 👇

BITCOIN Amazing 'Golden Ratio' correlation showing the way!Bitcoin (BTCUSD) is under heavy pressure lately, basically it has paused for the past 5 months the uptrend that started in late 2022. We have discovered a remarkable correlation with Gold (XAUUSD) and Russell 2000 (RUT) in the form of the GOLD/RUT ratio (blue trend-line). This correlation, which is a negative one (i.e. when BTC rises the GOLD/RUT ratio falls and vice versa), is present on a cyclical basis.
This means that during every Cycle, it displays a behavioral pattern that is common. That is the following:
When the GOLD/RUT ratio peaks and starts falling by forming Lower Highs, Bitcoin tends to start its parabolic rally (green arc) of the Bull Cycle, above previous All Time Highs. This usually takes place a little before the Halving.
Right now it appears that it happened on the last Halving (mid April), assuming we see the ratio forming Lower Highs from now on. If it does, BTC will most likely start the most aggressive part of the Bull Cycle. The Sine Waves that track the GOLD/RUT peak, suggest that indeed the April High may have been the new peak. It remains to be seen if Lower Highs will be formed.
What do you think will happen? Can this be BTC's "Golden ratio" that reveals the parabolic rally? Feel free to let us know in the comments section below!
-------------------------------------------------------------------------------
** Please LIKE 👍, FOLLOW ✅, SHARE 🙌 and COMMENT ✍ if you enjoy this idea! Also share your ideas and charts in the comments section below! This is best way to keep it relevant, support us, keep the content here free and allow the idea to reach as many people as possible. **
-------------------------------------------------------------------------------
💸💸💸💸💸💸
👇 👇 👇 👇 👇 👇

XRPUSD Incredibly strong 1D candle. Sign of a bullish break-out?A little over a month ago (June 25, see chart below), we posted a roadmap on XRPUSD looking towards an aggressive break-out and rally above its multi-year Triangle:
Yesterday, the crypto made a massive 1D green candle (end of SEC's lawsuit), against the majority of the market sentiment and yet again it almost touched the top (Lower Highs trend-line) of the 1-year Channel Down pattern that started on the July 13 2023 High.
Just a week ago (July 31 2024), we had the last test (and rejection) of that top so a test that soon could be an early warning of a bullish break-out.
If the price breaks and closes the candle above it, we expect a W-shaped recovery that could target the 2.0 Fibonacci extension at 1.1275.
If rejected at the top again though, we would expect a re-test of the Channel's 0.618 Fib level, with a rough Target at 0.4000.
-------------------------------------------------------------------------------
** Please LIKE 👍, FOLLOW ✅, SHARE 🙌 and COMMENT ✍ if you enjoy this idea! Also share your ideas and charts in the comments section below! This is best way to keep it relevant, support us, keep the content here free and allow the idea to reach as many people as possible. **
-------------------------------------------------------------------------------
💸💸💸💸💸💸
👇 👇 👇 👇 👇 👇

(1D) BTCUSD 3-3-5 REGULAR FLAT CORRECTIONTHERE'S A CHANCE BITCOIN MAY GO TO $43000. We hit my nominal target of $56000 three times now during this larger time frame correction, which started at the ATH in March. It SEEMINGLY looks like we got the 'final' bounce off the 50% retracement fib @ $49000. HOWEVER, I don't like the way she's just hanging out mid-air between trend lines. This typically gives me the indication that the move isn't over just yet. I've updated my wave counts; looks like we are dealing with a 3-3-5 REGULAR FLAT PATTERN, which may terminate around $43000 nominal, which coincides with the next available support trend line and 61.8% retracement fib. Let's see if this thesis plays out. Just a bit more pain left until we see upside impulse again towards ATH's. Be patient and hang tight! IF that support doesn't hold, we are going to mid-30K.

BITCOIN priced the new bottom. Strong evidence of new ATH ahead.With tensions and volatility continuing among the markets, we revisit a chart that we published almost 1 year ago (August 14, see chart below) when the market was again in a time of high volatility and was consolidating within a wide margin for a rather long period of time (April 17 2023 - August 21 2023):
Back then we stated that a huge rally was in the making and only one week later, the market delivered and BTC rose from 25k to +70k in a span of 6 months. It was the unique Bullish Cross on the 3W KTS indicator that only happens once in every Cycle that cemented our bullish projection.
BTC is now on a consolidation phase similar not only to the 2023 one (Apr - Aug) but also to the past Cycles that followed the KTS Bullish Cross. It is noticeable that there are two such consolidation phases in every Bull Cycle and currently we are inside the 2nd.
This is strong evidence suggesting that we are about to experience multiple green months in the coming quarters.
Do you agree or you feel the economic slowdown fears will prevail and break this structure? Feel free to let us know in the comments section below!
-------------------------------------------------------------------------------
** Please LIKE 👍, FOLLOW ✅, SHARE 🙌 and COMMENT ✍ if you enjoy this idea! Also share your ideas and charts in the comments section below! This is best way to keep it relevant, support us, keep the content here free and allow the idea to reach as many people as possible. **
-------------------------------------------------------------------------------
💸💸💸💸💸💸
👇 👇 👇 👇 👇 👇

Is This the Start of a Recession? Why You Shouldn’t PanicMarkets have been selling off amid the latest fears of a recession, with the NASDAQ dropping over 10% and Bitcoin dropping over 20% in just a matter of days. Last Friday’s unemployment report further affirmed investors’ sentiment, exceeding expectations by 0.2% and sparking one of the biggest rotations of capital since the COVID crash. Investors are gearing up for tough times by flocking to bonds and panic-selling risky assets, but has a recession really begun? Should you panic?
Understanding the Economic Data
Recent unemployment numbers have triggered the Sahm Rule Recession Indicator, created by Claudia Sahm in 2019 to identify recessions as they start. This indicator is triggered when the three-month simple moving average (SMA) of the US unemployment rate rises by 0.5% above the lowest rate observed over the past year. Despite its growing popularity, it’s important to note that this tool has never actually identified any recessions in real time, except for the 2020 recession.
In contrast, more established indicators like the Smoothed U.S. Recession Probabilities, developed by Marcelle Chauvet and James Hamilton in 1998, have not indicated that the economy is currently in a recession. Unlike the Sahm Rule, this nearly 26-year-old tool, which relies on complex calculations and various datasets, accurately identified the 2001 and 2008 recessions in real time.
Moreover, recessions in the US typically occur when the US Composite Leading Indicator (CLI) is on a downward trend, which hasn’t happened yet. This further suggests that other indicators besides the unemployment rate aren’t currently showing signs of concern.
Even though the unemployment rate has risen sharply, other leading unemployment indicators, such as initial claims and continued claims, remain at historically low levels. Typically, these leading indicators rise sharply before a substantial increase in the unemployment rate, not the other way around.
With the market pricing in substantial rate cuts following the unemployment numbers, yields have dropped, increasing the spread between the short and long ends of the yield curve. Historically, recessions haven’t usually unfolded during inverted yield curves.
Additionally, expected looser monetary policy from the Fed combined with surprisingly tighter monetary policy from the BOJ pushed the DXY substantially lower. This resulted in a breakout in global liquidity, which is inversely correlated with the DXY and serves as a helpful indicator of future trends in risk assets.
Understanding the Market Trends
While the real economy hints that we are likely not currently in a recession, it’s crucial to examine the charts to better understand the downside risks and how to position oneself in order to stay on the right side of market risk. The spike in the VIX and the put-to-call ratio on Monday indicated extremely fearful sentiment, which historically suggests limited downside risk and the potential for a short-term rebound.
The sudden surge in fear was reflected in the sharp increase in bond prices as investors shifted from high-risk to low-risk assets. With bullish short-term and long-term trends since early June, bond prices have reached overbought conditions, suggesting they are likely to slow down in the short term but continue outperforming in the long term, aligning with market expectations of future rate cuts.
The inverse can be observed in the equity markets, with US indices in oversold conditions and exhibiting recent bearish short-term and long-term trends. This suggests that equities are likely to experience a short-term bounce but will continue to decline in the long term, providing a potential opportunity to sell.
The cryptocurrency market tells a similar but much more pronounced story, with bearish short-term and long-term trends evident since late June. Despite being oversold, the future outlook for the cryptomarket remains pessimistic and is likely to underperform equities, especially if investors continue to reduce risk.
This flight to the relative safety of mega caps has been a recurring theme since March 2021, when both the small cap and mid cap to mega cap ratios turned bearish, a trend that remains unbroken and is likely to continue unless a recession materializes and forces a shift to looser monetary policy.
Similar trends are likely to continue in the cryptocurrency markets, as evidenced by the breakout in Bitcoin dominance, which currently positions Bitcoin’s market cap at 62% of the entire cryptocurrency market when stable coins are excluded from the calculation.
Concluding Thoughts
While the market is starting to panic amid recessionary fears, the data does not yet confirm that the economy is currently entering a recession. Investors should avoid panic selling, as a rebound is likely to occur in the short term given the current overextended conditions. For the mid to long term, the situation calls for a cautious approach, focusing on managing risk and gradually shifting from riskier to less risky assets, as indicated by longer-term trends in asset markets.
Disclaimer: This article is for informational and educational purposes only and should not be construed as investment advice.

CEEK/USDT NEW INCREASE VOLUMECEEK/USDT shows the low time frame possibility for new volume which can affect the price for an uptrend. ( depend all on high chance) There are no guarantees in the markets.
The new increase volume updates always start with interest if there is a confirmation to follow and if there is a building with a hold for a time.
90% of coins this time are not building coins. Some % also show a start fake trend and return to where it started. time frame confirmation + high levels building is important for a healthy coin.

SOL aint looking that goodYes, the market structure isn't really broken and it hasn't lost any major support
Yes, it can go higher, a lot higher,
and yes it's been one of the best performers of this cycle .
Which makes it rather risky to short it. But it doesn't change the fact that it:
- Failed to beat critical levels
- By being one of the best performers, retail is loving it.
- Everyone is too comfy in longs.
The level i had for SOL back in last year happened to be the exact bottom, so I'm being cautious here.
