NEAR is approaching an important resistanceHey Traders, in today's trading session we are monitoring NEARUSDT for a selling opportunity around 5.600 zone, NEARUSDT is trading in a downtrend and currently is in a correction phase in which it is approaching the trend at 5.600 support and resistance area.
Trade safe, Joe.
Cryptocurrencies

NKN/USDT NEW VOLUME INCREASENKN shows on the low time frame possibilities for new increases.
We will follow up if NKN is able to increase the new volume
Coming time frames can be important for NKN for new increases and to see if it can be get confirmed.

Ethereum Potential DownsidesHey Traders, in today's trading session we are monitoring ETHUSDT for a selling opportunity around 3080 zone, Ethereum is trading in a downtrend and currently is in a correction phase in which it is approaching the trend at 3080 support and resistance area.
Trade safe, Joe.

BTC WILL RECOVERY BACK! 65K - BTC did always recovery back NEW BTC uptrend TREND ACTIVATION SINCE 30 MIN
we have seen an unexpected breakdown in BTC in the last few days since there are many news trends.
BTC has proof time by time that it can recover, and we expect that it will do so this time.
We are looking for the next 8H so that BTC can hold the volume and start to make a new recovery.
Since the history of BTC --> it has always recovered from halving to halving.
$53400 can become an important DIP buying y trend whales with a return to 65K
Don't follow news, follow only your study depending on data and TA.
all that is going on BTC, shows on price action.
56K did show before to be an important return point for the trend.

Bitcoin is approaching a significant resistanceHey Traders, in today's trading session we are monitoring BTCUSDT for a selling opportunity around 57000 zone, Bitcoin is trading in a downtrend and currently is in a correction phase in which it is approaching the trend at 57000 support and resistance area.
Trade safe, Joe.

UNIUSDT Potential DownsidesHey Traders, in today's trading session we are monitoring UNIUSDT for a selling opportunity around 7.60 zone, UNIUSDT is trading in a downtrend and currently is in a correction phase in which it is approaching the trend at 7.60 support and resistance area at 7.60 support and resistance area.
Trade safe, Joe.

BITCOIN Is this the pattern that will save the day?Bitcoin (BTCUSD) is experiencing yet another brutal sell-off today that is bringing it even closer to the 1W MA50 (red trend-line). As mentioned on previous analyses, the 1W MA50 is BTC's ultimate Support trend-line throughout a Bull Cycle and you can clearly see that on the right chart.
During all its Bull Cycles, the 1W MA50 has supported the Parabolic Rally, until it decisively broke and confirmed the new Bear Cycle. It is therefore a standard go-to signal for long-term investors.
On the 1D time-frame (chart on the left), there is an underlying Channel Up that supported the last major medium-term pull-back on September 11 and October 11 2023. We are only a few clicks from testing this Channel's bottom, which is still around $5000 above where the 1W MA50 is right now.
As mentioned previously, chances are that BTC turns sideways and approaches the 1W MA50 while it consolidates sideways and forms a bottom. Notice how the Megaphone pattern that started on the March 14 2024 High, would be ideal for materializing this scenario. Even a marginal break of the 1W MA50 doesn't constitute a long-term bearish reversal, as long as the 1W candle still closes above it (like on June 21 2021).
So while we do have our natural Cyclical Support level, do you also think that this Channel Up will save the day for BTC and stop further bleeding and the possibility of an early Bear Cycle? Feel free to let us know in the comments section below!
-------------------------------------------------------------------------------
** Please LIKE 👍, FOLLOW ✅, SHARE 🙌 and COMMENT ✍ if you enjoy this idea! Also share your ideas and charts in the comments section below! This is best way to keep it relevant, support us, keep the content here free and allow the idea to reach as many people as possible. **
-------------------------------------------------------------------------------
💸💸💸💸💸💸
👇 👇 👇 👇 👇 👇

INJUSDT Potential DownsidesHey Traders, in today's trading session we are monitoring INJUSDT for a selling opportunity around 23.25 zone, INJUSDT for a selling opportunity around 23.25 zone, INJUSDT is trading in a downtrend and currently is in a correction phase in which it is approaching the trend at 23.25 support and resistance area.
Trade safe, Joe.

PEPEUSD Will start forming a bottom. Be ready to buy.Pepe (PEPEUSD) is showing signs of proper structured price action as the prevailing pattern emerges as a Channel Up. Having broken today below the 1D MA100 (green trend-line) for the first time since February 24 2024, we anticipate that the new bottom (Higher Low) of the Channel Up will start getting formed.
Both Bearish Legs of the pattern where through Channel Down patterns (dotted) and the Bullish Legs that followed (dashed), were Channel Up patterns. A break above the 1D MA50 (blue trend-line) again, should confirm the start of the new Bullish Leg.
The 1D RSI though is already giving an early signal and on the next rebound, if we see successive 1D candles trading sideways, we will have an early buy opportunity. The ultimate Support level is of course the 1D MA200 (orange trend-line).
The previous Higher High was formed just below the 2.0 Fibonacci extension from the Low. As a result, our Target is now 0.00002500 (just below Fib 2.0).
-------------------------------------------------------------------------------
** Please LIKE 👍, FOLLOW ✅, SHARE 🙌 and COMMENT ✍ if you enjoy this idea! Also share your ideas and charts in the comments section below! This is best way to keep it relevant, support us, keep the content here free and allow the idea to reach as many people as possible. **
-------------------------------------------------------------------------------
💸💸💸💸💸💸
👇 👇 👇 👇 👇 👇

HAPPY JULY 4th with BITCOIN hitting the 1D MA200 after 9 months!Happy July 4th everyone! A little break from the traditional stock markets but not for crypto. Bitcoin (BTCUSD) in particular, just hit and broke below its 1D MA200 (orange trend-line) for the first time in almost 9 months (October 16 2023)!
Naturally this is a very strong long-term Support level and it is even more obvious on this 1D chart, where BTC's current consolidation is similar to the one from mid- April 2023 to mid-July 2023 (blue Rectangle).
With the long-term pattern being a Fibonacci Channel Up and the 1D MACD forming a sequence similar to the bottom formation that started on August 27 2023, Bitcoin is most likely entering the long-term Support Zone.
The ultimate Support level is the 1W MA50 (red trend-line) but we expect to come close to that not straight away vertically but in the next month while the price might trade sideways in similar fashion to September 2023.
In any case, since the November 2022 market bottom, this kind of distance from the 1D MA50 (blue trend-line), has been the most optimal buy entry and including the current one, we've only had 4 such opportunities.
But what do you think? Is this the right opportunity to buy heavily again on Bitcoin? Feel free to let us know in the comments section below!
-------------------------------------------------------------------------------
** Please LIKE 👍, FOLLOW ✅, SHARE 🙌 and COMMENT ✍ if you enjoy this idea! Also share your ideas and charts in the comments section below! This is best way to keep it relevant, support us, keep the content here free and allow the idea to reach as many people as possible. **
-------------------------------------------------------------------------------
💸💸💸💸💸💸
👇 👇 👇 👇 👇 👇

The best is yet to come. BTCAs you can see, BTC can still go further up. The cycle will be complete around September - October 2025, so we still have room for growing.
This is not financial advice.

CFXUSD Buy after it breaks above the 1D MA100.It's been too long since we last analyzed Conflux (CFXUSD) and on that analysis (January 26, see chart below) we got a clear bullish break-out signal that easily hit our 0.4000 Target:
The price has since entered a brutal sell-off below the 1D MA50 (blue trend-line) and the pattern that stands out the most is a Channel Up. The decline hasn't yet reached the bottom of that pattern, but it is getting close. Last time it completed approximately a -80% decline.
The signal to buy was given when the 1D RSI made a Triple Bottom below the 30.00 oversold barrier and was confirmed when the price broke above the 1D MA100 (green trend-line). We are waiting for that signal to buy and target 0.55000 (just below the Resistance and previous Higher High of the Channel Up).
-------------------------------------------------------------------------------
** Please LIKE 👍, FOLLOW ✅, SHARE 🙌 and COMMENT ✍ if you enjoy this idea! Also share your ideas and charts in the comments section below! This is best way to keep it relevant, support us, keep the content here free and allow the idea to reach as many people as possible. **
-------------------------------------------------------------------------------
💸💸💸💸💸💸
👇 👇 👇 👇 👇 👇

BITCOIN History rhymes and calls for as high as $300k!This is a post Halving update to the 'Fibonacci Channel blueprint' analysis we've made almost a year ago. The price action has been even more aggressive than what we expected so relevant adjustments had to be made.
On this chart, we yet again rely on the long-term time-frames of Bitcoin (BTCUSD) for a more meaningful illustration of its historic Cycles. Those are patterns that have repeated themselves over and over again, with some variations of course based on the current market conditions.
** The Fibonacci Channels **
Right now the price has completed 4 months of consolidation following the early March All Time High (ATH), always above the 1W MA50 (blue trend-line). This consolidation is consistent with all previous post-Halving price actions as BTC always traded sideways and accumulated in the weeks after the Halving, in preparation for the Parabolic Rally, the Cycle's most aggressive phase.
The previous Cycles topped near Fibonacci trend-lines of prior Cycle Channels. For example the December 2017 Cycle Top was formed just below the bottom (Fib 0.0) of the orange Fibonacci Channel that started from the previous Cycle bottom. The November 2021 Top was formed just below the middle (Fib 0.5) of the blue Fibonacci Channel. This could be a +0.5 Fib progression and in that case the Top of the current Cycle might be just below the top (Fib 1.0) of the black Fibonacci Channel that started on the December 2018 bottom.
At the same time, another condition that it 'needs' to fulfil is being just below the 0.0 Fib of the Blue Channel, similar to what happened in December 2017 (just below Fib 0.0 of the orange Channel).
** The Halvings and $200k **
The 1.0 Fib is currently a little under $300000, and as we mentioned after the consolidation of each Halving, Bitcoin posts the most aggressive (parabolic) rally of the Bull Cycle. So that leads us to assume that the Top of the current Bull Cycle will be at least $300k. To give a relative sense of pathing, we have plotted the 'post Halving rallies' of the previous three Cycles on the current Channel starting on Halving 4.
As you can see, the orange (2013) and black (2020 - 2021) lines are more aggressive than the purple (2016 - 2017) but the latter is the one that, as we've posted numerous times, the current Cycle has the most similarities with. If Bitcoin follows the purple price action within the black Fibonacci Channel, then it should reach $100k by December 2024 and $300k by August 2025. If instead it transitions to the more aggressive Cycle models, then it could reach those levels much earlier.
But what do you think? Is $300k realistic within the current Cycle? Feel free to let us know in the comments section below!
Feel free to let us know in the comments section below!
-------------------------------------------------------------------------------
** Please LIKE 👍, FOLLOW ✅, SHARE 🙌 and COMMENT ✍ if you enjoy this idea! Also share your ideas and charts in the comments section below! This is best way to keep it relevant, support us, keep the content here free and allow the idea to reach as many people as possible. **
-------------------------------------------------------------------------------
💸💸💸💸💸💸
👇 👇 👇 👇 👇 👇

Ethereum is approaching a decent resistance Hey Traders, in today's trading session we are monitoring ETHUSDT for a selling opportunity around 3,500 zone, Ethereum is trading in a downtrend and currently is in a correction phase in which it is approaching the trend at 3,500 support and resistance area.
Trade safe, Joe.

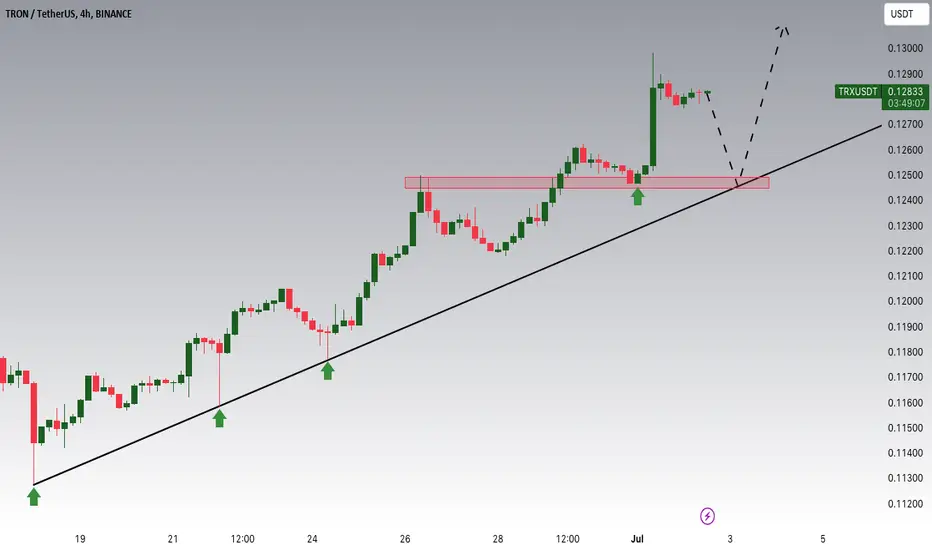
Tron is approaching a significant Support areaHey Traders, in today's trading session we are monitoring TRXUSDT for a buying opportunity around 0.12500 zone, Tron is trading in an uptrend and currently is in a correction phase in which it is approaching the trend at 0.12500 support and resistance area.
Trade safe, Joe.
BEAMUSD Bullish Cross aiming for at least 0.2200 short-term.BEAMUSD has been trading within a Channel Down pattern since the March 10 High and today is on the 3rd straight green 1D candle, following a 1D MACD Bullish Cross. That took place on the 0.015100 Support (almost January 23 Low), which makes the buy signal even stronger.
Each Bullish Leg of the Channel Down has been at least +46.88%, so we are targeting 0.02200 for our next Lower High.
If BEAM manages to close a 1D candle above the Channel Down, then we expect an aggressive bullish break-out to complete at least a +186.93% rise, similar to the one that led to the March 10 High.
-------------------------------------------------------------------------------
** Please LIKE 👍, FOLLOW ✅, SHARE 🙌 and COMMENT ✍ if you enjoy this idea! Also share your ideas and charts in the comments section below! This is best way to keep it relevant, support us, keep the content here free and allow the idea to reach as many people as possible. **
-------------------------------------------------------------------------------
💸💸💸💸💸💸
👇 👇 👇 👇 👇 👇

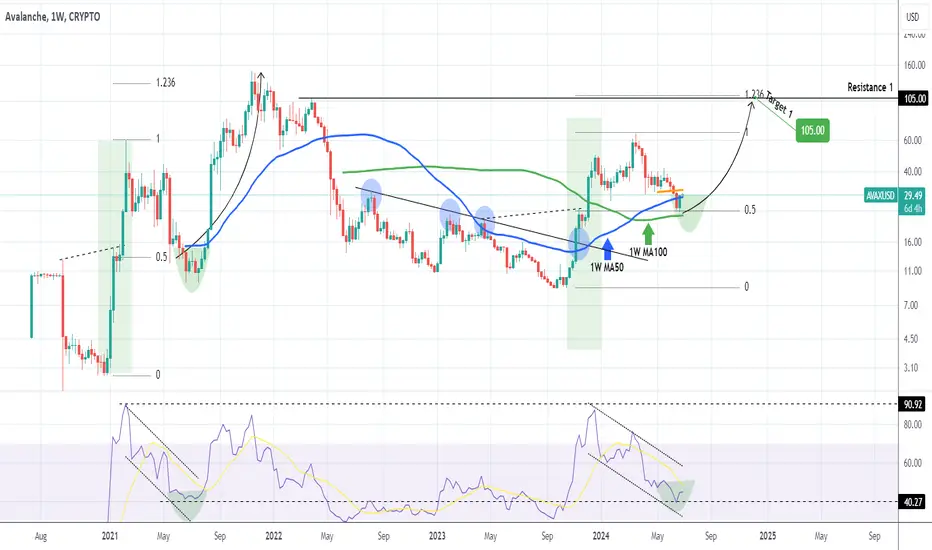
AVAXUSD Bottom formation in process. Target $105.007 months ago we published the following analysis (December 14 2023, see chart below), expecting Avalanche (AVAXUSD), to correct back to the 1.0 Fibonacci level after a potential $55.00 hit:
As you can see the price action didn't fail to deliver our projection, in fact it followed very tightly the February - July 2021 pre-rally pattern of the previous Bull Cycle. Right now it has found Support on the 1W MA100 (green trend-line), while the 1W RSI is on the exact Support level it was on the June 21 2021 bottom.
Even though a marginal decline is possible to satisfy the past condition of slightly breaking below the 0.5 Fib, the current levels are good enough to buy again for the long-term.
As in November 2021, our Target is again the 1.236 Fibonacci extension, which is currently just above the $105.00 Resistance.
-------------------------------------------------------------------------------
** Please LIKE 👍, FOLLOW ✅, SHARE 🙌 and COMMENT ✍ if you enjoy this idea! Also share your ideas and charts in the comments section below! This is best way to keep it relevant, support us, keep the content here free and allow the idea to reach as many people as possible. **
-------------------------------------------------------------------------------
💸💸💸💸💸💸
👇 👇 👇 👇 👇 👇
BTC HOLDING CYCLE PRICE ACTION AND CAN RETURN 65KBTC did break down in the last hours, but it is holding still the cycle trend.
BTC has still a high chance to return from this point trend of 60K to a level of 65K
BTC has many corrections on the way, and BTC was able to recover every time again.
sometimes it's better for BTC to get a correction to have a strong volume for an uptrend.
WE have seen last weeks BTC had issues with volume.

BITCOIN Will people regret not buying at this stage?Around this time last year (see chart below), we analyzed yet again the similarities of Bitcoin's (BTCUSD) current Cycle with the one in 2014 - 2017. In fact we were among the fist channels in late 2022 to bring that up as a strong possibility and as you can see Bitcoin didn't fail to deliver:
We have entered however a stage where, as the title says, people could regret if they haven't bought already as it might be the last opportunity to do so on such low prices. The time-frame on both charts is 3D and as you can see, the MA50 (blue trend-line) has been the most optimal buy entry throughout the 2015 - 2017 Bull Cycle.
If the similarities continue to unfold between the two Cycles, then last week's breach of the MA50, should be the best buying opportunity at this stage. As you can see, we are proportionally at the end of the blue elliptical pattern which in early 2017 consolidated around and mostly below the former All Time High (ATH) level and then started the Parabolic Rally.
Do you think the current MA50 touch has marked the start of this rally? Feel free to let us know in the comments section below!
-------------------------------------------------------------------------------
** Please LIKE 👍, FOLLOW ✅, SHARE 🙌 and COMMENT ✍ if you enjoy this idea! Also share your ideas and charts in the comments section below! This is best way to keep it relevant, support us, keep the content here free and allow the idea to reach as many people as possible. **
-------------------------------------------------------------------------------
💸💸💸💸💸💸
👇 👇 👇 👇 👇 👇

XRP/USDT Local trend. Pivot zone. 1 09 2023Logarithm. Time frame 1 day. Local trend.
Logic of work and risk management shown and described on the chart. Also, percentages to the key local support/resistance levels.
This is how the direction of the local trend looks on a line chart without “market noise”.
Secondary trend (part)
This channel is in a secondary trend (part) to understand the local area, see here:
XRP Local Trend. Channel 394 days. Pivot zones.
Main trend. Time Frame 1 week.
XRP/USD Major trend (part) Triangle
Price has been moving (70% channel) for almost a year now along the dynamic support of a huge triangle rib after breaking the local downtrend (go to the idea above and press play to see and understand the gist).
The percentage range within the triangle is substantial. Also understand the % of profit this triangle has formed since the super pumping of 2016-2017.
If you follow risk management, understand the point, this should be of little concern to you. "Take it while it lasts". Where do you think the big triangle will eventually run? I know (a high probability), do you??? You don't need to know and understand this for local trading. You took profit and left, and what will happen next should not interest you at all...
Sometimes history tends to repeat itself, but if many people believe in this repetitiveness and shout about it from all corners—expect trouble.
All trading history that few people see. Exchanges where XRP was traded earlier in the majority - removed. On the new top exchanges where the cryptocurrency was listed later, it is understandably absent. If you understand the essence, then you are armed with the logic of the correct action in the future.
XRP/USD Main trend
Plan, understanding of risks, attentiveness and calmness in labor make money in the market, everything else is useless noise.
Even if everything is shown as it is, this useless noise drowns out reason, attentiveness, adequate understanding of simple things. People concentrate their attention resource on useless news, spend time on meaningless discussions, i.e. entertain themselves by engaging in a kind of semblance of "intellectual activity"....

Bitcoin BTCUSD Bullish Money Heist PlanMy Dear Robbers / Traders,
This is our master plan to Heist BTCUSD Market based on Thief Trading style Technical Analysis.. kindly please follow the plan I have mentioned in the chart focus on Long entry. Our target is Red Zone that is High risk Dangerous level market is overbought / Consolidation / Trend Reversal at the level Bearish Robbers / Traders gain the strength. Be safe and be careful and Be rich.
Note: If you've got a lot of money you can get out right away otherwise you can join with a swing trade robbers and continue the heist plan,
Loot and escape on the target 🎯 Swing Traders Plz Book the partial sum of money and wait for next breakout of dynamic level / Order block, Once it is cleared we can continue our heist plan to next new target.
support our robbery plan we can easily make money & take money 💰💵 Join your hands with US. Loot Everything in this market everyday

BITCOIN Are you going to be able to handle this rally???Bitcoin (BTCUSD) is consolidating on the exact symmetrical spot it did relative to the previous Cycles. The blue circle marks that position historically and is that consolidation that always preceded the Bull Cycle's most aggressive part: the Parabolic Rally.
The Cycle bottom-to-bottom time range is fairly consistent to 1400 days and has been the bottom-to-top of the last two to 1064 days. Having broken above the cyclical Lower Highs (blue trend-line) on February, BTC historically posts only Higher Highs from here. The top can be anywhere within the $150k - $300k range for this Cycle, but as this chart shows, the important thing is to time it as closely as possible.
But what do you think? Is Bitcoin about to experience the start of the new Parabolic Rally? Feel free to let us know in the comments section below!
-------------------------------------------------------------------------------
** Please LIKE 👍, FOLLOW ✅, SHARE 🙌 and COMMENT ✍ if you enjoy this idea! Also share your ideas and charts in the comments section below! This is best way to keep it relevant, support us, keep the content here free and allow the idea to reach as many people as possible. **
-------------------------------------------------------------------------------
💸💸💸💸💸💸
👇 👇 👇 👇 👇 👇

TRX - The Outlier - Time For A Mega Short?Ah, Tronix. Yes, it's actually called "Tronix", not "Tron." The coin with the disappearing wallet. No joke, I made a wallet back in early 2019 for TRX and stored the private key. I like to do things the old fashioned way, so I wrote it down and double-checked it by logging in. The second time Iogged in, I got the notification, "this wallet doesn't exist." Since then, I've been pretty wary of this project. I could go into all sorts of conspiracy theories about Justin Sun, CZ, Binance, stablecoins......but I'll leave that to your imagination.
This is a purely technical setup. TRX is one of the few coins that has maintained higher support levels during this bloodbath. What's up with that? As far as I understand, TRX is burned to help keep the Tron stablecoin USDD pegged to the dollar. USDT recently moved away from the Tron network. Anomalies like this don't usually last long in the crypto market. I'm speculating that this breaks down massively. There's already buzz that TRX will be the next LUNA, but before I say it's going to zero, let's just look at horizontal supports. If TRX cannot hold the 200 MA on the 3 day (teal), and if it cannot hold that orange uptrend, I think it can fall 50% pretty quickly, much like other alts during this period.
On the bullish side, TRX will need to break and hold above the 200 day MA (teal in the below chart)
The 200 week MA lingers just below, at the 4 cents level. Now, the question is - does TRX test the 50 week MA near 8 cents one more time before dumping? Let's find out.
This is not meant as financial advice. This post is highly speculative, and is meant for entertainment :)
-Victor Cobra
