ETH/USDT - Ethereum: BBand Breakout◳◱ On the $ETH/ CRYPTOCAP:USDT chart, the Bband Breakout pattern suggests a consolidation phase that could precede a trend continuation or reversal. Traders might observe resistance around 3665.84 | 3877.47 | 4320.63 and support near 3222.68 | 2991.15 | 2547.99. Entering trades at 3496.6 could be strategic, aiming for the next resistance level.
◰◲ General info :
▣ Name: Ethereum
▣ Rank: 3
▣ Exchanges: Binance, Kucoin, Bybit, Huobipro, Gateio, Mexc
▣ Category/Sector: Infrastructure - Smart Contract Platforms
▣ Overview: Ethereum is a distributed blockchain computing platform for smart contracts and decentralized applications. Its native token is ether (ETH), which primarily serves as a means of payment for transaction fees and as collateral for borrowing specific ERC-20 tokens within the decentralized finance (DeFi) sector.
◰◲ Technical Metrics :
▣ Mrkt Price: 3496.6 ₮
▣ 24HVol: 832,367,434.530 ₮
▣ 24H Chng: 3.168%
▣ 7-Days Chng: -0.38%
▣ 1-Month Chng: -10.72%
▣ 3-Months Chng: 48.91%
◲◰ Pivot Points - Levels :
◥ Resistance: 3665.84 | 3877.47 | 4320.63
◢ Support: 3222.68 | 2991.15 | 2547.99
◱◳ Indicators recommendation :
▣ Oscillators: BUY
▣ Moving Averages: STRONG_BUY
◰◲ Technical Indicators Summary : BUY
◲◰ Sharpe Ratios :
▣ Last 30D: -1.84
▣ Last 90D: 2.92
▣ Last 1-Y: 1.35
▣ Last 3-Y: 0.61
◲◰ Volatility :
▣ Last 30D: 0.75
▣ Last 90D: 0.62
▣ Last 1-Y: 0.49
▣ Last 3-Y: 0.79
◳◰ Market Sentiment Index :
▣ News sentiment score is 0.83 - V. Bullish
▣ Twitter sentiment score is 0.53 - Bullish
▣ Reddit sentiment score is 0.59 - Bullish
▣ In-depth ETHUSDT technical analysis on Tradingview TA page
▣ What do you think of this analysis? Share your insights and let's discuss in the comments below. Your like, follow and support would be greatly appreciated!
◲ Disclaimer
Please note that the information and publications provided are for informational purposes only and should not be construed as financial, investment, trading, or any other type of advice or recommendation. We encourage you to conduct your own research and consult with a qualified professional before making any financial decisions. The use of the information provided is solely at your own risk.
▣ Welcome to the home of charting big: TradingView
Benefit from a ton of financial analysis features, instruments and data. Have a look around, and if you do choose to go with an upgraded plan, you'll get up to $30.
Discover it here - affiliate link -
Cryptocurrencies

AAVE/USDT - Aave: SuperTrend BBand Breakout◳◱ On the $AAVE/ CRYPTOCAP:USDT chart, the Supertrend Bband Breakout pattern suggests a consolidation phase that could precede a trend continuation or reversal. Traders might observe resistance around 133.28 | 143.73 | 166.13 and support near 110.88 | 98.93 | 76.53. Entering trades at 124.43 could be strategic, aiming for the next resistance level.
◰◲ General info :
▣ Name: Aave
▣ Rank: 73
▣ Exchanges: Binance, Kucoin, Bybit, Huobipro, Gateio, Mexc
▣ Category/Sector: Financial - Lending
▣ Overview: Aave is an open-source and non-custodial protocol to earn interest on deposits and borrow assets with a variable or stable interest rate. It also enables ultra-short duration, uncollateralized flash loans designed to be integrated into other products and services.
◰◲ Technical Metrics :
▣ Mrkt Price: 124.43 ₮
▣ 24HVol: 9,142,592.597 ₮
▣ 24H Chng: 2.784%
▣ 7-Days Chng: -3.82%
▣ 1-Month Chng: -5.39%
▣ 3-Months Chng: 29.03%
◲◰ Pivot Points - Levels :
◥ Resistance: 133.28 | 143.73 | 166.13
◢ Support: 110.88 | 98.93 | 76.53
◱◳ Indicators recommendation :
▣ Oscillators: NEUTRAL
▣ Moving Averages: STRONG_BUY
◰◲ Technical Indicators Summary : BUY
◲◰ Sharpe Ratios :
▣ Last 30D: -0.90
▣ Last 90D: 1.47
▣ Last 1-Y: 0.84
▣ Last 3-Y: 0.20
◲◰ Volatility :
▣ Last 30D: 0.94
▣ Last 90D: 0.85
▣ Last 1-Y: 0.77
▣ Last 3-Y: 1.10
◳◰ Market Sentiment Index :
▣ News sentiment score is N/A
▣ Twitter sentiment score is 0.62 - Bullish
▣ Reddit sentiment score is 0.43 - Bearish
▣ In-depth AAVEUSDT technical analysis on Tradingview TA page
▣ What do you think of this analysis? Share your insights and let's discuss in the comments below. Your like, follow and support would be greatly appreciated!
◲ Disclaimer
Please note that the information and publications provided are for informational purposes only and should not be construed as financial, investment, trading, or any other type of advice or recommendation. We encourage you to conduct your own research and consult with a qualified professional before making any financial decisions. The use of the information provided is solely at your own risk.
▣ Welcome to the home of charting big: TradingView
Benefit from a ton of financial analysis features, instruments and data. Have a look around, and if you do choose to go with an upgraded plan, you'll get up to $30.
Discover it here - affiliate link -

DENT/USDT - Dent: Super Trend◳◱ On the $DENT/ CRYPTOCAP:USDT chart, the Super Trend pattern suggests indications that the trend may be gaining or losing strength. Traders might observe resistance around 0.001984 | 0.002126 | 0.002449 and support near 0.001661 | 0.00148 | 0.001157. Entering trades at 0.001895 could be strategic, aiming for the next resistance level.
◰◲ General info :
▣ Name: Dent
▣ Rank: 340
▣ Exchanges: Binance, Kucoin, Bybit, Gateio, Hitbtc
▣ Category/Sector: Services - Data Management
▣ Overview: None
◰◲ Technical Metrics :
▣ Mrkt Price: 0.001895 ₮
▣ 24HVol: 2,652,358.949 ₮
▣ 24H Chng: 5.866%
▣ 7-Days Chng: 3.03%
▣ 1-Month Chng: -13.69%
▣ 3-Months Chng: 80.67%
◲◰ Pivot Points - Levels :
◥ Resistance: 0.001984 | 0.002126 | 0.002449
◢ Support: 0.001661 | 0.00148 | 0.001157
◱◳ Indicators recommendation :
▣ Oscillators: BUY
▣ Moving Averages: STRONG_BUY
◰◲ Technical Indicators Summary : BUY
◲◰ Sharpe Ratios :
▣ Last 30D: -1.71
▣ Last 90D: 2.53
▣ Last 1-Y: 0.92
▣ Last 3-Y: -0.02
◲◰ Volatility :
▣ Last 30D: 1.04
▣ Last 90D: 1.03
▣ Last 1-Y: 0.77
▣ Last 3-Y: 1.18
◳◰ Market Sentiment Index :
▣ News sentiment score is N/A
▣ Twitter sentiment score is 0.57 - Bullish
▣ Reddit sentiment score is 0.30 - Bearish
▣ In-depth DENTUSDT technical analysis on Tradingview TA page
▣ What do you think of this analysis? Share your insights and let's discuss in the comments below. Your like, follow and support would be greatly appreciated!
◲ Disclaimer
Please note that the information and publications provided are for informational purposes only and should not be construed as financial, investment, trading, or any other type of advice or recommendation. We encourage you to conduct your own research and consult with a qualified professional before making any financial decisions. The use of the information provided is solely at your own risk.
▣ Welcome to the home of charting big: TradingView
Benefit from a ton of financial analysis features, instruments and data. Have a look around, and if you do choose to go with an upgraded plan, you'll get up to $30.
Discover it here - affiliate link -

OP/USDT - Optimism: TrendLine Touch◳◱ On the $OP/ CRYPTOCAP:USDT chart, the Trendline Touch pattern suggests momentum building up for a significant move. Traders might observe resistance around 3.643 | 4.089 | 4.933 and support near 2.799 | 2.401 | 1.557. Entering trades at 3.198 could be strategic, aiming for the next resistance level.
◰◲ General info :
▣ Name: Optimism
▣ Rank: 49
▣ Exchanges: Binance, Kucoin, Bybit, Huobipro, Gateio, Mexc
▣ Category/Sector: Infrastructure - Scaling
▣ Overview: None
◰◲ Technical Metrics :
▣ Mrkt Price: 3.198 ₮
▣ 24HVol: 48,690,901.124 ₮
▣ 24H Chng: 5.579%
▣ 7-Days Chng: -8.90%
▣ 1-Month Chng: -32.28%
▣ 3-Months Chng: -12.47%
◲◰ Pivot Points - Levels :
◥ Resistance: 3.643 | 4.089 | 4.933
◢ Support: 2.799 | 2.401 | 1.557
◱◳ Indicators recommendation :
▣ Oscillators: BUY
▣ Moving Averages: BUY
◰◲ Technical Indicators Summary : BUY
◲◰ Sharpe Ratios :
▣ Last 30D: -5.26
▣ Last 90D: 0.22
▣ Last 1-Y: 0.73
▣ Last 3-Y: 0.73
◲◰ Volatility :
▣ Last 30D: 0.87
▣ Last 90D: 0.88
▣ Last 1-Y: 0.97
▣ Last 3-Y: 1.35
◳◰ Market Sentiment Index :
▣ News sentiment score is N/A
▣ Twitter sentiment score is N/A
▣ Reddit sentiment score is 0.68 - Bullish
▣ In-depth OPUSDT technical analysis on Tradingview TA page
▣ What do you think of this analysis? Share your insights and let's discuss in the comments below. Your like, follow and support would be greatly appreciated!
◲ Disclaimer
Please note that the information and publications provided are for informational purposes only and should not be construed as financial, investment, trading, or any other type of advice or recommendation. We encourage you to conduct your own research and consult with a qualified professional before making any financial decisions. The use of the information provided is solely at your own risk.
▣ Welcome to the home of charting big: TradingView
Benefit from a ton of financial analysis features, instruments and data. Have a look around, and if you do choose to go with an upgraded plan, you'll get up to $30.
Discover it here - affiliate link -

BITCOIN About to break the 3-week Triangle! How to trade it?Bitcoin (BTCUSD) has been trading within a (dashed) Triangle pattern since the March 14 High, supported twice by the 1D MA50 (blue trend-line). The price is testing today the top of that pattern and going back to November 2022 at the bottom of the Bear Cycle when the Fibonacci Channel Up begun, we can see that a similar pattern emerged two more times.
The first (January - March 2023), the Triangle broke downwards, hit the 1D MA100 (green trend-line) and then rose aggressively towards the 1.786 Fib extension. The second Triangle (December 2023 - January 2024) broke to the upside but then got rejected at the top of the (blue) Channel Up (Channel Fib 1.0) and pulled-back to the 1D MA100 before rising even more aggressively towards the 4.5 Fib ext. The common fact is that on both cases, the price touched the 1D MA100 eventually before rebounding.
At the moment though, BTC is above the former (blue) Channel Up and is transitioned into a Fibonacci dynamic pattern. As a result, there is no obvious Resistance right above besides the 2.0 Channel Fib extension. A bullish break-out this time may not necessarily require a 1D MA100 test before a more aggressive rise. Since however the new Halving event is expected in a week and a supply shock may initially cause a decline upon news that might already priced in, traders are advised to keep some 'dry powder' for a final test of the 1D MA100.
We have two targets for the medium-term: Target 1 at 85500 (marginally below the 1.786 Fib ext) and Target 2 at 120000 (marginally below the 4.5 Fib ext).
The signal to buy with more confidence on the 1D MA100 would be if you see the 1D RSI hitting the green cup pattern again as it happened on the previous price Triangle cases, which as you can see, have been fairly similar, getting overbought (above 70.00) prior to the Triangle and then deflating as the Triangle formed.
Feel free to let us know in the comments section below!
-------------------------------------------------------------------------------
** Please LIKE 👍, FOLLOW ✅, SHARE 🙌 and COMMENT ✍ if you enjoy this idea! Also share your ideas and charts in the comments section below! This is best way to keep it relevant, support us, keep the content here free and allow the idea to reach as many people as possible. **
-------------------------------------------------------------------------------
💸💸💸💸💸💸
👇 👇 👇 👇 👇 👇

EGLD/USDT - MultiversX: TD Sequential◳◱ On the $EGLD/ CRYPTOCAP:USDT chart, the Td Sequential pattern suggests a pause in volatility, potentially gearing up for a breakout. Traders might observe resistance around 59.32 | 64.45 | 73.55 and support near 50.22 | 46.25 | 37.15. Entering trades at 54.52 could be strategic, aiming for the next resistance level.
◰◲ General info :
▣ Name: MultiversX
▣ Rank: 85
▣ Exchanges: Binance, Kucoin, Bybit, Huobipro, Gateio, Mexc
▣ Category/Sector: Infrastructure - Smart Contract Platforms
▣ Overview: Elrond is a blockchain designed for high throughput and relatively fast execution speed compared to other smart contract platforms. It features Adaptive State Sharding as its scaling solution and a Proof-of-Stake (PoS) variation called Secure PoS to secure the network. Elrond also contains a WebAssembly-based virtual machine that can support the creation and execution of decentralized applications (dApps).
◰◲ Technical Metrics :
▣ Mrkt Price: 54.52 ₮
▣ 24HVol: 5,768,981.334 ₮
▣ 24H Chng: 0.055%
▣ 7-Days Chng: -5.44%
▣ 1-Month Chng: -20.46%
▣ 3-Months Chng: 2.87%
◲◰ Pivot Points - Levels :
◥ Resistance: 59.32 | 64.45 | 73.55
◢ Support: 50.22 | 46.25 | 37.15
◱◳ Indicators recommendation :
▣ Oscillators: BUY
▣ Moving Averages: NEUTRAL
◰◲ Technical Indicators Summary : NEUTRAL
◲◰ Sharpe Ratios :
▣ Last 30D: -2.74
▣ Last 90D: 0.47
▣ Last 1-Y: 0.55
▣ Last 3-Y: 0.05
◲◰ Volatility :
▣ Last 30D: 0.83
▣ Last 90D: 0.77
▣ Last 1-Y: 0.80
▣ Last 3-Y: 1.00
◳◰ Market Sentiment Index :
▣ News sentiment score is N/A
▣ Twitter sentiment score is 0.54 - Bullish
▣ Reddit sentiment score is 0.90 - V. Bullish
▣ In-depth EGLDUSDT technical analysis on Tradingview TA page
▣ What do you think of this analysis? Share your insights and let's discuss in the comments below. Your like, follow and support would be greatly appreciated!
◲ Disclaimer
Please note that the information and publications provided are for informational purposes only and should not be construed as financial, investment, trading, or any other type of advice or recommendation. We encourage you to conduct your own research and consult with a qualified professional before making any financial decisions. The use of the information provided is solely at your own risk.
▣ Welcome to the home of charting big: TradingView
Benefit from a ton of financial analysis features, instruments and data. Have a look around, and if you do choose to go with an upgraded plan, you'll get up to $30.
Discover it here - affiliate link -

BAL/USDT - Balancer: Trend Reversal◳◱ On the $BAL/ CRYPTOCAP:USDT chart, the Trend Reversal pattern suggests indications that the trend may be gaining or losing strength. Traders might observe resistance around 5.208 | 5.618 | 6.405 and support near 4.421 | 4.044 | 3.257. Entering trades at 4.851 could be strategic, aiming for the next resistance level.
◰◲ General info :
▣ Name: Balancer
▣ Rank: 280
▣ Exchanges: Binance, Kucoin, Bybit, Huobipro, Gateio, Mexc
▣ Category/Sector: Financial - Decentralized Exchanges
▣ Overview: Balancer is a non-custodial automated portfolio manager, liquidity provider, and price sensor. The big idea of Balancer is, it is a new financial primitive that combines asset management and decentralized exchange. In traditional finance, this is similar to combining Fidelity asset management and NASDAQ’s exchange, then distribute NASDAQ’s trading profits to Fidelity’s asset holders.
◰◲ Technical Metrics :
▣ Mrkt Price: 4.851 ₮
▣ 24HVol: 1,282,328.325 ₮
▣ 24H Chng: 2.126%
▣ 7-Days Chng: -3.59%
▣ 1-Month Chng: -15.99%
▣ 3-Months Chng: 25.93%
◲◰ Pivot Points - Levels :
◥ Resistance: 5.208 | 5.618 | 6.405
◢ Support: 4.421 | 4.044 | 3.257
◱◳ Indicators recommendation :
▣ Oscillators: BUY
▣ Moving Averages: BUY
◰◲ Technical Indicators Summary : BUY
◲◰ Sharpe Ratios :
▣ Last 30D: -2.66
▣ Last 90D: 1.56
▣ Last 1-Y: -0.70
▣ Last 3-Y: -0.40
◲◰ Volatility :
▣ Last 30D: 0.82
▣ Last 90D: 0.71
▣ Last 1-Y: 0.61
▣ Last 3-Y: 0.98
◳◰ Market Sentiment Index :
▣ News sentiment score is N/A
▣ Twitter sentiment score is 0.38 - Bearish
▣ Reddit sentiment score is 0.47 - Bearish
▣ In-depth BALUSDT technical analysis on Tradingview TA page
▣ What do you think of this analysis? Share your insights and let's discuss in the comments below. Your like, follow and support would be greatly appreciated!
◲ Disclaimer
Please note that the information and publications provided are for informational purposes only and should not be construed as financial, investment, trading, or any other type of advice or recommendation. We encourage you to conduct your own research and consult with a qualified professional before making any financial decisions. The use of the information provided is solely at your own risk.
▣ Welcome to the home of charting big: TradingView
Benefit from a ton of financial analysis features, instruments and data. Have a look around, and if you do choose to go with an upgraded plan, you'll get up to $30.
Discover it here - affiliate link -

WOO/USDT - WOO Network: Trend Reversal◳◱ On the $WOO/ CRYPTOCAP:USDT chart, the Trend Reversal pattern suggests a pause in volatility, potentially gearing up for a breakout. Traders might observe resistance around 0.5036 | 0.571 | 0.6951 and support near 0.3795 | 0.3228 | 0.1987. Entering trades at 0.4386 could be strategic, aiming for the next resistance level.
◰◲ General info :
▣ Name: WOO Network
▣ Rank: 134
▣ Exchanges: Binance, Kucoin, Bybit, Huobipro, Gateio, Mexc
▣ Category/Sector: Financial - Centralized Exchanges
▣ Overview: WOO Network is a company that offers both centralized and decentralized services. Its main product is WOO X, a zero fee crypto trading platform that also serves as a liquidity aggregator for digital assets. WOOFi is the DeFi arm of WOO Network and assists decentralized exchanges by providing liquidities on chain. WOO Network ambitions to become a major player in CeDefi (bridge between centralized and decentralized finance).
◰◲ Technical Metrics :
▣ Mrkt Price: 0.4386 ₮
▣ 24HVol: 4,371,365.915 ₮
▣ 24H Chng: 2.741%
▣ 7-Days Chng: -13.07%
▣ 1-Month Chng: -24.06%
▣ 3-Months Chng: 8.73%
◲◰ Pivot Points - Levels :
◥ Resistance: 0.5036 | 0.571 | 0.6951
◢ Support: 0.3795 | 0.3228 | 0.1987
◱◳ Indicators recommendation :
▣ Oscillators: BUY
▣ Moving Averages: BUY
◰◲ Technical Indicators Summary : BUY
◲◰ Sharpe Ratios :
▣ Last 30D: -3.17
▣ Last 90D: 0.89
▣ Last 1-Y: 1.10
▣ Last 3-Y: 0.54
◲◰ Volatility :
▣ Last 30D: 1.12
▣ Last 90D: 1.15
▣ Last 1-Y: 1.06
▣ Last 3-Y: 1.40
◳◰ Market Sentiment Index :
▣ News sentiment score is N/A
▣ Twitter sentiment score is N/A
▣ Reddit sentiment score is 0.91 - V. Bullish
▣ In-depth WOOUSDT technical analysis on Tradingview TA page
▣ What do you think of this analysis? Share your insights and let's discuss in the comments below. Your like, follow and support would be greatly appreciated!
◲ Disclaimer
Please note that the information and publications provided are for informational purposes only and should not be construed as financial, investment, trading, or any other type of advice or recommendation. We encourage you to conduct your own research and consult with a qualified professional before making any financial decisions. The use of the information provided is solely at your own risk.
▣ Welcome to the home of charting big: TradingView
Benefit from a ton of financial analysis features, instruments and data. Have a look around, and if you do choose to go with an upgraded plan, you'll get up to $30.
Discover it here - affiliate link -

UNI/USDT - Uniswap: Trend Reversal◳◱ On the $UNI/ CRYPTOCAP:USDT chart, the Trend Reversal pattern suggests indications that the trend may be gaining or losing strength. Traders might observe resistance around 12.758 | 14.116 | 16.637 and support near 10.237 | 9.074 | 6.553. Entering trades at 11.517 could be strategic, aiming for the next resistance level.
◰◲ General info :
▣ Name: Uniswap
▣ Rank: 23
▣ Exchanges: Binance, Kucoin, Bybit, Huobipro, Gateio, Mexc
▣ Category/Sector: Financial - Decentralized Exchanges
▣ Overview: Uniswap is a decentralized exchange built on Ethereum that utilizes an automated market making system rather than a traditional order-book. Instead of matching individual buy and sell orders, users can pool together two assets that are then traded against, with the price determined based on the ratio between the two.
◰◲ Technical Metrics :
▣ Mrkt Price: 11.517 ₮
▣ 24HVol: 15,682,647.271 ₮
▣ 24H Chng: 2.183%
▣ 7-Days Chng: -7.20%
▣ 1-Month Chng: -18.85%
▣ 3-Months Chng: 91.69%
◲◰ Pivot Points - Levels :
◥ Resistance: 12.758 | 14.116 | 16.637
◢ Support: 10.237 | 9.074 | 6.553
◱◳ Indicators recommendation :
▣ Oscillators: BUY
▣ Moving Averages: BUY
◰◲ Technical Indicators Summary : BUY
◲◰ Sharpe Ratios :
▣ Last 30D: -3.46
▣ Last 90D: 2.39
▣ Last 1-Y: 1.03
▣ Last 3-Y: 0.21
◲◰ Volatility :
▣ Last 30D: 0.85
▣ Last 90D: 1.35
▣ Last 1-Y: 0.91
▣ Last 3-Y: 1.08
◳◰ Market Sentiment Index :
▣ News sentiment score is N/A
▣ Twitter sentiment score is 0.59 - Bullish
▣ Reddit sentiment score is 0.77 - V. Bullish
▣ In-depth UNIUSDT technical analysis on Tradingview TA page
▣ What do you think of this analysis? Share your insights and let's discuss in the comments below. Your like, follow and support would be greatly appreciated!
◲ Disclaimer
Please note that the information and publications provided are for informational purposes only and should not be construed as financial, investment, trading, or any other type of advice or recommendation. We encourage you to conduct your own research and consult with a qualified professional before making any financial decisions. The use of the information provided is solely at your own risk.
▣ Welcome to the home of charting big: TradingView
Benefit from a ton of financial analysis features, instruments and data. Have a look around, and if you do choose to go with an upgraded plan, you'll get up to $30.
Discover it here - affiliate link -

TIA/USDT - TIA: TD Sequential◳◱ On the $TIA/ CRYPTOCAP:USDT chart, the Td Sequential pattern suggests a pause in volatility, potentially gearing up for a breakout. Traders might observe resistance around 14.02 | 15.82 | 18.95 and support near 10.89 | 9.56 | 6.43. Entering trades at 12.31 could be strategic, aiming for the next resistance level.
◰◲ General info :
▣ Name: TIA
▣ Rank: 1790
▣ Exchanges: Binance, Kucoin, Bybit, Huobipro, Gateio, Mexc
▣ Category/Sector: N/A
▣ Overview: TIA project overview is currently unavailable. I'll try to update this in the upcoming analysis.
◰◲ Technical Metrics :
▣ Mrkt Price: 12.31 ₮
▣ 24HVol: 17,948,574.554 ₮
▣ 24H Chng: 1.067%
▣ 7-Days Chng: -11.64%
▣ 1-Month Chng: 181.80%
▣ 3-Months Chng: 120.37%
◲◰ Pivot Points - Levels :
◥ Resistance: 14.02 | 15.82 | 18.95
◢ Support: 10.89 | 9.56 | 6.43
◱◳ Indicators recommendation :
▣ Oscillators: BUY
▣ Moving Averages: BUY
◰◲ Technical Indicators Summary : BUY
◲◰ Sharpe Ratios :
▣ Last 30D: N/A
▣ Last 90D: N/A
▣ Last 1-Y: N/A
▣ Last 3-Y: N/A
◲◰ Volatility :
▣ Last 30D: N/A
▣ Last 90D: N/A
▣ Last 1-Y: N/A
▣ Last 3-Y: N/A
◳◰ Market Sentiment Index :
▣ News sentiment score is N/A
▣ Twitter sentiment score is N/A
▣ Reddit sentiment score is N/A
▣ In-depth TIAUSDT technical analysis on Tradingview TA page
▣ What do you think of this analysis? Share your insights and let's discuss in the comments below. Your like, follow and support would be greatly appreciated!
◲ Disclaimer
Please note that the information and publications provided are for informational purposes only and should not be construed as financial, investment, trading, or any other type of advice or recommendation. We encourage you to conduct your own research and consult with a qualified professional before making any financial decisions. The use of the information provided is solely at your own risk.
▣ Welcome to the home of charting big: TradingView
Benefit from a ton of financial analysis features, instruments and data. Have a look around, and if you do choose to go with an upgraded plan, you'll get up to $30.
Discover it here - affiliate link -

OM/USDT - MANTRA DAO: BBand Breakout◳◱ On the $OM/ CRYPTOCAP:USDT chart, the Bband Breakout pattern suggests an upcoming trend shift. Traders might observe resistance around 0.78787 | 0.84973 | 1.01416 and support near 0.62344 | 0.52087 | 0.35644. Entering trades at 0.82171 could be strategic, aiming for the next resistance level.
◰◲ General info :
▣ Name: MANTRA DAO
▣ Rank: 152
▣ Exchanges: Binance, Kucoin, Bybit, Gateio, Hitbtc
▣ Category/Sector: Financial - Lending
▣ Overview: None
◰◲ Technical Metrics :
▣ Mrkt Price: 0.82171 ₮
▣ 24HVol: 47,110,666.812 ₮
▣ 24H Chng: 19.884%
▣ 7-Days Chng: 22.15%
▣ 1-Month Chng: 167.86%
▣ 3-Months Chng: 1087.69%
◲◰ Pivot Points - Levels :
◥ Resistance: 0.78787 | 0.84973 | 1.01416
◢ Support: 0.62344 | 0.52087 | 0.35644
◱◳ Indicators recommendation :
▣ Oscillators: NEUTRAL
▣ Moving Averages: STRONG_BUY
◰◲ Technical Indicators Summary : STRONG_BUY
◲◰ Sharpe Ratios :
▣ Last 30D: 5.50
▣ Last 90D: 5.55
▣ Last 1-Y: 2.76
▣ Last 3-Y: 0.81
◲◰ Volatility :
▣ Last 30D: 2.21
▣ Last 90D: 2.18
▣ Last 1-Y: 1.37
▣ Last 3-Y: 1.44
◳◰ Market Sentiment Index :
▣ News sentiment score is N/A
▣ Twitter sentiment score is 0.65 - Bullish
▣ Reddit sentiment score is N/A
▣ In-depth OMUSDT technical analysis on Tradingview TA page
▣ What do you think of this analysis? Share your insights and let's discuss in the comments below. Your like, follow and support would be greatly appreciated!
◲ Disclaimer
Please note that the information and publications provided are for informational purposes only and should not be construed as financial, investment, trading, or any other type of advice or recommendation. We encourage you to conduct your own research and consult with a qualified professional before making any financial decisions. The use of the information provided is solely at your own risk.
▣ Welcome to the home of charting big: TradingView
Benefit from a ton of financial analysis features, instruments and data. Have a look around, and if you do choose to go with an upgraded plan, you'll get up to $30.
Discover it here - affiliate link -

Triangle-like pattern forming on the 4-hour chartBitcoin continues to form a triangle-like pattern on the 4-hour chart. Its price is currently testing the upper bound of this pattern, and a breakout to the upside would be bullish in the short term. Nevertheless, whether Bitcoin will gather enough momentum to be propelled substantially higher from the current level remains to be seen.
Illustration 1.01
Despite moving averages flattening in the past three weeks, Bitcoin has not tested the critical support at the 50-day SMA.
Technical analysis gauge
Daily time frame = Neutral (no trend)
Weekly time frame = Bullish
*The gauge does not necessarily indicate where the market will head. Instead, it reflects the constellation of multiple indicators.
Please feel free to express your ideas and thoughts in the comment section.
DISCLAIMER: This analysis is not intended to encourage any buying or selling of any particular securities. Furthermore, it should not serve as a basis for taking any trade action by an individual investor or any other entity. Your own due diligence is highly advised before entering a trade.

BITCOIN still has at least 500 days of Bull Cycle ahead !!!Back in February 2020 we published one of our most popular ideas, the 'Golden 51%-49% Ratio':
And in December 2022 exactly on the last Bear Cycle's bottom, we updated it issuing a mega buy signal for long-term traders and investors:
As you can see, this couldn't have been more accurate and today, as we are only 2 weeks before Bitcoin's 4th historic Halving, we are giving you an update with a few extra elements!
** Cycles and LGC **
The Bear Cycles are displayed by the red Rectangles and the Bull Cycle by the green. What's noticeable here is that BTC only recently got out of its Logarithmic Growth Curve (LGC), which is unusual before a Halving event. Being that close to the range that is basically Bitcoin's historic Buy Zone, indicates its huge potential moving forward in this new Bull Cycle.
** The Golden Ratio **
However the highlight of this analysis remains the Halving's Golden Ratio, which implies that the time distance from the Bear Cycle's bottom to the Halving is almost equivalent to the distance from the Halving to the Bull Cycle's top. It has held beautifully on the 3 previous Cycles and there is no reason not to expect it to unfold this time also.
** 500 more days of Bull **
This indicates that we have at least another 500 days of Bull Cycle ahead of us and the best part is that those will be in the form of the most aggressive part of the Cycle, the Post-Halving Parabolic Rally (green Megaphone)!
But what do you think? Do you expect the 51%-49% Golden Ratio to hold again? If yes, at what price do you expect Bitcoin to peak? Feel free to let us know in the comments section below!
-------------------------------------------------------------------------------
** Please LIKE 👍, FOLLOW ✅, SHARE 🙌 and COMMENT ✍ if you enjoy this idea! Also share your ideas and charts in the comments section below! This is best way to keep it relevant, support us, keep the content here free and allow the idea to reach as many people as possible. **
-------------------------------------------------------------------------------
💸💸💸💸💸💸
👇 👇 👇 👇 👇 👇

Bullish trend is breaking down at a fast paceBitcoin has been experiencing significant volatility over the past two weeks, with its price oscillating around the $70,000 price tag. This pattern of sideways-moving price action starkly contrasts with the robust and consistent upward trajectory observed in the months leading up to Bitcoin’s recent all-time highs. In the previous update on Bitcoin, we outlined how RSI, MACD, and Stochastic all turned to the downside on the daily chart. Since then, these indicators have failed to reverse toward the upside, and the ADX has continued to decline, suggesting the bullish trend is losing momentum at a fast pace. In conclusion, all of these developments are worrisome and require investors’ attention.
In regard to Bitcoin addresses with balances exceeding 1,000 BTC, they have been rising since around 11th March 2024 (but the rise has slowed down in the past two weeks). Nevertheless, they are still way below the peak established in late February 2024, indicating large speculators may not have much appetite for Bitcoin at current prices. The rise in the number of Bitcoin addresses with balances exceeding 100 BTC has also slowed down recently. As such, a drop in these figures could foreshadow a substantial move to the downside for Bitcoin. Therefore, we will keep paying close attention to these metrics.
Illustration 1.01
The image above shows the daily graph of BTCUSD. The red arrow illustrates declining volume accompanying rising price, a questionable development.
Illustration 1.02
Illustration 1.02 shows the daily chart of BTCUSD. The yellow arrow indicates a bearish breakout below the ascending trendline. The setup we introduced in the previous idea, with the short position entry getting triggered by a breakout below the trendline and stop-loss above it, remains valid (targeting $63,000).
Technical analysis gauge
Daily time frame = Bearish
Weekly time frame = Bullish
*The gauge does not necessarily indicate where the market will head. Instead, it reflects the constellation of multiple indicators.
Please feel free to express your ideas and thoughts in the comment section.
DISCLAIMER: This analysis is not intended to encourage any buying or selling of any particular securities. Furthermore, it should not serve as a basis for taking any trade action by an individual investor or any other entity. Your own due diligence is highly advised before entering a trade.

MPCUSDT Don't miss this Cup & Handle BUY opportunity!The MPCUSDT, Partisia Blockchain's token, has started to make a bullish reversal as it held its 4H MA50 (blue trend-line) as Support and started today its strongest 1 day rally since its first trading day.
The pattern that appears to have prevailed is a Cup & Handle (C&H), which technically leads massive bullish reversals on market bottoms. Even though 4H is a rather short-term time-frame, we can expect a similar behaviour. Our Targets remain 0.5750 and 0.6900, exactly on the Resistance 2 and 3 levels respectively. Technically it can even go as high as the 3.0 Fibonacci extension, before the next short-term pull-back.
Overall we are very bullish on MPC, a great token on a project with very promising potential. It is worth being a long-term holder as the fundamentals are one of the most solid we have seen on caps of this size.
-------------------------------------------------------------------------------
** Please LIKE 👍, FOLLOW ✅, SHARE 🙌 and COMMENT ✍ if you enjoy this idea! Also share your ideas and charts in the comments section below! This is best way to keep it relevant, support us, keep the content here free and allow the idea to reach as many people as possible. **
-------------------------------------------------------------------------------
💸💸💸💸💸💸
👇 👇 👇 👇 👇 👇

ETCUSD new rally starting towards $50.Ethereum Classic (ETCUSD) has started to rise again, so far being on the 2nd straight green 1D candle, without breaking the key 1D MA100 (green trend-line), which has been supporting since essentially the October 23 2023 break-out.
As long as this holds and ETC keeps closing the 1D candles above the 1D MA100, we expect a new cyclical rally to start within the Fibonacci Channel Up. The last one was +83.17% from its Higher Low, so a repeat would give us $49.00 by May.
-------------------------------------------------------------------------------
** Please LIKE 👍, FOLLOW ✅, SHARE 🙌 and COMMENT ✍ if you enjoy this idea! Also share your ideas and charts in the comments section below! This is best way to keep it relevant, support us, keep the content here free and allow the idea to reach as many people as possible. **
-------------------------------------------------------------------------------
💸💸💸💸💸💸
👇 👇 👇 👇 👇 👇

BITCOIN Will we see 60k before 100k?Yesterday we discussed from a 4H perspective (see chart below) why it would be technically possible and above all healthy for Bitcoin (BTCUSD) to pull-back to the 1D MA50 and then rebound:
Today we approach this from the 1W time-frame where the results are virtually the same. As you can see, Bitcoin has pulled-back towards the 0.382 Fibonacci retracement level measured from the previous Low on both previous corrections. Even the April - June and July - September double corrections last year (2023), both didn't exceed the 0.382 Fib.
With the underlying long-term pattern for BTC being a Channel Up since the November 2022 (FTX crash) bottom, such a pull-back would be a new Higher Low. As you can see every Bullish Leg to a Higher High is slightly weaker progressively. The 1st was +104.28%, the 2nd +96.69% (-8% lower), the 3rd +92.48% (-4% lower), so we may have a pattern here where every Higher High's decreasing rate is -50% lower each time. This indicates that the next Higher High may be -2% less, i.e. +90.48%.
That gives us a $110000 Higher High target but it is always safer to start taking profits (medium-term at least) around $100k. So if this model continues to repeat those systemic sequences, we are looking at the possibility of a 60-58k pull-back towards and marginally after the Halving and then new rally to $100k.
It is worth mentioning that every time such Higher Low pull-back took place within the Channel Up, the 1W MACD either made a Bearish Cross or a very tight Squeeze. We can already see the MACD reversing downwards.
So what do you think? It is more probable to see a 60k pull-back before a new rally to 100k? Feel free to let us know in the comments section below!
-------------------------------------------------------------------------------
** Please LIKE 👍, FOLLOW ✅, SHARE 🙌 and COMMENT ✍ if you enjoy this idea! Also share your ideas and charts in the comments section below! This is best way to keep it relevant, support us, keep the content here free and allow the idea to reach as many people as possible. **
-------------------------------------------------------------------------------
💸💸💸💸💸💸
👇 👇 👇 👇 👇 👇

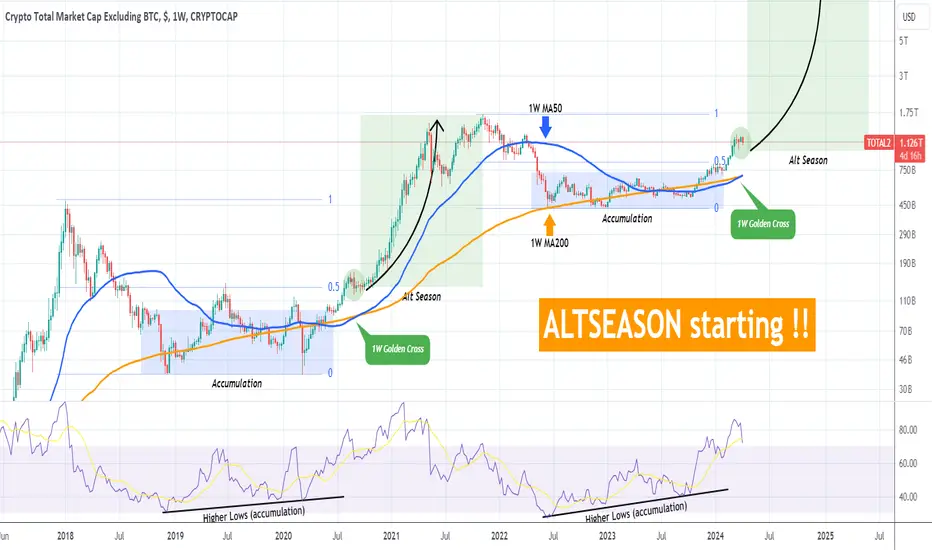
ALTS are ready to explode after this Golden Cross! DON'T MISS ITThe Crypto Total Market Cap excluding BTC (TOTAL2), which is essentially the altcoin market, just completed a Golden Cross on the 1W time-frame. That is the first such formation since September 14 2020.
As you can see, that was during the middle of the previous Bull Cycle, around the 0.5 Fibonacci retracement level and past the Accumulation Phase (blue Rectangle). The 1W Golden Cross essentially signaled the start of the Parabolic Rally (green Rectangle) 3-4 weeks later, which is the most aggressive part of the Cycle and what is otherwise known as 'Alt Season', the time when alt coins see extraordinary growth.
The similarities between the two Cycles so far are striking. The Accumulation Phase was very long and took place on 1W RSI Higher Lows, a Bullish Divergence that paved the way to the Cycle's Rally. Note that this is only the 2nd 1W Golden Cross of the market, a feat that traders and investors should not miss and take advantage of. As long as the 1W MA50 (blue trend-line) supports, the market will continue to be on the Bull Cycle and enjoy its biggest gains.
-------------------------------------------------------------------------------
** Please LIKE 👍, FOLLOW ✅, SHARE 🙌 and COMMENT ✍ if you enjoy this idea! Also share your ideas and charts in the comments section below! This is best way to keep it relevant, support us, keep the content here free and allow the idea to reach as many people as possible. **
-------------------------------------------------------------------------------
💸💸💸💸💸💸
👇 👇 👇 👇 👇 👇
BITCOIN a 1D MA50 test is quite likely before 100k.Bitcoin (BTCUSD) broke and closed below its 4H MA200 (orange trend-line) for the first time in 2 months (since February 05). Last time such a pull-back off a Higher High took place was on January 12 (orange circle), which confirmed the extension of a short-term correction that found support on the 1D MA50 (red trend-line) and rebounded.
That was a -21.41% decline from the top. On today's sequence a -21.41% repeat would again make contact (or come very close) with the 1D MA50. That could coincide with the Halving event, two weeks from now and would make for a very healthy correction. In our opinion that is the most optimal and low risk level to add more buys for the long-term 100k Target.
But what do you think? Will BTC correct to the 1D MA50 or a rebound from the current levels is more probable? Feel free to let us know in the comments section below!
-------------------------------------------------------------------------------
** Please LIKE 👍, FOLLOW ✅, SHARE 🙌 and COMMENT ✍ if you enjoy this idea! Also share your ideas and charts in the comments section below! This is best way to keep it relevant, support us, keep the content here free and allow the idea to reach as many people as possible. **
-------------------------------------------------------------------------------
💸💸💸💸💸💸
👇 👇 👇 👇 👇 👇

BTCUSD - Potential Daily Inflection PointThis probably still needs time but we're approaching an inflection point, it may take another month or two to wind up, so I'll have to watch. Bitcoin has been popping up in it's low liquidity enviroment, and the MM is likely net short due to the influx of buyers. Since the market needs sellers, it's possible MM will push price down to get some liquidity.
On the 1 hour, DXY is playing it's usual games, and bitcoin is hitting a momentum shift; looks like another short squeeze without any follow through.
As DXY pushed up, bitcoin gets hammered back down.
I made some trend lines on the keltner channel that gives me the momentum shift signals.
Here is an earlier SS from last night:
Current Daily:
So I expect the resistance on the daily and dxy to push bitcoin back down into breakdown territory.
If not then it could be a major breakout.

Btc on the Triangle train?If you find this information inspiring/helpful, please consider a boost and follow! Any questions or comments, please leave a comment!
Triangle variant,
no triangle train tunnel vision, though.
This would be ideal from here.
Looking for a W(4) here to match (2).
NGL and say this doesn't look impulsive.

Bitcoin Liquid Index Gann Square & EW CountHere I made an elliot wave count, this is a complete wave assuming the 5th wave is short like in 2013/2014.
I will look into making an alternate count that shows one more 5th wave to go before a major correction like 2014/2018... Or unlike we've seen in bitcoin history? 60k-1k???
Well no need to get too excited, time will tell which way we're going and it's too soon to say for sure.

Bitcoin Monthly Short Term target is 54k
Long Term target is 20k
Monthly is consolidating and will likely find it's way back below the 20 EMA near the bottom of the Keltner Channel.
