Bitcoin(BTC/USD) Daily Chart Analysis For Week of May 30, 2025Technical Analysis and Outlook:
Bitcoin has undergone a significant decline during the current week's trading session and is presently situated at the Mean Support level of $103,000. This downward trajectory has the potential to establish a temporary pause, which may facilitate the emergence of upward momentum from this level, and it could pose a challenge to the Key Resistance level at 109500. A successful breach of this resistance may lead to the completion of the Inner Coin Rally target at $114500. However, it is crucial to acknowledge the possibility of renewed downward momentum from the current level, as this could result in a decline toward the Mean Support of 99000.
Cryptocurrencies

BITCOIN targets 165k based on VIX's 10-year SupportBitcoin (BTCUSD) has started a new (and possibly last for this Cycle) Bullish Leg following April's bottom and has already made a new All Time High (ATH).
The BTC/VIX ratio on that very same day (April 07 2025) hit and rebounded on its 10-year Higher Lows trend-line, a Support level that has been holding since the August 24 2015 market bottom.
Every rebound on this Higher Lows trend-line, has produced a strong medium-term rally, the 'weakest' of which has been the most recent (August - December 2024), which rose by +121.44%. If BTC repeats this 'minimum', we are looking at a $165000 High, which aligns perfectly with the majority of projections for this Cycle's Top.
Do you think we will see that price by October? Feel free to let us know in the comments section below!
-------------------------------------------------------------------------------
** Please LIKE 👍, FOLLOW ✅, SHARE 🙌 and COMMENT ✍ if you enjoy this idea! Also share your ideas and charts in the comments section below! This is best way to keep it relevant, support us, keep the content here free and allow the idea to reach as many people as possible. **
-------------------------------------------------------------------------------
💸💸💸💸💸💸
👇 👇 👇 👇 👇 👇

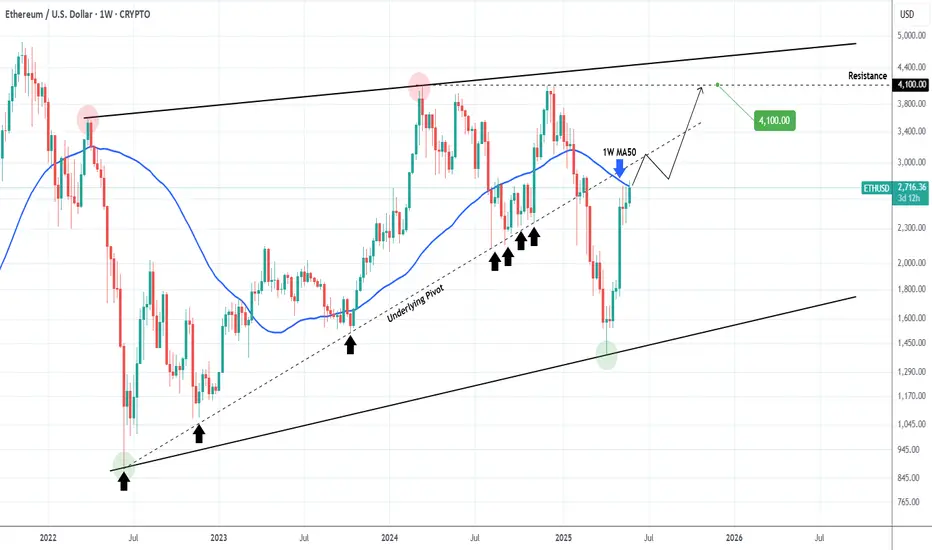
ETHEREUM Break above this level and things get real interesting!Ethereum (ETHUSD) broke above its 1W MA50 (blue trend-line) this week and will attempt to close the week above it to confirm the official restoration of the long-term bullish trend.
Regardless of that, there is another hidden trend-line that may dictate the pace of that potential bullish break-out and is no other than the underlying Pivot trend-line that started on the June 13 2022 market bottom and acted as Higher Lows up until February's Tariff fueled correction.
As a result, this is now posing as a Resistance and a break above it should technically deliver rallies similar to the Bullish Legs of 2023 - 2024.
Our 4100 Target remains intact.
-------------------------------------------------------------------------------
** Please LIKE 👍, FOLLOW ✅, SHARE 🙌 and COMMENT ✍ if you enjoy this idea! Also share your ideas and charts in the comments section below! This is best way to keep it relevant, support us, keep the content here free and allow the idea to reach as many people as possible. **
-------------------------------------------------------------------------------
💸💸💸💸💸💸
👇 👇 👇 👇 👇 👇
BITCOIN Desperately needs that weekly closing!Bitcoin (BTCUSD) broke last week above its January Resistance, effectively making a new All Time High (ATH). Technically, within BTC's dominant 2.5-year Channel Up, that is not enough to generate a bullish extension on its own and the reason is that a 1W candle closing above the Resistance level is needed and not just a break.
At least that's what happened during the last two Bullish Legs, where it required a convincing 1W candle close considerably above the Resistance, to confirm the Bullish Extension. In fact the break-out candles on both previous Bullish Legs is fairly identical.
The minimum % rise on the pattern's three Bullish Legs has been +96.75% with the others not falling way off that range (+98.74% and +106.94%). As a result, the bare minimum Target we can be expecting, in the event of a 1W candle closing above the $109500 Resistance, is $147000.
Do you think that' within the market's immediate reach? Feel free to let us know in the comments section below!
-------------------------------------------------------------------------------
** Please LIKE 👍, FOLLOW ✅, SHARE 🙌 and COMMENT ✍ if you enjoy this idea! Also share your ideas and charts in the comments section below! This is best way to keep it relevant, support us, keep the content here free and allow the idea to reach as many people as possible. **
-------------------------------------------------------------------------------
💸💸💸💸💸💸
👇 👇 👇 👇 👇 👇

XRPUSD This rare signal can send it to $12.5 end of the year.XRP has been practically ranging since the start of the year following the immense rally after the U.S. elections last November. This is technically a Re-accumulation phase supported by the 1W MA50 (blue trend-line), similar to May - November 2017 of XRP's 1st Cycle.
The strong signal that makes this correlation more relevant is the 1M RSI peak above 80.00 and correction back below the oversold barrier (green ellipse), which is identical on both fractals. Also they both took place just below the 1.5 Fibonacci extension level.
The 2017 Re-accumulation, held its 1W MA50 as Support and eventually pushed for one final parabolic rally within the 2.0 - 2.236 Fib range, before the Cycle topped.
As a result, we expect XRPUSD to hit $12.5 by the end of this year.
-------------------------------------------------------------------------------
** Please LIKE 👍, FOLLOW ✅, SHARE 🙌 and COMMENT ✍ if you enjoy this idea! Also share your ideas and charts in the comments section below! This is best way to keep it relevant, support us, keep the content here free and allow the idea to reach as many people as possible. **
-------------------------------------------------------------------------------
💸💸💸💸💸💸
👇 👇 👇 👇 👇 👇

BITCOIN No different than all the Bullish Legs since 2023!Bitcoin (BTCUSD) has just completed a Golden Cross on the 1D time-frame, the 4th such pattern since February 05 2023. All those Golden Crosses have been formed marginally after the Channel Up bottoms and start of their respective Bullish Legs.
The current pattern is no different than any other of those Bullish Legs. On top of that, the 1W MACD has also formed its usual Bullish Cross that has technically always preceded the 1D Golden Cross.
Given that, when this happens, BTC tends to be at least near the 0.5 Fibonacci level from the eventual top, we can estimate that the next peak might be around $165000. This is another indicator that makes our $150k Target for this Cycle more than realistic.
But what do you think? Are you also expecting the market to explode past $150k? Feel free to let us know in the comments section below!
-------------------------------------------------------------------------------
** Please LIKE 👍, FOLLOW ✅, SHARE 🙌 and COMMENT ✍ if you enjoy this idea! Also share your ideas and charts in the comments section below! This is best way to keep it relevant, support us, keep the content here free and allow the idea to reach as many people as possible. **
-------------------------------------------------------------------------------
💸💸💸💸💸💸
👇 👇 👇 👇 👇 👇

BNBUSD aiming for $800 and that's only short-term.Binance Coin (BNBUSD) is staging a strong short-term push after holding its 1D MA200 (orange trend-line). This is taking place on the technical Bullish Leg of the 10-month Channel Up.
The 1W RSI broke above its MA trend-line (yellow) and that confirmed this new bullish structure. The previous Bullish Leg peaked a little over the 2.0 Fibonacci extension. Our short-term Target is therefore $800.
-------------------------------------------------------------------------------
** Please LIKE 👍, FOLLOW ✅, SHARE 🙌 and COMMENT ✍ if you enjoy this idea! Also share your ideas and charts in the comments section below! This is best way to keep it relevant, support us, keep the content here free and allow the idea to reach as many people as possible. **
-------------------------------------------------------------------------------
💸💸💸💸💸💸
👇 👇 👇 👇 👇 👇

HMSTR/USDT NEW BREAK ON WAYHMSTR/USDT has good chance to get a new break in the coming time frames, there are some trend data that shows that HMSTR/USDT has a good change for new time frame confirmation

BITCOIN repeating every Cycle's final rally!Bitcoin (BTCUSD) has been on a strong rally since the April 2025 bottom on the 1W MA50 (blue trend-line) and that's perfectly aligned with the 1W MA50 rebound it had on the previous two Cycles in June 2021 and June 2017.
As you can see, those (blue circles) where the All Time High (ATH) Pivot trend-line test before the final (parabolic) rally of the Cycle started, which was its most aggressive part.
In 2017 it was much stronger and the price rallied much higher, which is natural as the market was much less mature (institutionally) than today, but it is not improbable to get a rally similar to July - November 2021.
Can that be enough to push BTC to $150k and beyond? Feel free to let us know in the comments section below!
-------------------------------------------------------------------------------
** Please LIKE 👍, FOLLOW ✅, SHARE 🙌 and COMMENT ✍ if you enjoy this idea! Also share your ideas and charts in the comments section below! This is best way to keep it relevant, support us, keep the content here free and allow the idea to reach as many people as possible. **
-------------------------------------------------------------------------------
💸💸💸💸💸💸
👇 👇 👇 👇 👇 👇

BITCOIN $119k coming shortlyBitcoin (BTCUSD) has been trading within a 6-week Channel Up and Friday's tariff threats led pull-back was its latest Bearish Leg. That pull-back hit the 4H MA50 (blue trend-line) yesterday and rebounded. As long as the 4H MA100 (green trend-line) which is directly below the Channel Up holds, the current rebound is technically the pattern's new Bullish Leg.
All 4 previous Bullish Legs have ended on fairly similar % rises but the weakest has been +11.41%. With the 4H MACD just now completing a Bullish Cross (which has always been a strong buy signal), a repeat of the +11.41% minimum, gives us an immediate $119000 Target.
Do you think that's coming shortly before the beginning of June? Feel free to let us know in the comments section below!
-------------------------------------------------------------------------------
** Please LIKE 👍, FOLLOW ✅, SHARE 🙌 and COMMENT ✍ if you enjoy this idea! Also share your ideas and charts in the comments section below! This is best way to keep it relevant, support us, keep the content here free and allow the idea to reach as many people as possible. **
-------------------------------------------------------------------------------
💸💸💸💸💸💸
👇 👇 👇 👇 👇 👇

Bitcoin Potential UpsidesHey Traders, in today's trading session we are monitoring BTCUSDT for a buying opportunity around 105,000 zone, Bitcoin is trading in an uptrend and currently is in a correction phase in which it is approaching the trend at 105,000 support and resistance area.
Trade safe, Joe.

BITCOIN is attempting to converge with past Cycles!Bitcoin (BTCUSD) is experiencing the weakest Bull Cycle in its history, a natural product of the Theory of Diminishing Returns (TDM).
This chart couldn't have put it better as we show all Cycles since BTC's first day, one on top of the other. Naturally the first Cycles were the most aggressive, witnessing extraordinary gains as the upside potential of a fresh market was enormous in its early days.
The 2015 - 2017 (blue trend-line) and 2019 - 2021 (black trend-line) Bull Cycles have been harmonized to a more traditional capital market state and this is obvious on their trend-lines, which exhibit similar parallel price action. Whenever the two diverged, they converged at some point during the Cycle.
The current Cycle (2023 - 2025) following the late February 2025 divergence, is now attempting to converge again with its strong rebound in the past 6 weeks. Being however within a Channel Up throughout the entirety of the Cycle, it appears that it will do so in a structured way and as the TDM suggests, will offer weaker gains.
What we can project, as we've shown on previous studies in great detail, is the timing of the Cycle Top. Based on past Cycles, it should be within October - December 2025. Timing your exit strategy can perhaps be more effective than assigning a certain Target, even though the peak is expected to be anywhere within the $150k - $200k range.
So do you agree that the rise we're witnessing is the Cycle's attempt to converge with past ones and close the gap before it tops? Feel free to let us know in the comments section below!
-------------------------------------------------------------------------------
** Please LIKE 👍, FOLLOW ✅, SHARE 🙌 and COMMENT ✍ if you enjoy this idea! Also share your ideas and charts in the comments section below! This is best way to keep it relevant, support us, keep the content here free and allow the idea to reach as many people as possible. **
-------------------------------------------------------------------------------
💸💸💸💸💸💸
👇 👇 👇 👇 👇 👇

DOGEBTC Strong chance that Dogecoin outperforms Bitcoin soon.DOGEBTC is testing its 1W MA50 (blue trend-line), which keeps it into a buy zone, exhibiting the same kind of price action it had during its previous Cycle in late December 2020.
That was right before the parabolic rally started where Dogecoin outperformed Bitcoin massively on the last strong known Altseason.
Right now the market is forming the same 1W MACD Bullish Cross it did on December 21 2020, straight after which it broke above the 1W MA50. The rebounded that was causes even broke above the Cycle's Falling Wedge in a rally that lasted 4 months.
We are inside a similar Falling Wedge since 2021 so a break-out may have a similar outcome. This chart shows that it may be time to move some capital to Doge.
-------------------------------------------------------------------------------
** Please LIKE 👍, FOLLOW ✅, SHARE 🙌 and COMMENT ✍ if you enjoy this idea! Also share your ideas and charts in the comments section below! This is best way to keep it relevant, support us, keep the content here free and allow the idea to reach as many people as possible. **
-------------------------------------------------------------------------------
💸💸💸💸💸💸
👇 👇 👇 👇 👇 👇

BITCOIN made new ATH but still much time left before a Cycle topBitcoin (BTCUSD) is about to enter the final week of May, with the month mostly likely to close on a strong green candle, the 2nd straight. Though it made yesterday a new All Time High (ATH) above 109k and many are already talking about a bearish reversal, this chart shows that there is still plenty of time left before the current Bull Cycle tops.
If fact a simple measurement of the Bottom to Bottom and Bottom to Top ranges of the last 3 Cycles is enough to present all the evidence that are needed for this case.
As you can see, the previous 2 Bull Cycles lasted for 35 months (1065 days) from Bottom to Top. Similarly, the Bottom to Bottom (Bear Cycle to Bear Cycle) measurement has been 47 months (1430 days).
This amazing symmetry suggest that BTC is more likely than not to repeat this feat on the current Cycle as well. A 35 month range from Top to Top indicates that the Bull Cycle is expected to peak on October 2025, while a 47 month Bottom to Bottom range indicates that the next Bear Cycle should bottom in October 2026! As far as a potential price top is concerned, various of the previous analyses we've conducted show that $200k is a fair maximum, but the current study focuses on the timing of profit taking and not specific price levels.
So are you willing to book your profits by this October? Feel free to let us know in the comments section below!
-------------------------------------------------------------------------------
** Please LIKE 👍, FOLLOW ✅, SHARE 🙌 and COMMENT ✍ if you enjoy this idea! Also share your ideas and charts in the comments section below! This is best way to keep it relevant, support us, keep the content here free and allow the idea to reach as many people as possible. **
-------------------------------------------------------------------------------
💸💸💸💸💸💸
👇 👇 👇 👇 👇 👇

BITCOIN Ultimate Cycle Zones breakdown! See when to sell!Bitcoin (BTCUSD) is extending its amazing rebound on its 1W MA50 (blue trend-line), having recovered all of the losses sustained following the U.S. - Chine Trade War. Based on this Cycle's pattern, this 1W MA50 rebound is technically the new Bullish Leg, essentially its 4th of this Cycle.
Among all this, we managed to identify another cyclical pattern, separating the Cycle in terms of Activity Zones:
Naturally its very bottom is what we call the 'Best Buy Zone' (green), where BTC's earliest and most optimal buy opportunities existed. That ranges within the 0.0 and 1.0 Fibonacci levels.
Above that it's the 'Final Buy Zone' (yellow) where in relative efficieny terms, the last long-term buy opportunities existed. That Zone consists of the 1.0 and 2.0 Fibonacci levels.
Third in line is the 'First TP Zone' (orange) where long-term investors who seek lower risk, can start taking profit on their positions. The range on that is the 2.0 - 3.0 Fibonacci levels.
Lastly it's the 'Fina TP Zone' (red) where obviously it is the last opportunity (and with the greatest return but also elevated risk) to take profits before the Cycle prices its Top. This consists of the 3.0 - 4.0 Fibonacci range.
As you may have noticed, each Zone has a .618 interval (highlighted in blue). Zone 1 has the 0.618 Fib, Zone 2 the 1.618 Fib, Zone 3 the 2.618 Fib and one 4 the 3.618 Fib. This is where (so far) the price has made a first consolidation - correction after the start of the new Bullish Leg and before it gets completed at the top Fib. The last such consolidation was from mid December 2024 to late January 2025 and as you see those tend to be significant marks.
This model shows that the current Bullish Leg should prepare us for the Final TP Zone and its first stop is the 3.0 Fib at $135k. This is the bottom of the Final TP Zone and the first region that long-term investors should consider taking profits. The key 3.618 Fib extension is at $210k and in our opinion is the absolute max level we should look to sell all positions as chronologically Cycle wise the trend falls there towards the end of the year, which is where all Cycles topped. A 4.0 Fib test is highly unlikely to take place within this Cycle, unless macroeconomic fundamentals (extreme adoption and/or monetary intervention) kick in and that sits at $280k.
But what do you think? Do you agree with this Zones break-down and if yes are you considering taking profits at 135000? Feel free to let us know in the comments section below!
-------------------------------------------------------------------------------
** Please LIKE 👍, FOLLOW ✅, SHARE 🙌 and COMMENT ✍ if you enjoy this idea! Also share your ideas and charts in the comments section below! This is best way to keep it relevant, support us, keep the content here free and allow the idea to reach as many people as possible. **
-------------------------------------------------------------------------------
💸💸💸💸💸💸
👇 👇 👇 👇 👇 👇

BITCOIN This Cycle's peak zone is $150k - $200k.Bitcoin (BTCUSD) is extending its gains week after week since the April 07 bottom on the 1W MA50, which as we've analyzed extensively its a new Higher Low launchpad for the new (current) Bullish Leg, the way it's been consistently doing on the Higher Lows trend-line since the start of this Bull Cycle.
It's in fact the very same Higher Lows trend-line it had during both previous Cycles, which ended up peaking on the Logarithmic Growth Curve's (LGC) top 2 zones (red), breaking also above the 2 SD above band (orange) of the Mayer Multiple Bands (MMB).
This time the price has 'only' broken above the 1 SD MMB (grey), while having breached into just the lower pink LGC zone. This highlights the theory of Diminishing Returns but at the same time also shows the strong upside potential of the market while subject to these conditions.
So assuming it won't hit by the end of this Cycle the 2 SD MMB nor the top 2 zones of the LGC, the bad case scenario seems to be topping the lower pink LGC zone and the good case scenario topping the upper pink LGC zone. Those two give a profit taking range of 150 - 200k respectively and based on the Sine Waves, we should peak around October 2025.
Is that your profit taking zone as well for this Cycle? Feel free to let us know in the comments section below!
-------------------------------------------------------------------------------
** Please LIKE 👍, FOLLOW ✅, SHARE 🙌 and COMMENT ✍ if you enjoy this idea! Also share your ideas and charts in the comments section below! This is best way to keep it relevant, support us, keep the content here free and allow the idea to reach as many people as possible. **
-------------------------------------------------------------------------------
💸💸💸💸💸💸
👇 👇 👇 👇 👇 👇

ETHEREUM Massive rejection on the 1W MA50. Will it break?Ethereum (ETHUSD) has seen its strongest 1-month rise in recent times since the April 07 rebound and last week that stopped and got rejected exactly on the 1W MA50 (blue trend-line). This rebound is technically the new Bullish Leg of the multi-year Rising Wedge.
The 1W MA50 turned into a Resistance when it last broke on the week of January 27 2025, so almost 4 months ago. Once it breaks and closes a 1W candle above it, we can continue to expect the bullish trend to continue by at least as much as the rise below it (that happened in late 2024).
Technically for now, if it breaks, the upside is limited by the 4100 Resistance, so that will be our Target in that event.
-------------------------------------------------------------------------------
** Please LIKE 👍, FOLLOW ✅, SHARE 🙌 and COMMENT ✍ if you enjoy this idea! Also share your ideas and charts in the comments section below! This is best way to keep it relevant, support us, keep the content here free and allow the idea to reach as many people as possible. **
-------------------------------------------------------------------------------
💸💸💸💸💸💸
👇 👇 👇 👇 👇 👇

BITCOIN forming 1st 1D Golden Cross in 7 months! New ATH ahead??Bitcoin (BTCUSD) is about to form its first Golden Cross on the 1D time-frame in 7 months (since October 27 2024). This comes with the price very close to its $109k All Time High (ATH), following a relentless rebound and recovery from the Trade War correction.
Within the Bull Cycle's 2.5-year Channel Up, all 1D Golden Crosses have delivered higher prices instantly and the minimum % rise one has given before a new 1D MA50 (blue trend-line) pull-back, has been +33.11%.
This gives us an immediate Target of $135000 and is very much in line with a number of previous projections that the date show within this Target Region. Notice also how on all 3 last 1D Golden Crosses, a 1W MACD Bullish Cross precedes it. Basically that is the double confirmation of the medium-term bullish extension.
So do you think this 1D Golden Cross is such a strong buy signal and if yes, is $135k the bare minimum Target short-term? Feel free to let us know in the comments section below!
-------------------------------------------------------------------------------
** Please LIKE 👍, FOLLOW ✅, SHARE 🙌 and COMMENT ✍ if you enjoy this idea! Also share your ideas and charts in the comments section below! This is best way to keep it relevant, support us, keep the content here free and allow the idea to reach as many people as possible. **
-------------------------------------------------------------------------------
💸💸💸💸💸💸
👇 👇 👇 👇 👇 👇

BITCOIN Stairway to 134k.Bitcoin (BTCUSD) is unfolding a very interesting pattern since its April 07 bottom. That was at $74500 and since that level, it has been consistently targeting all 10k intervals above it: From 74k to 84k, 94k and is now on 104k.
Once it hit all those levels, the price consolidated, forming a very structured Channel Up. Now, the Channel Up may not hold forever but this consistency gives us the idea that it can continue targeting all those levels above it: 114k, 124k, 134k. If this pattern continues to hold for as much time as it has since the bottom, then we may see $134k by late June/ early July.
Do you think it is possible to stay this consistent for that long? Feel free to let us know in the comments section below!
-------------------------------------------------------------------------------
** Please LIKE 👍, FOLLOW ✅, SHARE 🙌 and COMMENT ✍ if you enjoy this idea! Also share your ideas and charts in the comments section below! This is best way to keep it relevant, support us, keep the content here free and allow the idea to reach as many people as possible. **
-------------------------------------------------------------------------------
💸💸💸💸💸💸
👇 👇 👇 👇 👇 👇

CARDANO about to form its first ever 1W Golden Cross!Cardano (ADAUSD) is far from dead as not only has it staged a rebound on its 1W MA50 (blue trend-line) but is also close to forming its first ever Golden Cross on the 1W time-frame. Technically this is a similar set-up to November 2020 right after ADA held its 1W MA50, made a Higher Low on its 1W RSI (like today) and started to rise.
This rise ended up forming the top of the 7-year Channel Up just below the 1.236 Fibonacci extension from the previous Cycle High. Basically this whole Bull Cycle has been identical to the December 2018 - December 2020 and right now it appears that the market has started the final parabolic rally.
If the pattern approaches the 1.236 Fib extension again, expect the Cycle to peak around $5.000.
-------------------------------------------------------------------------------
** Please LIKE 👍, FOLLOW ✅, SHARE 🙌 and COMMENT ✍ if you enjoy this idea! Also share your ideas and charts in the comments section below! This is best way to keep it relevant, support us, keep the content here free and allow the idea to reach as many people as possible. **
-------------------------------------------------------------------------------
💸💸💸💸💸💸
👇 👇 👇 👇 👇 👇

BITCOIN 's 'Final 6 months rally' kickstarts the Altseason!This isn't the first time we show you this chart but it couldn't be more relevant than today. We have established on previous analyses how Bitcoin (BTCUSD) has most likely started the final rally of its Cycle, historically the parabolic rally of the last 6 months of the Bull Cycle that ends with its Top.
The addition of today's analysis is that with Bitcoin Dominance (orange trend-line) approaching its 8-year Lower Highs trend-line, this 'Final 6 months rally' of BTC is what technically also starts the Altseason. This is when lower cap coins see massive gains compared to the high cap ones.
At the same time, we get one more confirmation of why a $150k BTC Target is realistic, as by the end of 2025, this price would still be on the 0.618 Fibonacci level of the 8-year Fib Channel Up, a rather 'bad case' scenario based on this pattern.
So what do you think? Will BTC's Final 6 months rally spark a massive Altseason too? Feel free to let us know in the comments section below!
-------------------------------------------------------------------------------
** Please LIKE 👍, FOLLOW ✅, SHARE 🙌 and COMMENT ✍ if you enjoy this idea! Also share your ideas and charts in the comments section below! This is best way to keep it relevant, support us, keep the content here free and allow the idea to reach as many people as possible. **
-------------------------------------------------------------------------------
💸💸💸💸💸💸
👇 👇 👇 👇 👇 👇

BITCOIN making the FINAL PUSH! Only 6 months of BULL left!Bitcoin (BTCUSD) has had n astonishing symmetry among its Cycles in the past 11 years, as all three of the Bear Cycles have had identical durations (13 and 12 months twice) as well as the two Bull Cycles (both 35 months).
As a result, there is no reason to assume otherwise for the current Bull Cycle as well, which if it also lasts for 35 months, it will peak in October 2025. This means that BTC might 'only' have another 6 months of Bull Cycle ahead of it but that's not bad news as historically this phase tends to be the most aggressive part.
Even if it's not, various studies we've done before point out that a price around $150k would be more than fair and practically a 'pessimistic' scenario for the Cycle High.
Do you think that will be the case? Feel free to let us know in the comments section below!
-------------------------------------------------------------------------------
** Please LIKE 👍, FOLLOW ✅, SHARE 🙌 and COMMENT ✍ if you enjoy this idea! Also share your ideas and charts in the comments section below! This is best way to keep it relevant, support us, keep the content here free and allow the idea to reach as many people as possible. **
-------------------------------------------------------------------------------
💸💸💸💸💸💸
👇 👇 👇 👇 👇 👇

SUIUSDT; Heikin Ashi trade ideaBYBIT:SUIUSDT
Simple explanation on the chart. For any additional info's, you can let me know in the comments.
Thank you
