LSK/USDT - Lisk: Super Trend◳◱ On the $LSK/ CRYPTOCAP:USDT chart, the Super Trend pattern suggests indications that the trend may be gaining or losing strength. Traders might observe resistance around 1.259 | 1.319 | 1.43 and support near 1.148 | 1.097 | 0.986. Entering trades at 1.184 could be strategic, aiming for the next resistance level.
◰◲ General info :
▣ Name: Lisk
▣ Rank: 258
▣ Exchanges: Binance, Kucoin, Huobipro, Gateio, Bittrex, Hitbtc
▣ Category/Sector: Infrastructure - Application Development
▣ Overview: Lisk is a blockchain application platform. Based on its own network and utility token LSK, Lisk aims to enable JavaScript developers to build blockchain applications and deploy their own sidechain linked to the Lisk mainchain, including a custom token. The network is operated using the Delegated Proof of Stake (DPoS) consensus algorithm.
◰◲ Technical Metrics :
▣ Mrkt Price: 1.184 ₮
▣ 24HVol: 2,057,948.877 ₮
▣ 24H Chng: 3.86%
▣ 7-Days Chng: -5.06%
▣ 1-Month Chng: 0.51%
▣ 3-Months Chng: 56.75%
◲◰ Pivot Points - Levels :
◥ Resistance: 1.259 | 1.319 | 1.43
◢ Support: 1.148 | 1.097 | 0.986
◱◳ Indicators recommendation :
▣ Oscillators: BUY
▣ Moving Averages: BUY
◰◲ Technical Indicators Summary : BUY
◲◰ Sharpe Ratios :
▣ Last 30D: 0.39
▣ Last 90D: 2.49
▣ Last 1-Y: 0.61
▣ Last 3-Y: 0.43
◲◰ Volatility :
▣ Last 30D: 1.00
▣ Last 90D: 0.79
▣ Last 1-Y: 0.75
▣ Last 3-Y: 1.12
◳◰ Market Sentiment Index :
▣ News sentiment score is N/A
▣ Twitter sentiment score is 0.43 - Bearish
▣ Reddit sentiment score is 0.73 - Bullish
▣ In-depth LSKUSDT technical analysis on Tradingview TA page
▣ What do you think of this analysis? Share your insights and let's discuss in the comments below. Your like, follow and support would be greatly appreciated!
◲ Disclaimer
Please note that the information and publications provided are for informational purposes only and should not be construed as financial, investment, trading, or any other type of advice or recommendation. We encourage you to conduct your own research and consult with a qualified professional before making any financial decisions. The use of the information provided is solely at your own risk.
▣ Welcome to the home of charting big: TradingView
Benefit from a ton of financial analysis features, instruments and data. Have a look around, and if you do choose to go with an upgraded plan, you'll get up to $30.
Discover it here - affiliate link -
Cryptocurrencies

LSK/BTC - Lisk: BBand Breakout◳◱ On the $LSK/ CRYPTOCAP:BTC chart, the Bband Breakout pattern suggests an upcoming trend shift. Traders might observe resistance around 0.00002999 | 0.00003259 | 0.00003675 and support near 0.00002583 | 0.00002427 | 0.00002011. Entering trades at 0.00002783 could be strategic, aiming for the next resistance level.
◰◲ General info :
▣ Name: Lisk
▣ Rank: 264
▣ Exchanges: Binance, Huobipro, Gateio, Bittrex, Kraken, Hitbtc
▣ Category/Sector: Infrastructure - Application Development
▣ Overview: Lisk is a blockchain application platform. Based on its own network and utility token LSK, Lisk aims to enable JavaScript developers to build blockchain applications and deploy their own sidechain linked to the Lisk mainchain, including a custom token. The network is operated using the Delegated Proof of Stake (DPoS) consensus algorithm.
◰◲ Technical Metrics :
▣ Mrkt Price: 0.00002783 ₿
▣ 24HVol: 6.234 ₿
▣ 24H Chng: 4.703%
▣ 7-Days Chng: -5.01%
▣ 1-Month Chng: 0.56%
▣ 3-Months Chng: 56.83%
◲◰ Pivot Points - Levels :
◥ Resistance: 0.00002999 | 0.00003259 | 0.00003675
◢ Support: 0.00002583 | 0.00002427 | 0.00002011
◱◳ Indicators recommendation :
▣ Oscillators: NEUTRAL
▣ Moving Averages: BUY
◰◲ Technical Indicators Summary : BUY
◲◰ Sharpe Ratios :
▣ Last 30D: 0.39
▣ Last 90D: 2.49
▣ Last 1-Y: 0.61
▣ Last 3-Y: 0.43
◲◰ Volatility :
▣ Last 30D: 1.00
▣ Last 90D: 0.79
▣ Last 1-Y: 0.75
▣ Last 3-Y: 1.12
◳◰ Market Sentiment Index :
▣ News sentiment score is N/A
▣ Twitter sentiment score is 0.43 - Bearish
▣ Reddit sentiment score is 0.73 - Bullish
▣ In-depth LSKBTC technical analysis on Tradingview TA page
▣ What do you think of this analysis? Share your insights and let's discuss in the comments below. Your like, follow and support would be greatly appreciated!
◲ Disclaimer
Please note that the information and publications provided are for informational purposes only and should not be construed as financial, investment, trading, or any other type of advice or recommendation. We encourage you to conduct your own research and consult with a qualified professional before making any financial decisions. The use of the information provided is solely at your own risk.
▣ Welcome to the home of charting big: TradingView
Benefit from a ton of financial analysis features, instruments and data. Have a look around, and if you do choose to go with an upgraded plan, you'll get up to $30.
Discover it here - affiliate link -

BITCOIN Stocks are hitting ATH earlier than BTC. Is it normal?The U.S. stocks are making new All Time Highs (ATH), with the Dow Jones already broken it, while the Nasdaq and the S&P500 (chart on the right) are very close too, while Bitcoin (BTCUSD) is almost -40% below its own ATH (chart on the left). Why is that and is it something normal?
Short answer: yes. Throughout BTC's history, it was always trailing (sometimes by an incredible margin) when the S&P500 was breaching its previous ATH after a multi-month correction. You can see those on times on the charts above (S&P hitting ATH on the blue vertical line, BTC's level at this time on the orange vertical line). It is interesting to note that every other Cycle, BTC is closer to its ATH than the previous, i.e. currently it's closer as opposed to April 2019 and before that (July 2016) it was again much closer, while on February 2012 it was on the lowest margin ever. Could be a Cyclical dynamic.
What's even more practical is that after every ATH breach for the S&P500, the index declines while Bitcoin rises, possibly in an early attempt to fill the gap.
The reasoning behind stocks making new ATH first, is that even though they are classified as risky assets, they don't match the incredibly high volatility and risk factor of Bitcoin (cryptocurrency). And the idea is that investors feel more comfortable investing capital in riskier assets, after the main market/ economy is booming and is confirmed.
What this tells you is that we are on the right Cyclical track as it happens every time on the same part of the Cycle. The stock market has left the 2022 inflation correction/ Bear Cycle back for good as it recovered all loses and is entering a new phase of expansion, and Bitcoin being closer to its Halving, is about to initiate the Parabolic Rally part of its new Bull Cycle.
But what do you think? Will Bitcoin catch up sooner than expected this time? Feel free to let us know in the comments section below!
-------------------------------------------------------------------------------
** Please LIKE 👍, FOLLOW ✅, SHARE 🙌 and COMMENT ✍ if you enjoy this idea! Also share your ideas and charts in the comments section below! This is best way to keep it relevant, support us, keep the content here free and allow the idea to reach as many people as possible. **
-------------------------------------------------------------------------------
💸💸💸💸💸💸
👇 👇 👇 👇 👇 👇

ETHUSDT: LONG POSITION GO UP!Hello dears. Hello dears. According to the chart of ETHUSDT we see the pullback on the braked base and the price continued the rally and so went uptrend to reach the first goal of 2667 $ and I guess the price touched the lowest and went to 3200 $.So we enjoy it

BTCUSDT: Now Start Long Hi there . Please follow my trade to get best profits . The last of my analysis be accrued I hope this analysis as it possible .

AVAXUSD $55.00 is on the cards but then expect correction.Avalanche (AVAXUSD) hit all of our targets during November's run (see chart below) and even broke above the 1W MA100 (green trend-line) for the first time ever:
This resembles the incredible rally of January 2021, even though it has been executed during a different time period of the global Cycle. Nonetheless, one last spike to the 1.786 Fibonacci to make a February 08 2021 type High, is expected (target = $55.00) but then most likely the market will correct back to the 1W MA50 (blue trend-line). After that, our long-term target will be 105.00 (Resistance 1).
-------------------------------------------------------------------------------
** Please LIKE 👍, FOLLOW ✅, SHARE 🙌 and COMMENT ✍ if you enjoy this idea! Also share your ideas and charts in the comments section below! This is best way to keep it relevant, support us, keep the content here free and allow the idea to reach as many people as possible. **
-------------------------------------------------------------------------------
💸💸💸💸💸💸
👇 👇 👇 👇 👇 👇

SAND/USDT Trading IdeaBelow is a trading idea for the SAND/USDT pair.
Since the beginning of October, this asset has shown a consistent upward trend. Starting at $0.2739 and reaching a current high of $0.5970 , it has grown by more than 114% . The trend line, acting as support, confirms continued interest from buyers in this coin, having held up through three significant approaches. Currently, the asset is undergoing a correction after hitting a local price peak.
The idea is to consider buying the asset if the price drops below the Value Area High and approaches the level close to the support trend line.
The trend's stability is confirmed by the continuation of the upward movement after the correction from the local peak, accompanied by noticeable increases in trading volumes. After entering a position, the first target is considered to be $0.5992, with the second target at $0.7178.

The first big pullback since mid-October 2023In yet first significant pullback since mid-October 2023, Bitcoin shed about 9% of its value in the past three days (with much of the decline coming overnight). In the process of doing so, it retraced almost to the 20-day SMA, which often coincides with corrections of the main trend. Despite that, there are a few developments that stand out to us. First, the RSI and ADX are forming divergence on the daily chart. Second, there has been a modest decline in the number of Bitcoin addresses with balances exceeding 1,000 BTC (since around 5th December 2023 when Bitcoin was erupting to new highs); the same applies to addresses with holdings exceeding 100 BTC. We previously outlined the possibility of this happening and noted that it would be worrisome since a similar dynamic played out around April 2023 and July 2023 (at particular peaks in Bitcoin’s price). We will monitor the mentioned developments in the following days but for now, we still prefer to stay on the sidelines. We will announce once our stance changes.
Illustration 1.01
Illustration 1.01 portrays the daily chart of BTCUSD. The yellow arrow highlights Bitcoin’s retracement toward the 20-day SMA, which often acts as a correction of the main trend. We will pay close attention to this level because if it fails to hold the selling pressure, it will raise the odds of a bearish crossover between the 20-day SMA and 50-day SMA (and potential trend reversal).
Illustration 1.02
Illustration 1.02 shows the divergence between the price and the RSI (on the daily chart).
Technical analysis gauge
Daily time frame = Bullish (losing momentum)
Weekly time frame = Bullish
*The gauge does not necessarily indicate where the market will head. Instead, it reflects the constellation of multiple indicators.
Please feel free to express your ideas and thoughts in the comment section.
DISCLAIMER: This analysis is not intended to encourage any buying or selling of any particular securities. Furthermore, it should not serve as a basis for taking any trade action by an individual investor or any other entity. Your own due diligence is highly advised before entering a trade.

BTCUSDT: Long PositionHi there . We see the char BTCUSDT in a abc wave . We in the C wave to reach the target shows in the chart .

PROPUSD Make or break time for the Channel Up.Propchain (PROPUSD) is trading within a Channel Up pattern since early October. Since October 20 in particular, the 1D MA50 (blue trend-line) has been supporting. At the moment, the price is testing both the Channel's bottom (Higher Lows trend-line) and the 1D MA50.
As long as they hold, we are bullish, aiming for another +75% (roughly) leg at 3.400. If we close a 1D candle below the Channel and 1D MA50, we will sell and target Support 1 and the 1D MA200 (orange trend-line) at 1.6500.
The 1D RSI has already broken below its Channel Up, which is a similar signal to August 11 before the 1D MA50 broke.
-------------------------------------------------------------------------------
** Please LIKE 👍, FOLLOW ✅, SHARE 🙌 and COMMENT ✍ if you enjoy this idea! Also share your ideas and charts in the comments section below! This is best way to keep it relevant, support us, keep the content here free and allow the idea to reach as many people as possible. **
-------------------------------------------------------------------------------
💸💸💸💸💸💸
👇 👇 👇 👇 👇 👇

BITCOIN Global bonds and Yuan signal a strong rally ahead.Those who follows for long know that this is not the first time we mix bonds and Chinese liquidity into Bitcoin's (BTCUSD) long-term analysis. We do so as more than a year ago we discovered their importance on BTC's trending patterns, which is so much affected by the monetary supply.
This time we decided to incorporate a fair Global Bonds Yield pool metric (blue trend-line) as well as the DXY/USDCNY ratio (red trend-line) in order to see on which stage of the liquidity cyclical patterns we are.
Global bonds trading within a +10 year Channel Down but are on the new Bullish Leg. It still has a full year before it hit the top and last time it was on this symmetrical level, Bitcoin was starting a Parabolic Rally. At the same time the DXY/USDCNY ratio is having the recent June rebound rejected (red circle) in the same way it did on November 2016. BTC is already three strong bullish months in, rising since September.
Do you think this is the start of a +1 year parabolic rally? Feel free to let us know in the comments section below!
-------------------------------------------------------------------------------
** Please LIKE 👍, FOLLOW ✅, SHARE 🙌 and COMMENT ✍ if you enjoy this idea! Also share your ideas and charts in the comments section below! This is best way to keep it relevant, support us, keep the content here free and allow the idea to reach as many people as possible. **
-------------------------------------------------------------------------------
💸💸💸💸💸💸
👇 👇 👇 👇 👇 👇

KCSUSDT You can still make profit on this rally.The KuCoin Token (KCSUSDT) is having a remarkable rally since November 05, which the last 2 days in particular being the strongest of the sequence. This sequence is supported by a Higher Lows trend-line, moving parallel to the 1D MA50 (blue trend-line). Having broken above the Bear Cycle's Channel Down, the trend turned parabolically bullish and has already smashed through one 18 month Resistance level. As long as the Higher Lows hold, there is still time to buy and take advantage of this momentum, to target the next Resistance in line at 18.000.
-------------------------------------------------------------------------------
** Please LIKE 👍, FOLLOW ✅, SHARE 🙌 and COMMENT ✍ if you enjoy this idea! Also share your ideas and charts in the comments section below! This is best way to keep it relevant, support us, keep the content here free and allow the idea to reach as many people as possible. **
-------------------------------------------------------------------------------
💸💸💸💸💸💸
👇 👇 👇 👇 👇 👇

SOL/USDT Trading ScenariosWe are considering two scenarios for the SOL/USDT pair.
After reaching the $68 level, the asset's price dropped to $51.08. At this point, there was a successful test of a strong inclined support level, followed by a confident rebound. Currently, due to the decline, an inclined resistance level has formed.
First Scenario: Upon the third approach to the inclined resistance level and price consolidation below it, there is a possibility of entering a long position. The potential target is $60, with a second target set at $68.
Second Scenario: If the decline continues and the price consolidates near the inclined support level, followed by a break above it and reaching $47.5 with a solid rebound and confirmation above $47.5 on high trading volume, there is consideration for entering a long position within this price range.
The growth potential is estimated up to $60.

LTC/USD Secondary trend. DownlinkSecondary flow. Logarithmic graph. Term 3 days.
Main trend. — an ascending channel in which a huge butterfly is forming (part 2 is being formed)
Secondary trend is a downward channel.
Local trend in the secondary trend—wedge-shaped clamping of the price
Coin in coinmarket : Litecoin
The same options. Line chart.
Main trend
LTC/USD Main trend. Halving. Cycles, The psychology of repetition.
This butterfly. Logarithm. Deadline 1 week. I have shown one more variant of its formation in case of violation of its dynamic support.

AVAX INCREASE VOLUME ( READY FOR NEW BREAK)Thank you for reading this update.
Depending on our study we see that AVAX has a good chance of volume increase.
This updates depending on day trade, And the market should confirm with time the right market way.
AVAX is known as building coins and it can show in the coming time frames a break.
We looking to the $13-14 level where the break can start.
$17 is an important level in combination with $21.40
We know this coin from the historical increase that started at JULE 2021 with $9.70 and ended in NOV 2021 with $146
SINCE THIS COIN IS UP $10 it entering a high-volume area.
#Nottradingadvice

Bitcoin(BTC/USD) Daily Chart Analysis For Week of Dec 8, 2023Technical Analysis and Outlook:
Bitcoin has completed our three consecutive Outer Coin Rallies 39200, 41200, and 43700 in this week's trading. On the downside, the intermediate down target is Mean Sup 43100. The subsequent squeeze will likely be Mean Sup 41500.
The upside price movement is expected to be aggressive and intense, as the market sentiment is tilted towards bullishness. The market participants will likely be actively buying, leading to a surge in demand for the asset pushing the price higher. However, it is essential to note that the market is volatile and subject to sudden changes, so investors should remain cautious and closely monitor the support and rally outcome price targets.

BTC/USDT ScenariosWe are considering two possible scenarios for the development of the situation with BTC.
At the end of October, following a significant impulsive rise of BTC from $29,614 to $35,300 , there was an increase of more than 18%. In the following month, an ascending trading channel was observed, which was successfully broken after testing the upper boundary at $39,670. As a result of the breakout, the asset reached a price level of $44,436 , marking an increase of more than 11%.
The first scenario focuses on the current overbought condition of the BTC price, which suggests the potential for a correction. There is a possibility of a downward corrective movement until reaching the upper boundary of the trading channel, located around $40,600, with a subsequent potential reversal. If the price remains stable at this level, there is consideration for opening a long position on BTC.
In the second scenario, a significant price decrease towards the level of the highest volume POC at $37,100 is anticipated. From this level, a price reversal might occur, followed by a continuation of the upward movement. If the price remains stable at this level and there are signals for a reversal, we are also considering the possibility of buying BTC.

USDT/DOT Speculative Trading IdeaBelow is a speculative trading idea for the DOT/USDT pair.
Currently, the asset's price has broken through an inclined level after updating the minimum at the price of $3.550 within the current global downtrend. After reaching the $3.550 level, there was a rebound, amounting to over 41% to the current price. This situation indicates an attempt to break the local downtrend in effect in 2023.
As we anticipate a price correction, we identify two entry points for the asset to continue the upward movement within this correction.
We place our first limit orders to buy DOT at price levels of $4.550 with a growth potential of 37% to the price level of $6.273.
We place our second limit orders to buy DOT at price levels of $4.220 with a growth potential of 50% to the price level of $6.273.

SOLANA Close to breaking above the 1-year Channel Up.Solana (SOLUSD) made a bulls eye on our $65.00 July 27 target (see chart below) and is now attempting a critical break-out:
More specifically is it the second time it makes a marginal breach at the top (Higher Highs trend-line) of the 1-year Channel Up. The 1D MA50 (blue trend-line) has been in absolute Support during October - November's parabolic run. Technically if SOL does close the candle above the Channel Up, it opens the way for a 144.00 Resistance 1 (April 02 2022 High) test, as long as the 1D MA100 (green trend-line) supports.
However it has to pointed out that this is the first time on a Channel Up top that the 1D RSI's Lower Highs are flashing a Bearish Divergence. DUring the other two tops, it was alighed with the Lower Highs of the price.
-------------------------------------------------------------------------------
** Please LIKE 👍, FOLLOW ✅, SHARE 🙌 and COMMENT ✍ if you enjoy this idea! Also share your ideas and charts in the comments section below! This is best way to keep it relevant, support us, keep the content here free and allow the idea to reach as many people as possible. **
-------------------------------------------------------------------------------
💸💸💸💸💸💸
👇 👇 👇 👇 👇 👇

AVAX moon waning or waxing? Elliott waveIf you find this information inspiring/helpful, please consider a boost and follow! Any questions or comments, please leave a comment! Also, check out the links in my signature to get to know me better!
WXY posted caught the pivot dece! 🧵
Here is my ideal path for the bulls IF it stays above
25.
Then 30?

DAR/BTC - Jupiter: Trend Reversal◳◱ On the $DAR/ CRYPTOCAP:BTC chart, the Trend Reversal pattern suggests indications that the trend may be gaining or losing strength. Traders might observe resistance around 0.00000342 | 0.00000367 | 0.00000411 and support near 0.00000298 | 0.00000279 | 0.00000235. Entering trades at 0.0000032 could be strategic, aiming for the next resistance level.
◰◲ General info :
▣ Name: Jupiter
▣ Rank: 1354
▣ Exchanges: Binance, Kucoin, Hitbtc
▣ Category/Sector: N/A
▣ Overview: Jupiter project overview is currently unavailable. I'll try to update this in the upcoming analysis.
◰◲ Technical Metrics :
▣ Mrkt Price: 0.0000032 ₿
▣ 24HVol: 1.494 ₿
▣ 24H Chng: 6.667%
▣ 7-Days Chng: 28.96%
▣ 1-Month Chng: 59.70%
▣ 3-Months Chng: 26.87%
◲◰ Pivot Points - Levels :
◥ Resistance: 0.00000342 | 0.00000367 | 0.00000411
◢ Support: 0.00000298 | 0.00000279 | 0.00000235
◱◳ Indicators recommendation :
▣ Oscillators: BUY
▣ Moving Averages: STRONG_BUY
◰◲ Technical Indicators Summary : BUY
◲◰ Sharpe Ratios :
▣ Last 30D: N/A
▣ Last 90D: N/A
▣ Last 1-Y: N/A
▣ Last 3-Y: N/A
◲◰ Volatility :
▣ Last 30D: N/A
▣ Last 90D: N/A
▣ Last 1-Y: N/A
▣ Last 3-Y: N/A
◳◰ Market Sentiment Index :
▣ News sentiment score is N/A
▣ Twitter sentiment score is N/A
▣ Reddit sentiment score is 0.58 - Bullish
▣ In-depth DARBTC technical analysis on Tradingview TA page
▣ What do you think of this analysis? Share your insights and let's discuss in the comments below. Your like, follow and support would be greatly appreciated!
◲ Disclaimer
Please note that the information and publications provided are for informational purposes only and should not be construed as financial, investment, trading, or any other type of advice or recommendation. We encourage you to conduct your own research and consult with a qualified professional before making any financial decisions. The use of the information provided is solely at your own risk.
▣ Welcome to the home of charting big: TradingView
Benefit from a ton of financial analysis features, instruments and data. Have a look around, and if you do choose to go with an upgraded plan, you'll get up to $30.
Discover it here - affiliate link -

WEMIXUSD Targeting $6.000 after the next pull-back.WEMIX (WEMIXUSD) broke yet above another Resistance (2.7675) yesterday as well as the 0.5 Fibonacci retracement level. It is about to complete a +160% rise from the previous Low, which is the % range that the previous two bullish legs have registered before pulling back since the August 17 low. The next Resistance level is at 4.700 almost exactly on the 0.618 retracement level, but after the expected pull-back now, our target will be higher, another +160% leg at $6.000.
-------------------------------------------------------------------------------
** Please LIKE 👍, FOLLOW ✅, SHARE 🙌 and COMMENT ✍ if you enjoy this idea! Also share your ideas and charts in the comments section below! This is best way to keep it relevant, support us, keep the content here free and allow the idea to reach as many people as possible. **
-------------------------------------------------------------------------------
💸💸💸💸💸💸
👇 👇 👇 👇 👇 👇

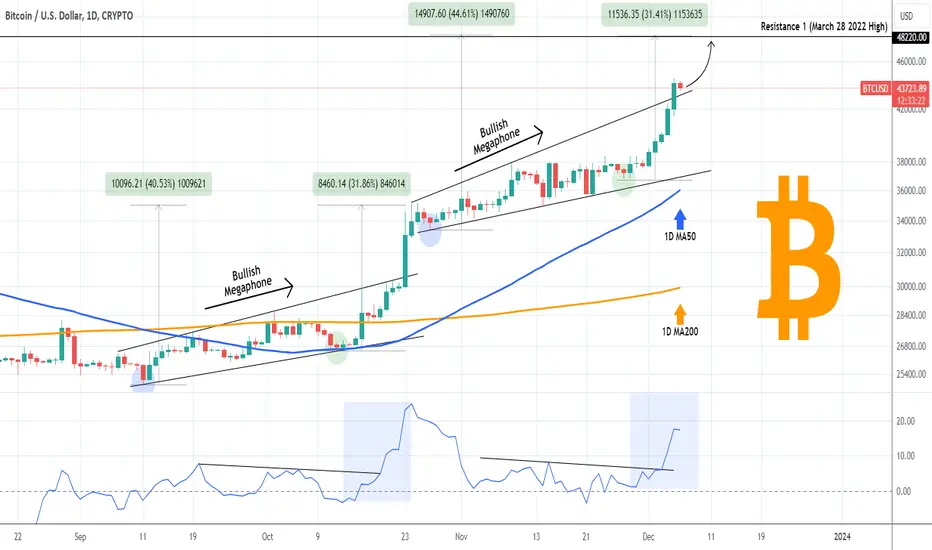
BITCOIN Megaphone breached! How high can the price go?Bitcoin (BTCUSD) broke yesterday above the Bullish Megaphone pattern that kept it at bay since the October 24 High. The previous Bullish Megaphone of September - October technically served as a consolidation belt before the price broke upwards to deliver a +31.86% peak from the Megaphone's last Higher Low and +40.50% from its first Low.
The ROC shows a similar behavioral structure between the two patterns. If it continues this way, then a new +31.50% leg will make a perfect contact on 48220, which is the March 28 2022 High, essentially the Bear Cycle's first Lower High and a key Resistance level of the current Bull Cycle. Technically, as long as the 1D MA50 (blue trend-line) holds (has been doing so since Sep 28), that is a realistic end target for this bullish wave.
But what do you think? Do you agree that this is a likely extension for this rally before the price pulls back or you expect a pull back now? Feel free to let us know in the comments section below!
-------------------------------------------------------------------------------
** Please LIKE 👍, FOLLOW ✅, SHARE 🙌 and COMMENT ✍ if you enjoy this idea! Also share your ideas and charts in the comments section below! This is best way to keep it relevant, support us, keep the content here free and allow the idea to reach as many people as possible. **
-------------------------------------------------------------------------------
💸💸💸💸💸💸
👇 👇 👇 👇 👇 👇