DOGEUSD Massive Bull Flag targets $0.40 like late 2024!Dogecoin (DOGEUSD) is posting a Bull Flag pattern on the 4H time-frame, being supported by the 4H MA50 (blue trend-line).
A similar Bull Flag was formed at the start of its previous major rally in October 2024, which made the price jump to the 2.0 Fibonacci extension, in as much time as it took for the price to reach the Bull Flag's start from the bottom.
As a result, we expect DOGE's next short-term Target to be $0.40.
-------------------------------------------------------------------------------
** Please LIKE 👍, FOLLOW ✅, SHARE 🙌 and COMMENT ✍ if you enjoy this idea! Also share your ideas and charts in the comments section below! This is best way to keep it relevant, support us, keep the content here free and allow the idea to reach as many people as possible. **
-------------------------------------------------------------------------------
💸💸💸💸💸💸
👇 👇 👇 👇 👇 👇
Cryptocurrencies

BITCOIN on similar spot as before the U.S. elections! 155k next?Bitcoin (BTCUSD) broke last week above the Lower Highs trend-line of its December 2024 High and so far on the current 1W candle, it's consolidating on it.
This is the exact same price action we saw on the October 21 2024 1W candle, which after breaking above that Lower Highs trend-line at the time, it spend 2 weeks consolidating on it before the November 05 U.S. election result started a relentless 7 week rally just below the 2.0 Fibonacci extension.
Note that on both fractals, the Lower Highs break-out and then re-test, took place on the 0.786 Fibonacci retracement level. If BTC manages to close above it at all times, we will have a strong case to expect again a Bullish extension as last December. The symmetrical level just below the 2.0 Fib ext in today's terms is $155000.
Do you think that will be next after a short-term consolidation? Feel free to let us know in the comments section below!
-------------------------------------------------------------------------------
** Please LIKE 👍, FOLLOW ✅, SHARE 🙌 and COMMENT ✍ if you enjoy this idea! Also share your ideas and charts in the comments section below! This is best way to keep it relevant, support us, keep the content here free and allow the idea to reach as many people as possible. **
-------------------------------------------------------------------------------
💸💸💸💸💸💸
👇 👇 👇 👇 👇 👇

BITCOIN about to test its ATH following HUGE U.S. - China deal!Bitcoin (BTCUSD) is marching towards the $109000 Resistance, which is its All Time High (ATH), following the U.S. - China trade agreement 3 hours ago. This can be a huge fundamental boost to the bullish trend as technically, every time the Resistance level broke during this Bull Cycle, the break-out that followed was extremely aggressive.
On October 2 2023, the Resistance test resulted into a strong break-out, which completed a +96.18% rise from the bottom before a 1D MA100 (green trend-line) pull-back. At the same time of the Resistance break-out, we had a 1D MA50/100 Bullish Cross and a 1W MACD Bullish Cross.
The October 29 2024 Resistance test on the other hand was initially unsuccessful and made a 5 day rejection back near the 1D MA50 (blue trend-line) before the next successful test. Again the rise was more than +96.18%.
As a result, we are expecting to see at least $145k by July (+96.18%) once the Resistance breaks.
Do you think that is a realistic time-frame for $145000? Feel free to let us know in the comments section below!
-------------------------------------------------------------------------------
** Please LIKE 👍, FOLLOW ✅, SHARE 🙌 and COMMENT ✍ if you enjoy this idea! Also share your ideas and charts in the comments section below! This is best way to keep it relevant, support us, keep the content here free and allow the idea to reach as many people as possible. **
-------------------------------------------------------------------------------
💸💸💸💸💸💸
👇 👇 👇 👇 👇 👇

Bitcoin(BTC/USD) Daily Chart Analysis For Week of May 9, 2025Technical Analysis and Outlook:
Bitcoin leapfrogged our Interim Coin Rally 100000 via Key Res 97500 in this week's trading session and is clearly aiming to retest the next target of completed Inner Coin Rally 108000. Nevertheless, current price movements indicate a potential retracement from Mean Resistance 104000 toward the Mean Support level at 99300, with a further possible decline likely toward an additional Mean Support target at 94000. However, it is imperative to recognize the potential for upward momentum from the current level, as this could facilitate a trajectory toward the Key Res 106100 and the next Interim Coin Rally at $108,000 and beyond.

DOGEUSD Started its final rally and can hit $1.300Dogecoin (DOGEUSD) just broke above its 1W MA50 (blue trend-line) again for the first time since March 24 2025 and is doing so after a clear rebound on its 1W MA100 (green trend-line). This is a technical bottom formation, that resembles the one on September 11 2017, right before that Cycle's final rally was initiated.
The 1W RSI has already broken above its MA trend-line (yellow) and every time that took place since October 16 2023, DOGE posted a strong rally. As you can see, the similarities between the two fractals are remarkable, both unfolding a structured bullish pattern on similar stages, with a 1W MA50/100 Bullish Cross leading to the massive Bull Flag (green) that bottomed on the 1W MA100 and initiating the parabolic rally.
In 2017 it topped on the 1.786 Fibonacci extension, so if it continues to replicate that fractal, we expect this run to hit $1.300 by the end of the year and make the Cycle's Top.
-------------------------------------------------------------------------------
** Please LIKE 👍, FOLLOW ✅, SHARE 🙌 and COMMENT ✍ if you enjoy this idea! Also share your ideas and charts in the comments section below! This is best way to keep it relevant, support us, keep the content here free and allow the idea to reach as many people as possible. **
-------------------------------------------------------------------------------
💸💸💸💸💸💸
👇 👇 👇 👇 👇 👇

TIAUSD just broke above the 5-month Falling Wedge!Celestia (TIAUSD) made a major bullish break-out today as not only did it break above its 1D MA50 (blue trend-line) but also above the 5-month Lower Highs trend-line (December 06 2024), which is the top of the Falling Wedge pattern!
With the 1D RSI also on Higher Lows, this bullish momentum is targeting the 2.0 Fibonacci extension level at 4.000, which is where contact with the 1D MA200 (orange trend-line) is expected to be made.
-------------------------------------------------------------------------------
** Please LIKE 👍, FOLLOW ✅, SHARE 🙌 and COMMENT ✍ if you enjoy this idea! Also share your ideas and charts in the comments section below! This is best way to keep it relevant, support us, keep the content here free and allow the idea to reach as many people as possible. **
-------------------------------------------------------------------------------
💸💸💸💸💸💸
👇 👇 👇 👇 👇 👇

BITCOIN Monthly RSI Heatmap reveals ultimate Cycle Sell Zone!Bitcoin (BTCUSD) has resumed the long-term bullish trend and as of the writing of this analysis, it is about to test the $100k key psychological level. Now that the Bull Cycle is entering its final stage (most likely for the next 6 months at most), it is time to see potential exit levels as close to the expected Top as possible.
There is no better long-term indicator to assist us on this than the 1M RSI, which historically offers a great level to Sell when it enters the 0.786 - 1.0 Fibonacci range of its Channel Down. Currently it is still considerably distanced from that Zone, so the upside potential despite the recent break-out, is huge.
The Sine Waves indicate that in symmetrical terms, the Cycle Top should be priced around November 2025 (previous ones on November 2021, December 2017, December 2013). The closer the 1M RSI is to this date when it enters the 0.786 - 1.0 Fib Zone, the better as the higher the price will most likely be.
Based on this Cycle's Channel Up (blue), a fair Cycle Top range would be $150k - $200k. Would you agree? Feel free to let us know in the comments section below!
-------------------------------------------------------------------------------
** Please LIKE 👍, FOLLOW ✅, SHARE 🙌 and COMMENT ✍ if you enjoy this idea! Also share your ideas and charts in the comments section below! This is best way to keep it relevant, support us, keep the content here free and allow the idea to reach as many people as possible. **
-------------------------------------------------------------------------------
💸💸💸💸💸💸
👇 👇 👇 👇 👇 👇

Bitcoin is Overbought, but $100,000 Target is Still at HandFenzoFx—Bitcoin is overbought at $97,000, a signal indicated by the Stochastic Oscillator. The price is expected to consolidate before the uptrend resumes. In this scenario, a dip toward $93,565 may provide a favorable entry point into the bull market.
Watch this level, followed by $91,720, for bullish signals such as candlestick patterns.
>>> Prop Trading
>>> No Deposit Bonus
>>> %100 Deposit Bonus
>>> Forex Analysis Contest
All at FenzoFx Decentralized Forex Broker

CAKEUSD Ahead of a monumental Triangle break-out.PancakeSwap (CAKEUSD) has been trading within a Triangle pattern since the December 04 2024 High and the price has been on the tightest squeeze possible since.
As you can see, it has been ranged for the past 2 weeks withing the 0.382 - 0.618 Fibonacci range and this is also reflected on the 1D RSI sequence.
If the price breaks above the top of the Triangle (Lower Highs trend-line), we expect a rally towards the 2.0 Fibonacci extension (5.3000). Alternatively, you may target on a safer note either Resistance 1 or the 1.618 Fib ext.
-------------------------------------------------------------------------------
** Please LIKE 👍, FOLLOW ✅, SHARE 🙌 and COMMENT ✍ if you enjoy this idea! Also share your ideas and charts in the comments section below! This is best way to keep it relevant, support us, keep the content here free and allow the idea to reach as many people as possible. **
-------------------------------------------------------------------------------
💸💸💸💸💸💸
👇 👇 👇 👇 👇 👇

BITCOIN Mirror fractal from the past calls for massive rally!Bitcoin (BTCUSD) appears to be repeating almost the exact same price action as mid-late 2020 as it has broken above the Pivot trend-line that separates the recent distribution from the 2nd Accumulation phase and has successfully re-tested it while the MA50 (blue trend-line) is holding as Support.
If the latter continues to hold, then it might fuel a massive rally similar to October 2020 - April 2021. As you can see both fractals started of with a 1st Accumulation Phase (blue Rectangle) being supported always by their respective MA200 (orange trend-line), which led to the eventual Distribution Phase (red Arc). Even their RSI sequences are identical.
Is this another pattern supporting that BTC will reach at least $150k next? Feel free to let us know in the comments section below!
-------------------------------------------------------------------------------
** Please LIKE 👍, FOLLOW ✅, SHARE 🙌 and COMMENT ✍ if you enjoy this idea! Also share your ideas and charts in the comments section below! This is best way to keep it relevant, support us, keep the content here free and allow the idea to reach as many people as possible. **
-------------------------------------------------------------------------------
💸💸💸💸💸💸
👇 👇 👇 👇 👇 👇

Litecoin Consolidates: Wait for This Before BuyingFenzoFx—Litecoin surged from $80.0 as anticipated. A candlestick pattern signaled this move yesterday morning. Although the bullish wave broke above the $91.9 resistance, the uptrend has since paused. Currently, the price trades slightly below this level, consolidating gains.
In swing trading, the key rule is to buy at the dip and sell at the high. Thus, we are not entering at this stage. Notably, the LTC/USD 1-hour chart shows a long-wick bearish candlestick, confirmed by another bearish close, with a decline in volume.
The trend stays bullish above the 50-period simple moving average. With immediate resistance at $93.65, the bearish momentum may test the previous day's high at $89.5. If this support holds, the uptrend could resume toward the $96.7 target.

BITCOIN Climbing the Fibonacci Staircase..Bitcoin (BTCUSD) has come into the Fed Rate Decision week stronger that ever, having staged an impressive rebound from the early-April Low. The consolidation of the last few days is of course a market reaction in anticipation of the big interest rate news.
Regardless of that, the Channel Up that is the underlying pattern from the start of this Bull Cycle has been filling on an impressive symmetrical scale all .382 Fibonacci extensions one by one. The most recent has been the 4.382 and naturally the next in line is the 5.382 Fibonacci extension.
Since the last one (4.382) was almost hit before the price pull-back, it would be more fitting to assume the next peak slightly below the 5.382 Fib ext as well as $170000.
This may very well be the final High i.e. the Cycle's Top before the next Bear Cycle begins, depending on the time it hits it.
Do you think that would be the case? Feel free to let us know in the comments section below!
-------------------------------------------------------------------------------
** Please LIKE 👍, FOLLOW ✅, SHARE 🙌 and COMMENT ✍ if you enjoy this idea! Also share your ideas and charts in the comments section below! This is best way to keep it relevant, support us, keep the content here free and allow the idea to reach as many people as possible. **
-------------------------------------------------------------------------------
💸💸💸💸💸💸
👇 👇 👇 👇 👇 👇

BITCOIN 1st 1W MACD Bullish Cross in 7 months!Bitcoin (BTCUSD) is ahead of completing this week a Bullish Cross on its 1W MACD, which will be the first one after 7 months (since October 14 2024).
This is a major technical bullish development as since the very first one (Sep 26 2022) right before the November 21 2022 Bear Cycle bottom, it has always kick-started the Bullish Legs of this 2.5-year Channel Up.
In addition to that, this was accompanied by an Ichimoku Bullish Cross, where the Conversion Line (green) crossed above the Base Line (black). Considering also that exactly 4 weeks ago BTC found Support and rebounded on the 1W MA50 (blue trend-line), we can safely confirm a Bottom there and call for the minimum +100.73% rise, similar to the first Bullish Leg of this Channel Up. We remain consistent to our $150000 Target.
So do you think this 1W MACD Bullish Cross is the final confirmation we need for the new Bullish Leg? Feel free to let us know in the comments section below!
-------------------------------------------------------------------------------
** Please LIKE 👍, FOLLOW ✅, SHARE 🙌 and COMMENT ✍ if you enjoy this idea! Also share your ideas and charts in the comments section below! This is best way to keep it relevant, support us, keep the content here free and allow the idea to reach as many people as possible. **
-------------------------------------------------------------------------------
💸💸💸💸💸💸
👇 👇 👇 👇 👇 👇

Ethereum is Nearing The Daily TrendHey Traders, in today's trading session we are monitoring ETH/USDT for a selling opportunity around 2,000 zone, Ethereum is trading a downtrend and currently is in a correction phase in which it is approaching the trend at 2,000 support and resistance area.
Trade safe, Joe.

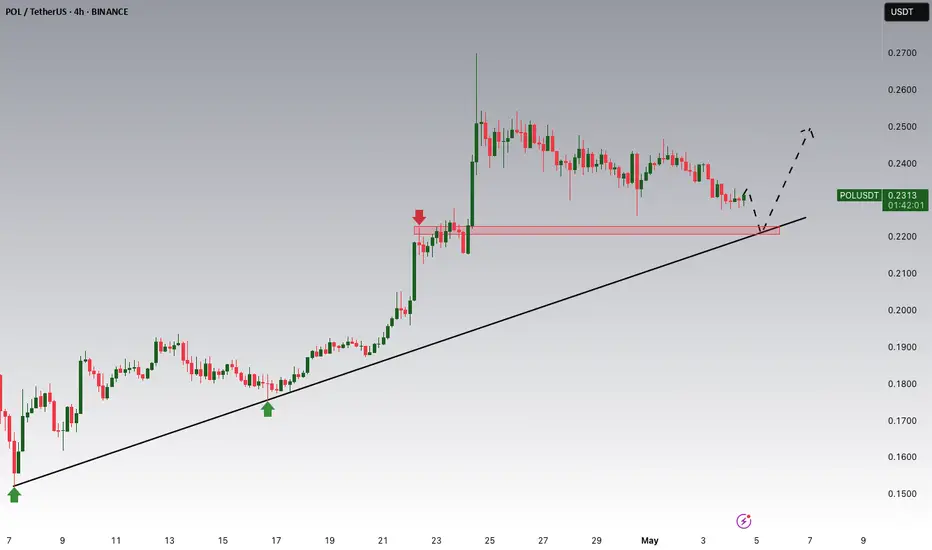
POLUSDT Potential UpsidesHey Traders, in today's trading session we are monitoring POLUSDT for a buying opportunity around 0.2220 zone, POLUSDT is trading in an uptrend and currently is in a correction phase in which it is approaching the trend at 0.2220 support and resistance area.
Trade safe, Joe.
INJUSDT Potential UpsidesHey Traders, in today's trading session we are monitoring INJUSDT for a buying opportunity around 9.50 zone, INJUSDT is trading in an uptrend and currently is in a correction phase in which it is approaching the trend at 9.50 support and resistance area.
Trade safe, Joe.

SUIUSDT Potential DownsidesHey Traders, in today's trading session we are monitoring SUI/USDT for a selling opportunity around 3.40 zone, SUI/USDT is trading in a downtrend and currently is in a correction phase in which it is approaching the trend at 3.40 support and resistance area.
Trade safe, Joe.

Bitcoin(BTC/USD) Daily Chart Analysis For Week of May 2, 2025Technical Analysis and Outlook:
Bitcoin prices have significantly exceeded our previously completed Interim Rally 95000, thereby positioning the cryptocurrency to aim for the forthcoming Interim Coin Rally marked at 100000. Nevertheless, current price movements indicate a potential retracement toward the Mean Support level at 94000, with a further possible decline likely toward an additional Mean Support target at 91800. It is imperative to recognize the potential for upward momentum to develop from a retest of either support level, as this could facilitate a trajectory toward the next Interim Coin Rally at $100,000 and beyond.

SUIUSD is consolidating ahead of massive Leg. Can it hit $9.500?Sui (SUIUSD) has completed Stage 1 of its recovery process following the April 07 bottom. That was a Higher Low on the 2-year Fibonacci Channel Up and having already broken above both the 1D MA50 (blue trend-line) and 1D MA200 (orange trend-line), the price is now consolidating.
This is fairly similar to what it did on September 20 2024, which was followed by a strong rise to the 1.0 Fib (previous High) where the price pulled-back to the 1D MA50. That was its final test before the peak forming rally just above the 1.5 Fibonacci extension.
As a result, we expect SUI to hit at least $9.500 on the long-term.
-------------------------------------------------------------------------------
** Please LIKE 👍, FOLLOW ✅, SHARE 🙌 and COMMENT ✍ if you enjoy this idea! Also share your ideas and charts in the comments section below! This is best way to keep it relevant, support us, keep the content here free and allow the idea to reach as many people as possible. **
-------------------------------------------------------------------------------
💸💸💸💸💸💸
👇 👇 👇 👇 👇 👇

BITCOIN is filling all gaps as it should.Bitcoin (BTCUSD) is having its strongest 1D green candle since April 22 (for now) and basically today's analysis is a continuation/ modification of our April 14 buy call (see chart below):
Our Target was $99500 but we now update it to $106000 as we see a different pattern through filling the Lower Highs gaps. As you can see, since BTC's April 07 bottom, the rebound has filled one Lower High of the downtrend after the other.
At the same time, it has posted identical rallies before consolidating, the 1st one +15.37% and the 2nd +15.11%. We are currently on the 3d and if it makes again +15.11%, then it gets us to $106.9k. That is marginally above the Lower High of January 30, practically the first Lower High after the January 20 All Time High (ATH).
Moreover, the 2.0 Fibonacci extension level is at $106k and this is why we've moved our short-term Target there. This fills all dynamic conditions of this uptrend.
Do you think that's a fair estimate? Feel free to let us know in the comments section below!
-------------------------------------------------------------------------------
** Please LIKE 👍, FOLLOW ✅, SHARE 🙌 and COMMENT ✍ if you enjoy this idea! Also share your ideas and charts in the comments section below! This is best way to keep it relevant, support us, keep the content here free and allow the idea to reach as many people as possible. **
-------------------------------------------------------------------------------
💸💸💸💸💸💸
👇 👇 👇 👇 👇 👇

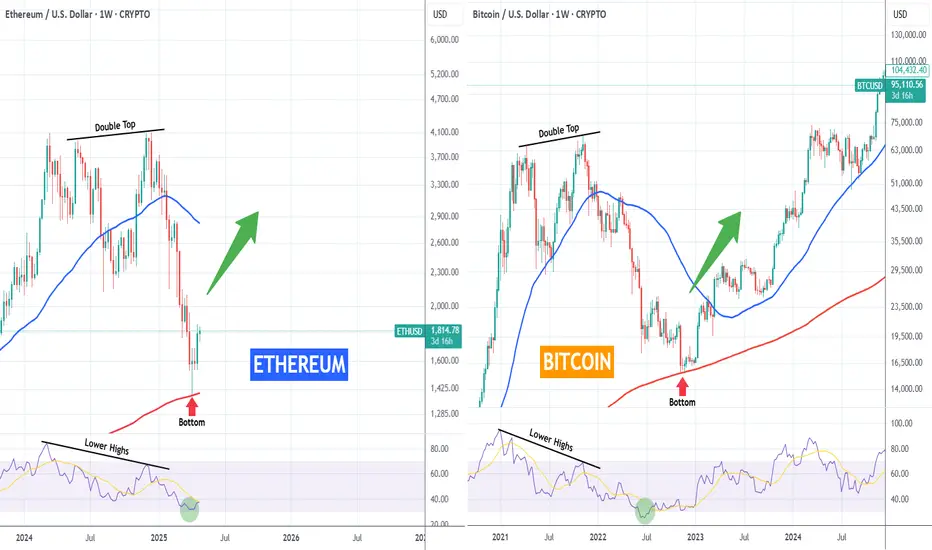
ETHEREUM vs BITCOIN fractals you'd never thought to look at!Odd comparison but you'd be lying if you say those fractals between Ethereum (ETHUSD) 2024 - 2025 and Bitcoin (BTCUSD) 2021 - 2022 don't look similar. But if you do believe it, can this mean ETH is about to see a rally to a new All Time High?
Anyway as the title says, this is fun fractal for comparison purposes only. The conclusion is yours!
-------------------------------------------------------------------------------
** Please LIKE 👍, FOLLOW ✅, SHARE 🙌 and COMMENT ✍ if you enjoy this idea! Also share your ideas and charts in the comments section below! This is best way to keep it relevant, support us, keep the content here free and allow the idea to reach as many people as possible. **
-------------------------------------------------------------------------------
💸💸💸💸💸💸
👇 👇 👇 👇 👇 👇
SOLANA's massive 1W MA200 rebound hints to enormous rally ahead.Solana (SOLUSD) made a very strong rebound on its 1W MA200 (orange trend-line) on the very first week of April. Now that the month is about to close, it has already completed three straight green 1W candles and is aiming for the critical 1W MA50 (blue trend-line) test.
If broken, we expect it to turn into a long-term Support again and target the Higher Highs of the Wedge at $350. After all, the 1W MA200 rebound also made contact on the 2-year Higher Lows trend-line of the Bull Cycle, so technically it is a massive Bottom cluster. The 1W RSI also broke above its MA last week, confirmed the buying pressure.
Given that the recent 3-month correction was -67.23%, identical to the last correction (May 2021) of the previous Cycle, we expect one final rally to the 2.0 Fibonacci extension at $900, if the Higher Highs trend-line breaks.
-------------------------------------------------------------------------------
** Please LIKE 👍, FOLLOW ✅, SHARE 🙌 and COMMENT ✍ if you enjoy this idea! Also share your ideas and charts in the comments section below! This is best way to keep it relevant, support us, keep the content here free and allow the idea to reach as many people as possible. **
-------------------------------------------------------------------------------
💸💸💸💸💸💸
👇 👇 👇 👇 👇 👇

BITCOIN This is where the real BULL started in 2017.We've mentioned on numerous occasions how Bitcoin's (BTCUSD) current Cycle resembles that of 2014 - 2017 and this evidence is self-explanatory on the chart. What we want to bring forward today, and the timing couldn't be better, is that symmetrically speaking, it was the exact same time of the year (April 2017) when the past Cycle started printing predominantly green candles that lasted until the very end of 2017 (December) and the Cycle Top.
The 3W RSI sequences are identical among the two fractals with a Pivot trend-line dominating both Cycles, first as a Resistance (red arrows) and then turned into Support (green arrows). Before the end-of-year Parabolic Rally, the Bull Cycle was classified into 3 pull-back/ consolidation Phases (blue Rectangles) and, no surprise, the mini rallies started around the same times.
Can this indicate that we are about to see a strong rally of predominantly green candles towards the end of the year to form the new Cycle High? What do you think?
Feel free to let us know in the comments section below!
-------------------------------------------------------------------------------
** Please LIKE 👍, FOLLOW ✅, SHARE 🙌 and COMMENT ✍ if you enjoy this idea! Also share your ideas and charts in the comments section below! This is best way to keep it relevant, support us, keep the content here free and allow the idea to reach as many people as possible. **
-------------------------------------------------------------------------------
💸💸💸💸💸💸
👇 👇 👇 👇 👇 👇
