BITCOIN The Ultimate Cycle Model calls for $160k!Bitcoin (BTCUSD) is rebounding following yesterday's Fed Rate Decision. Technically the rebound has already started 10 days ago after the market nearly bottomed on the 1W MA50 (red trend-line). This is the strongest long-term Support level, as it is where BTC priced Lows and rebounded on August 05 2024 and September 11 2023, but it is not the only one.
With the current 2023 - 2025 Bull Cycle pattern being a Channel Up, this is the absolute and ultimate model that has been guiding the price action and can help estimate any future moves. Given that, it's also the 0.382 Fibonacci retracement level that supported both Lows (as well as the current one) on the 1W MA50 mentioned above. As a result, we are so far on a double Support cluster.
The 1W RSI comes in as the 3rd Support, as it hit and is rebounding now on its 2-year Support level, where the bounces of September 07 2024 and September 11 2023 happened. It is also important to mention that the Channel Up can be divided into two phases, Phase 1 (green Channel Up), which traded within the 0.0 - 1.0 Fibonacci range and Phase 2 (blue Channel Up), which trades within the 0.5 - 1.5 Fibonacci range.
The symmetry within those patterns are so high that the two Bullish Legs of Phase one have both rallied by +100.64%. If Phase 2 follows the same dynamic, and there is no reason to assume it won't as the Bearish Legs have been almost identical, we can assume that the Bullish Leg that has just started will rise by +121.48%, same as the previous one (Aug - Dec 2024). That gives us a Target estimate of $160000.
So do you think that BTC has bottomed on this Triple Support Cluster and if so, can it reach $160k by the end of this Cycle? Feel free to let us know in the comments section below!
-------------------------------------------------------------------------------
** Please LIKE 👍, FOLLOW ✅, SHARE 🙌 and COMMENT ✍ if you enjoy this idea! Also share your ideas and charts in the comments section below! This is best way to keep it relevant, support us, keep the content here free and allow the idea to reach as many people as possible. **
-------------------------------------------------------------------------------
💸💸💸💸💸💸
👇 👇 👇 👇 👇 👇
Cryptocurrencies

ETHEREUM Megaphone bottom like March 2020Ethereum (ETHUSD) is currently on the first week of rebound after 3 straight red weeks when it was unable to break above the 1W MA50 (blue trend-line). This is taking place on a Lower Lows trend-line, technically the bottom of a 1-year Megaphone since the March 11 2024 High.
The market is no stranger to long-term Megaphone consolidation periods like that as last time we saw this was on the June 2019 - March 2020 Megaphone, which eventually broke upwards after the brutal COVID crash Bearish Leg that touched bottom. This is quite similar to the current Bearish since late December. Notice how perfectly aligned the Fibonacci retracement levels are.
Based on this, we expect at least a 1.5 Fibonacci extension test at $6000 before this Cycle tops at the end of the year.
-------------------------------------------------------------------------------
** Please LIKE 👍, FOLLOW ✅, SHARE 🙌 and COMMENT ✍ if you enjoy this idea! Also share your ideas and charts in the comments section below! This is best way to keep it relevant, support us, keep the content here free and allow the idea to reach as many people as possible. **
-------------------------------------------------------------------------------
💸💸💸💸💸💸
👇 👇 👇 👇 👇 👇

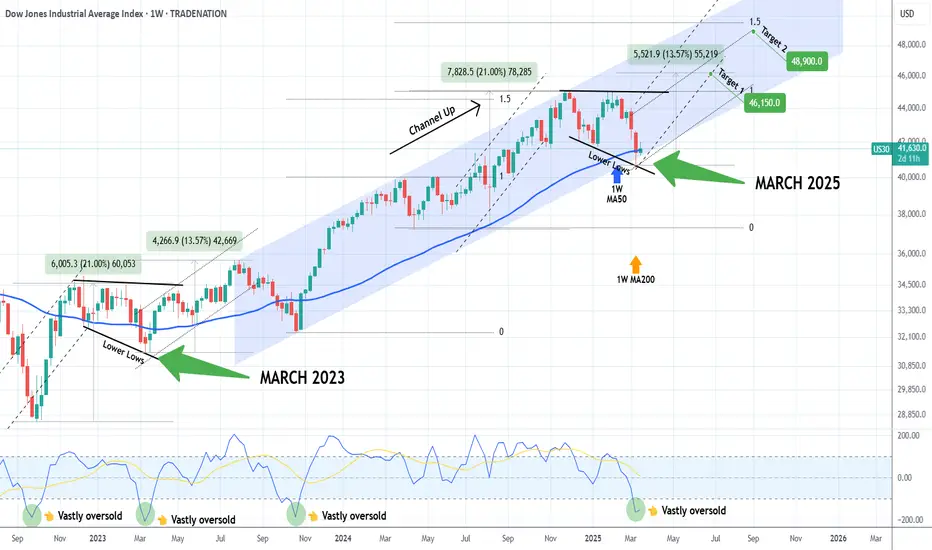
DOW JONES This is why chances of a brutal rebound are so high.Dow Jones (DJIA) has been trading within a Channel Up since the July 31 2023 High and last week it hit (marginally breached) its 1W MA50 (blue trend-line) for the first time since the week of October 30 2023. The price went on to test the bottom of the Channel Up and rebounded back above the 1W MA50.
This is an incredibly strong long-term bullish signal and it is not the only one. The market also made a Lower Low rebound on the 3-month trend-line while the 1W CCI got oversold below -150.00 and is rebounding. The last time we got these conditions fulfilled was exactly 2 years ago on the March 13 2023 Low.
That was when the index made a similar Megaphone Lower Low rebound on oversold 1W CCI that initiated a +13.57% rally. Both Megaphone fractals emerged after Dow rose by +21.00%.
In fact, every oversold 1W CCI rebound has produced very aggressive rallies. Based on those similarities with the March 2023 fractal, we expect the index to hit 46150 (+13.57%) minimum by July. If the more aggressive scenario of the November 25 2024 rally that made a Channel Up Higher High on the 1.5 Fibonacci extension prevails, then our more optimistic scenario is 48900 (Target 2) by September, which could technically be the end/ Top of the current Bull Cycle.
-------------------------------------------------------------------------------
** Please LIKE 👍, FOLLOW ✅, SHARE 🙌 and COMMENT ✍ if you enjoy this idea! Also share your ideas and charts in the comments section below! This is best way to keep it relevant, support us, keep the content here free and allow the idea to reach as many people as possible. **
-------------------------------------------------------------------------------
Disclosure: I am part of Trade Nation's Influencer program and receive a monthly fee for using their TradingView charts in my analysis.
💸💸💸💸💸💸
👇 👇 👇 👇 👇 👇
BITCOIN The 2021 Pivot trend-line that is coming to its rescue.Bitcoin (BTCUSD) has stayed stable after last week's rebound on the 1W MA50 (blue trend-line), which has been the level that offered support on the Bull Cycle Channel's previous Higher Low (August 05 2024).
Technically however, that is not the only major Support level that may be coming to BTC's rescue as we've identified the Pivot trend-line that started on the April 12 2021 High as a Resistance and since then made another 2 contacts (as rejections). This is the first time now that is being tested as Support.
During the previous Cycle (2018 - 2021) a similar Pivot trend-line was the level that supported Bitcoin during the last year of its parabolic rally on January and June 2021. The June 2021 contact in particular tested the 1W MA50 as well, which is the exact situation we're in right now. That double support hold initiated the final rebound towards the Cycle's new All Time High (ATH).
Check also how similar the 1W CCI patterns between the two fractals are and based on that, a 1W CCI reading at 200.00 would be a solid level to sell and take profit. As a result, we expect this Cycle's Channel Up to accelerate the current rebound, technically its Bullish Leg and make a new ATH, which would be the Cycle's new Top, ideally with a CCI at 200.00.
So do you think this cyclical Pivot trend-line is coming along with the 1W MA50 to BTC's rescue? Feel free to let us know in the comments section below!
-------------------------------------------------------------------------------
** Please LIKE 👍, FOLLOW ✅, SHARE 🙌 and COMMENT ✍ if you enjoy this idea! Also share your ideas and charts in the comments section below! This is best way to keep it relevant, support us, keep the content here free and allow the idea to reach as many people as possible. **
-------------------------------------------------------------------------------
💸💸💸💸💸💸
👇 👇 👇 👇 👇 👇

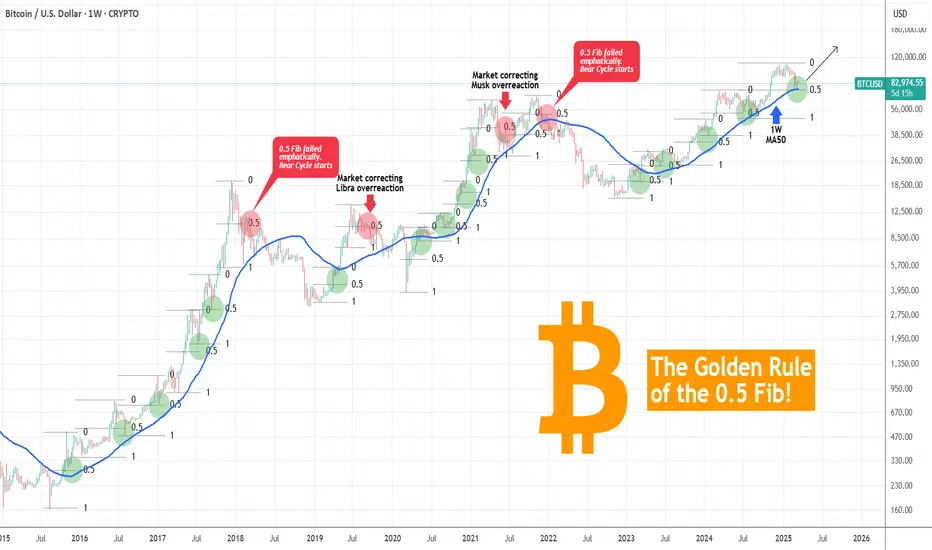
BITCOIN The 0.5 Fib Golden Rule! This is not a Bear Market yet!Bitcoin (BTCUSD) shook the bullish market sentiment last month, as late February saw it drop aggressively not just from the 109k All Time High (ATH) but also below the key psychological Support of $90000. We have discussed already how the 1W MA50 (blue trend-line) coming to its rescue, is the critical Support and rightfully so, but there is also another critical condition that is currently showing incredible strength, keeping BTC into Bull Cycle territory (for now).
That is the 0.5 Fibonacci retracement level Golden Rule. This suggests that BTC's corrections/ pull-backs up to the 0.5 Fib level are technical and perfectly systemic, especially with the 1W MA50 supporting. If anything, such pull-backs during a Bull Cycle are the most optimal buy opportunities. We are currently on an exact such opportunity as the price hit last week both the 1W MA50 and the 0.5 Fib.
In the past 10 years since the August 2015 Bear Cycle bottom, every correction up to the 0.5 Fib was a buy. In the 4 cases it broke, 2 were the signals of the 2018 and 2022 Bear Cycles and the other 2 signals of the market correcting the bullish overreaction to the Libra (2019) and Musk (2021) rallies. The latter though was still contained above the 1W MA50 and so would the 2019 one if it wasn't for the March 2020 COVID crash.
As a result, we still see no cause for concern (yet) and so far this is the best buy opportunity for Bitcoin since last year and the August 05 2024 Low.
But what do you think? Is this 0.5 Fib Golden Rule coming to push Bitcoin higher to its next ATH? Feel free to let us know in the comments section below!
-------------------------------------------------------------------------------
** Please LIKE 👍, FOLLOW ✅, SHARE 🙌 and COMMENT ✍ if you enjoy this idea! Also share your ideas and charts in the comments section below! This is best way to keep it relevant, support us, keep the content here free and allow the idea to reach as many people as possible. **
-------------------------------------------------------------------------------
💸💸💸💸💸💸
👇 👇 👇 👇 👇 👇
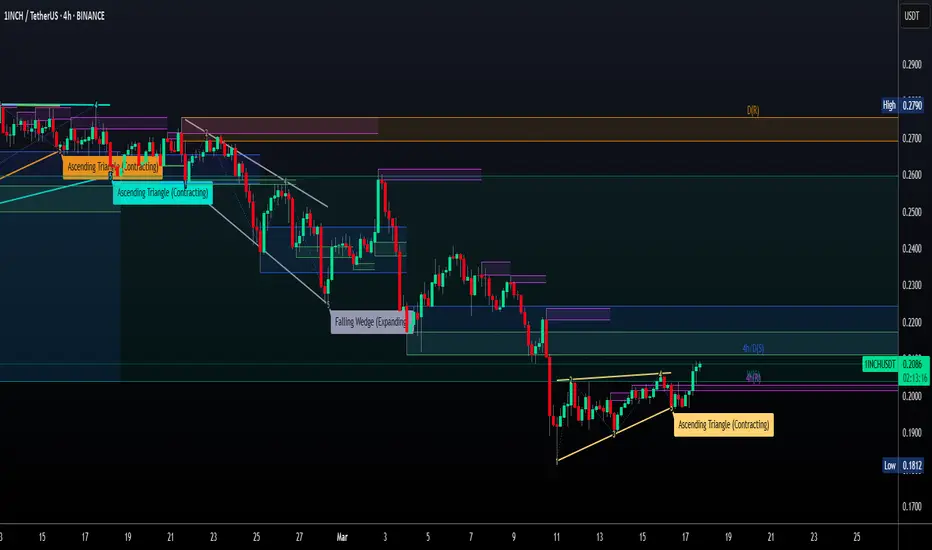
1INCHUSDT: The Invisible Forces Driving Price Right Now - 1inch◳◱ Ever seen the Bollinger Band Breakout Super Trend on a chart? It's exciting to watch! With the price hovering around 0.2093, there's potential for a breakout above 0.2203 | 0.2433 | 0.2859. Support at 0.1777 | 0.1581 | 0.1155 provides confidence for bulls.
◰◲ General Information :
▣ Name: 1inch
▣ Rank: 199
▣ Exchanges: Binance, Kucoin, Huobipro, Gateio, Mexc, Hitbtc
▣ Category / Sector: Financial - Decentralized Exchanges
▣ Overview: The 1inch Network unites three separate decentralized protocols, aggregating liquidity from a variety of decentralized exchanges to facilitate cost-efficient transactions.
Its native token, the 1inch token (1INCH) serves two primary purposes: As a governance token granting voting rights towards the 1inch DAO and as a utility token, where it is used as a connector to achieve high-efficiency routing in the 1inch Liquidity Protocol. It will also be used in the tokenomics of all future protocols developed by the 1inch Network.
◰◲ Technical Metrics :
▣ Current Price: 0.2093 ₮
▣ 24H Volume: 3,767,156.011 ₮
▣ 24H Change: 3.358%
▣ Weekly Change: 4.06%%
▣ Monthly Change: -21.88%%
▣ Quarterly Change: -56.72%%
◲◰ Pivot Points :
▣ Resistance Level: 0.2203 | 0.2433 | 0.2859
▣ Support Level: 0.1777 | 0.1581 | 0.1155
◱◳ Indicator Recommendations :
▣ Oscillators: NEUTRAL
▣ Moving Averages: BUY
◰◲ Summary of Technical Indicators : BUY
◲◰ Sharpe Ratios :
▣ Last 30 Days: -3.94
▣ Last 90 Days: -4.16
▣ Last Year: -0.69
▣ Last 3 Years: -0.39
◲◰ Volatility Analysis :
▣ Last 30 Days: 0.79
▣ Last 90 Days: 0.78
▣ Last Year: 0.93
▣ Last 3 Years: 0.87
◳◰ Market Sentiment :
▣ News Sentiment: N/A
▣ Twitter Sentiment: 0.53 - Bullish
▣ Reddit Sentiment: 0.60 - Bullish
▣ In-depth BINANCE:1INCHUSDT analysis available at TradingView TA Page
▣ Your thoughts matter! What do you think of this analysis? Share your insights in the comments below. Your like, follow, and support are greatly valued and help sustain high-quality content.
◲ Disclaimer : Disclaimer
The content provided is for informational purposes only and does not constitute financial, investment, or trading advice. Always conduct your own research and consult a qualified professional before making any financial decisions. Use of the information is solely at your own risk.
▣ Explore the Power of Charting with TradingView
Unlock a wide range of financial analysis tools, data, and features to elevate your trading experience. Take a tour and see the possibilities. If you decide to upgrade your plan, you can receive up to $30 back. Discover more here - affiliate link -
Quantum Doom for Bitcoin?Bitcoin, the leading cryptocurrency known for its promise of a decentralized structure, faces an existential crisis due to advances in quantum computing that threaten its cryptographic foundation. The article "Bitcoin's Imminent Collapse: The Quantum Threat and Cryptographic Vulnerabilities" outlines a convergence of risks – technological breakthroughs, government influence, and market dynamics – that could potentially bring Bitcoin's value to zero.
At the heart of the danger lies the SHA-256 algorithm, which secures the Bitcoin blockchain. Quantum computers, such as those from D-Wave, which claimed to have achieved "quantum supremacy" in 2025, may soon be able to reverse the hashing operation, revealing private keys and destabilizing the entire network. This potential breach, known as "Q-Day," could severely damage trust in Bitcoin and lead to a mass exodus of investors.
The forecast becomes even more alarming given the mysterious origin of SHA-256, developed by the NSA (U.S. National Security Agency) and standardized by the National Institute of Standards and Technology (NIST). The article raises disturbing questions about the possibility that the NSA possesses unknown vulnerabilities or "backdoors" within the algorithm. Past seizures of Bitcoin by the U.S. government, such as the recovery of a hacker's wallet in 2021, suggest an extraordinary ability to bypass its security – perhaps through undisclosed inside knowledge.
Meanwhile, NIST's push for post-quantum cryptography (PQC) hints at the impending obsolescence of SHA-256, but Bitcoin's failure to adopt these alternatives critically exposes it. This lack of preparedness increases the risk, as rivals with quantum computers could act before defenses are strengthened.
Market signals add another layer of concern. The approval of Bitcoin ETFs in 2023 by financial giants like BlackRock and Vanguard suggests a strategic move where institutional players offload risks onto less experienced retail investors. Combined with repeated government seizures that cast doubt on Bitcoin's anonymity, a scenario is emerging where the cryptocurrency stands on the brink.
The conclusion is that Bitcoin's vision of decentralization may not survive this perfect storm – a quantum threat, cryptographic weaknesses, and orchestrated market shifts. For stakeholders, the message is clear: adapt quickly or risk potential collapse.

BITCOIN Is this the 'most normal' Cycle of them all ??This is not the first time we use a Convergence/ Divergence approach to Bitcoin (BTCUSD) Cycles and certainly not the last one. On the previous one, it helped us to succesffuly predict the end of 2022 bottom but what we couldn't anticipate is how smooth the new/ current Cycle 5 (orange trend-line) would be.
As the title says, this is probably the 'most normal' Cycle of them all, as BTC has been trading within a Channel Up (orange) since the Bear Cycle's bottom more than 2 years ago.
To get a better understanding of this claim, we compare Bitcoin's (BTCUSD) Cycles from their previous top to the next one (with the exception of the first), on this complete mapping analysis, having them all displayed on top of another: Cycle 1 (green trend-line), Cycle 2 (red), Cycle 3 (blue), Cycle 4 (black) and the current one Cycle 5 (orange).
** Diminishing Returns **
As you see, first of all, this showcases the Theory of Diminishing Returns, which suggests that as the market grows and higher adoption is achieved, BTC will show less and less returns in each Cycle. Every Cycle Top has been lower from the previous one.
** Cycle Convergence - Divergence **
Secondly, all Cycles particularly during their Bear Phase and for a short time after, tend to follow a common path. The illustration on this analysis is very clear as it starts with each Cycle's Bear Phase and you can see that when they diverge, they converge again quickly. The most recent Bear Phase was not surprisingly as long as Cycle 4 and almost Cycle 3, which was to be expected as the market has shown an amazing degree of symmetry in the past 10 years. Note that this is also the model that helped as determine very early in 2023 that Cycle 3 would be the best fit for the new Cycle in terms of price action and without a doubt, BTC has been mostly replicating that Cycle.
** What's next for the current Cycle? **
If we compare the current Cycle (5) with Cycle 3 we can see that the Convergence - Divergence Model is holding. So far when Cycle 5 converged, it immediately diverged. And this is exactly what it has been doing since the December High and the marginal January All Time High (ATH). It has started to diverge significantly from Cycle 3 so what the recent pull-back to the 1W MA50 achieved is to normalize it and is about to touch it.
Now that the price hit the bottom of its +2 year Channel Up, we expect to rise, which will achieved convergence and contact with both Cycles 3 and 4, which is what they both did in their last 150 days of their respective Bull Cycles. Technically, this can take Cycle 5 to around $150k.
As we've first mentioned in the crypto space, regarding the last Bear Market being the 'smoothest' in history, we can securely say now that the current Bull Cycle is also the 'most normal' ever.
So what do you think? Does this Cycle regression model offer any useful conclusion as to where Bitcoin might top and if so, is this Cycle indeed the 'most normal' in the history? Feel free to let us know in the comments section below!
-------------------------------------------------------------------------------
** Please LIKE 👍, FOLLOW ✅, SHARE 🙌 and COMMENT ✍ if you enjoy this idea! Also share your ideas and charts in the comments section below! This is best way to keep it relevant, support us, keep the content here free and allow the idea to reach as many people as possible. **
-------------------------------------------------------------------------------
💸💸💸💸💸💸
👇 👇 👇 👇 👇 👇

Ethereum Potential DownsidesHey Traders, in today's trading session we are monitoring ETHUSDT for a selling opportunity around 1929 zone, Ethereum is trading in a downtrend and currently is in a correction phase in which it is approaching the trend at 1929 support and resistance area.
Trade safe, Joe.

Bitcoin Is Under Bearish PressureHey Traders, in today's trading session we are monitoring BTCUSDT for a selling opportunity around 86k zone, Bitcoin is trading in a downtrend and currently is in a correction phase in which it is approaching the trend at 86k support and resistance area.
Trade safe, Joe.

SOLUSD Potential UpsidesHey Traders, in today's trading session we are monitoring SOLUSD for a buying opportunity around 123 zone, SOLUSD is trading in an uptrend and currently is in a correction phase in which it is approaching the trend at 123 support and resistance area.
Trade safe, Joe.

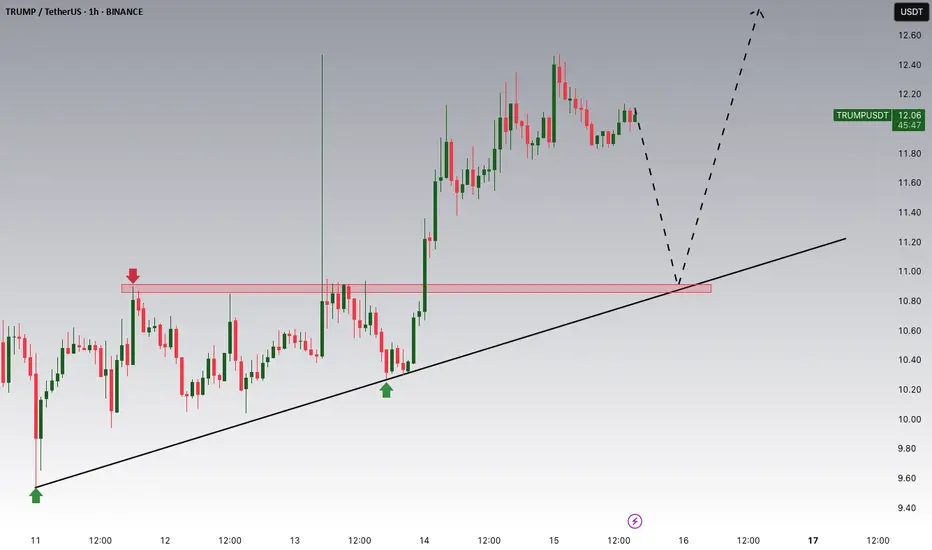
TRUMP Is Trying To SpikeHey Traders, in today's trading session we are monitoring TRUMPUSDT for a buying opportunity around 11 zone, Trump is trading in an uptrend and currently is in a correction phase in which it is approaching the trend at 11 support and resistance area.
Trade safe, Joe.
Ethereum: Strong Bearish TrendHey Traders, in today's trading session we are monitoring ETHUSDT for a selling opportunity around 2000 zone, Ethereum is trading in a downtrend and currently is in a correction phase in which it is approaching the trend at 2000 support and resistance area.
Trade safe, Joe.

Ripple is Nearing Important SupportHey Traders, in today's trading session we are monitoring XRPUSDT for a buying opportunity around 2.35 zone, XRP is trading in an uptrend and currently is in a correction phase in which it is approaching the trend at 2.35 support and resistance area.
Trade safe, Joe.

SOLANA; Heikin Ashi Trade IdeaBINANCE:SOLUSD
In this video, I’ll be sharing my analysis of SOLUSD, using my unique Heikin Ashi strategy. I’ll walk you through the reasoning behind my trade setup and highlight key areas where I’m anticipating potential opportunities.
I’m always happy to receive any feedback.
Like, share and comment! ❤️
Thank you for watching my videos! 🙏

Bitcoin: 84k is an Important Level.Hey Traders. in today's trading session we are monitoring BTCUSDT for a selling opportunity around 84,000 zone, Bitcoin is trading in a downtrend and currently is in a correction phase in which it is approaching the trend at 84,000 support and resistance area.
Trade safe, Joe.

BITCOIN Is this a Falling Wedge bottom formation?Bitcoin (BTCUSD) is trading since the February 28 Low within a Falling Wedge pattern, below the 1D MA50 (blue trend-line) and at the same time supported by the 1W MA50 (red trend-line).
Throughout its dominant Bull Cycle pattern, the +2 year Channel Up, it has formed another 6 such Falling Wedges, all below the 1D MA50 and all turned out to be market bottom formations, which paved the way for an immediate bullish break-out. On all occasions, the 1D CCI has been almost as low as on the February Low.
The shortest rebound it made before another break below the 1D MA50, was +26.68% and the highest was +106.96%. As a result this gives us a minimum immediate potential Target of $96800 and a maximum of a little more than $150000. Given that the price has touched the bottom of the long-term Channel Up, like the bottom formations of September 06 2024 and September 11 2023, it is quite likely to see the stronger rebound probability taking place.
But what do you think would be the case? Is this a classical Falling Wedge bottom break-out formation and if so what may be the Target? Feel free to let us know in the comments section below!
-------------------------------------------------------------------------------
** Please LIKE 👍, FOLLOW ✅, SHARE 🙌 and COMMENT ✍ if you enjoy this idea! Also share your ideas and charts in the comments section below! This is best way to keep it relevant, support us, keep the content here free and allow the idea to reach as many people as possible. **
-------------------------------------------------------------------------------
💸💸💸💸💸💸
👇 👇 👇 👇 👇 👇

Learn To Invest: Global Liquidity Index & BitcoinGlobal Liquidity Index & BitCoin:
🚀 Positive Vibes for Your Financial Journey! 🚀
BITSTAMP:BTCUSD
Look at this chart! It's the Global Liquidity Index , a measure of how much extra money is flowing through the world's financial systems.
Why is this important? Because when this index is high, it often means good things for investments like #Bitcoin! 📈
Think of it like this: when there's more money flowing, people are often more willing to take risks and invest in things like Bitcoin.
See those "BullRun" boxes? That means things are looking bright! It's showing that money is flowing, and that's often a good sign for potential Bitcoin growth. 🌟
Even if you're not a pro, it's easy to see the good news here. Understanding these trends can help you make smarter decisions.
Let's all aim for growth and success! 💪

BITCOIN Money Supply, Dollar and Bonds pushing for MEGA RALLY!This is not the first time we publish a Bitcoin (BTCUSD) analysis in relation to the U.S. Dollar Index (green trend-line) or Chinese Bonds (red trend-line) and Global Liquidity (blue trend-line). In fact we have been doing this since the late 2022 bands in China and like the highly bearish sentiment that was in the market then, we decided to dive into this cross-asset analysis yet again in order to put the current sentiment in perspective.
Well it couldn't be more relevant. What we discovered is that all the financial assets mentioned above have yet again aligned to offer the strongest bullish confirmation for BTC since the November 2022 Bear Cycle bottom!
More specifically, we are a little past the point where the DXY peaks and declines aggressively, Global Liquidity bottoms and starts rising, while Chinese bonds (our CN02Y/CN20Y ratio) bottom and rise aggressively. In the past 10 years this combination of events has happened 6 times, 2 times during each Cycle: one at the bottom of the Cycle and the other when the final, most aggressive rally starts.
Notice also that (naturally) this is where the stock market (SPX, black trend-line) also bottoms and starts rising aggressively.
As a result, the above market conditions are an indication that despite the recent monthly correction and turbulence due to a number geopolitical and other trade fundamental reasons, the macro-economic parameters remain intact for the wider picture of this Cycle. Truthfully, this is where an announcement next week of future Fed Rate Cuts would come very handy.
So what do you think of this analysis above? Are you fearful that a new Bear Cycle is starting or more confident that the market will soon recover and price a new High? Feel free to let us know in the comments section below!
-------------------------------------------------------------------------------
** Please LIKE 👍, FOLLOW ✅, SHARE 🙌 and COMMENT ✍ if you enjoy this idea! Also share your ideas and charts in the comments section below! This is best way to keep it relevant, support us, keep the content here free and allow the idea to reach as many people as possible. **
-------------------------------------------------------------------------------
💸💸💸💸💸💸
👇 👇 👇 👇 👇 👇

BITCOIN Cycle pattern completed. Year-end Target locked at $150kBitcoin (BTCUSD) is showing the first signs of life after nearly testing the 1W MA50 (blue trend-line) early this week. Whether this leads to a full on recovery or not, can been partially answered by this Cycle's price action so far.
Historically we do know that BTC's Bull Cycles so far tend to peak towards the end of their 3rd year and that's 2025. This Cycle has been predominantly trading within a Fibonacci Channel Up, since its very start, the November 2022 bottom. Its 1W MA50 has been supporting since the March 13 2023 break-out, so it's been exactly 2 years of holding and throughout this time period has provided two excellent buy opportunities.
As you can see, the Channel Up can be classified into two main Phases so far: each has a Primary correction (red) of more than -30% drop, followed by a rally (blue), then a Secondary correction (yellow) of more than -20%, followed by the second and last rally (blue). All rallies have so far been around +100%. Based on this model, we are now on the Secondary correction of Phase 2.
Notice that all corrections (either primary or secondary) hit or approached apart from the 1W MA50, the 0.382 Fibonacci retracement level from their previous Low. This is actually the first time that the price has marginally broken below the 0.382 Fib. At the same time, the 1D RSI almost got oversold last week (34.50) and according to the August 05 2024 (Higher) Low, this is were a series of RSI Higher Lows would be a signal of a new bottom formation.
The bottom and recovery process may take a while though, another 4-6 weeks. According to the Time Fibs (blue dashed vertical lines), each correction (whether primary or secondary) has ended at or a little before the 1.0 Fib with the 0.0 being the bottom of the previous one and 0.5 Fib the Top of the rally. Based on this, we can expect the new rally to start by the week of April 28 the latest.
So now as to how high this can get, if it repeats the 'weakest' rally of the Channel's three so far, it should rise by +95.95%, which gives us a straight price of $150000 as a Target. If the rally symmetry also holds, this should come by late September, perfectly aligning with Bitcoin's historic Cycle expectation for the final year.
Do you think that will be the case? Recovery starting within 4-6 weeks and if so, are you expecting $150k? Feel free to let us know in the comments section below!
-------------------------------------------------------------------------------
** Please LIKE 👍, FOLLOW ✅, SHARE 🙌 and COMMENT ✍ if you enjoy this idea! Also share your ideas and charts in the comments section below! This is best way to keep it relevant, support us, keep the content here free and allow the idea to reach as many people as possible. **
-------------------------------------------------------------------------------
💸💸💸💸💸💸
👇 👇 👇 👇 👇 👇

TRXUSD Another 2 months of consolidation is possible.Last time we looked at TRON (TRXUSD) was almost 6 months ago (September 25 2024, see chart below) when we called for a 1D MA50 (blue trend-line) buy:
The immediate rally that followed, hit our 0.2100 Target in less than 2 months, even breaking above the long-term Channel Up. Since then, the Bullish Leg deflated and settled sideways on a trade within the 1D MA50 (blue trend-line) and 1D MA200 (orange trend-line).
This is an Accumulation Phase and on the current 2023 - 2025 Bull Cycle, it is not the first time we've seen one. In fact the Higher Lows Zone had such phases since its start but the most notable and most similar to the current one is the one between March - August 2024.
Always supported by the 1W MA50 (red trend-line), this Accumulation Phase displayed the same kind of 1D MACD Bullish Divergence and once it formed its first Higher Highs trend-line and rebounded on the 1D MA200, it entered the Parabolic Rally Phase.
If the symmetry holds, then we might see TRX hit 0.6000 by September 2025.
-------------------------------------------------------------------------------
** Please LIKE 👍, FOLLOW ✅, SHARE 🙌 and COMMENT ✍ if you enjoy this idea! Also share your ideas and charts in the comments section below! This is best way to keep it relevant, support us, keep the content here free and allow the idea to reach as many people as possible. **
-------------------------------------------------------------------------------
💸💸💸💸💸💸
👇 👇 👇 👇 👇 👇

BITCOIN Is this the last defense before the narrative changes?Bitcoin (BTCUSD) got yet again increasingly volatile during the weekend and is approaching the 1W MA50 (blue trend-line). As mentioned on the title, this is "the last defense" for BTC as so far this price action hasn't diverged a bit from the Channel Up of the 2015 - 2017 Bull Cycle but a break and 1W candle close below it, would jeopardize that.
** The key 1W MA50 **
In fact the only times that Bitcoin closed below its 1W MA50 during a Bull Cycle and the Cycle continued was of course during the March 2020 COVID global market flash crash and November 18 2019. But the current Bull Cycle is nothing like in 2019 - 2021, it doesn't have the initial overextension of the Libra hype (May - June 2019) or Elon's early 2020 hype nor of course the pandemic shutdown. On the contrary it is incredibly similar with 2015 - 2017 with the only difference being that, thanks to the ETF launch in January 2024, the market marginally breached the previous All Time High (ATH) earlier.
** Symmetry playing out **
So back to the similarities between those two Cycles. The Cycle count indicates that we are at the end of the (blue) Bull Rectangle in March 2017 (847 days) when the price almost tested the 1W MA50 and then started the (green) Parabolic Phase to new ATHs (217 days). Even in terms of 1W RSI and MACD, the two fractals are similar, with the RSI being on its 2nd 'Buy the dip Volatility Phase' bottom and the MACD on its 2nd Bullish Cross.
** How high can it get? **
Now as to how high the new Cycle Top can be, can be anybody's guess, but if it repeats the less aggressive 2021 Top, it could be on the 1.618 Fibonacci extension, i.e. around $170k, while if it repeats the (much more unrealistic for such short period of time in terms of market cap) 2017 Top, it could be on the 2.382 Fib ext, i.e. around $520k. The worst case scenario is to have Fib extension Tops on a decreasing rate, in which case the 1.5 - 1.382 levels are next, giving us a potential target range of 120k - 145k, which would be almost a Double Top similar to November 2021.
So what do you think? Will the 1W MA50 come to Bitcoin's rescue yet again or the narrative will change this time? Feel free to let us know in the comments section below!
-------------------------------------------------------------------------------
** Please LIKE 👍, FOLLOW ✅, SHARE 🙌 and COMMENT ✍ if you enjoy this idea! Also share your ideas and charts in the comments section below! This is best way to keep it relevant, support us, keep the content here free and allow the idea to reach as many people as possible. **
-------------------------------------------------------------------------------
💸💸💸💸💸💸
👇 👇 👇 👇 👇 👇

Bitcoin(BTC/USD) Daily Chart Analysis For Week of March 7, 2025Technical Analysis and Outlook:
In the trading session for this week, we observed significant volatility characterized by considerable fluctuations, ultimately culminating in the completion of the coin Interim Coin Rally 94500. The coin experienced a substantial increase, reaching our Mean Resistance level of 92600, before encountering a steep pullback that resulted in its stabilization at the starting point of Mean Support of 84700.
This upward fluctuation indicates a potential for higher prices and suggests a likelihood of retesting the target Mean Resistance levels at 90600, coinciding with the conclusion of Interim Coin Rally 94500. Nonetheless, a retest of the Key Support level at 79000 and the completed of the Outer Coin Dip 78700 may occur prior to any further upward momentum.
