Pairing between BTC & Global Liquidity IndexSup everyone,
if you're active on twitter or have been looking around for crypto trade ideas you might have stumbled upon the Global Liquidity Index chart (at least I have).
I've stumbled upon it a few months back and have been testing it ever since, let me tell you what this chart is about:
The Global Liquidity Index basically measures how much money is flowing through global markets—think of it like the pulse of the financial system... traders and investors use it to get a sense of overall market conditions, liquidity availability, and risk appetite.
Now, here’s the cool thing: when you layer the Global Liquidity Index onto the Bitcoin chart, you notice something interesting— BITSTAMP:BTCUSD tends to react, but with a delay. Typically, there's about a 2-3 month lag. If global liquidity spikes or makes a sharp V-shaped recovery, Bitcoin usually mirrors this movement roughly 80 days later.
Why does this happen? Well, Bitcoin is a highly speculative asset, and institutions—especially banks—often wait to see solid liquidity signals before moving their capital into riskier assets like crypto. They prefer confirmation over speculation, which explains the delay.
So, in simple terms, by tracking global liquidity, you get a pretty useful heads-up about where Bitcoin might be headed a couple of months down the road.
The Global Liquidity Index is essentially a snapshot showing how much money central banks and financial institutions are injecting or pulling out of the global economy. Think of it like a big gauge tracking how "easy" or "tight" money conditions are worldwide.
It usually takes into account factors like:
Central Bank Policies: How much money central banks are printing or how they're changing interest rates.
Bank Reserves and Credit Availability: The amount banks can lend out, influencing how easily money flows through markets.
Government Spending and Stimulus: Fiscal policies injecting liquidity directly into the economy.
International Capital Flows: Money moving across borders, affecting global market liquidity.
When liquidity is abundant, there's more money sloshing around looking for places to invest. That typically pushes up asset prices—including speculative ones like Bitcoin—as investors seek higher returns. Conversely, when liquidity tightens (like when central banks raise interest rates or pull back stimulus), money becomes scarcer, risk appetite shrinks, and assets tend to dip.
So, when you're watching the Global Liquidity Index, you're basically monitoring how central banks and institutions are influencing market sentiment and investment behaviors, which eventually impacts speculative assets like Bitcoin—but with that notable delay we talked about earlier.
Practically speaking, here's how you apply the Global Liquidity Index to Bitcoin:
You watch for major turning points—peaks, bottoms, or sharp reversals—in global liquidity. Once you spot one, mark your calendar about 2–3 months forward (around 80 days). That’s usually when Bitcoin mirrors that move.
So, for instance, if the Global Liquidity Index sharply rebounds upward (a V-shaped recovery), you'd expect BTC to follow with a rally roughly two to three months later. On the flip side, if liquidity peaks and starts declining, it's a heads-up that Bitcoin could face downward pressure within the next few months.
This gives you a practical edge—you're essentially previewing BTC’s possible moves.
All things said, if you look at BTC's chart right now and apply the Global Liquidity Index to it you can see how the second has broken its previous high a few months back, but BTC yet has to break its, you can arrive to the conclusions here....
With no reversal in sight (for now) in the Global Liquidity Index, there don't seem to be signs of "spoofing", no case in which the index starts declining and so makes traders who know about this delay start to sell earlier than the delay.
End of the story - things look promising for BTC and you should definitely keep the Global Liquidity Index in your list of indicators.
Cryptocurrency

LINKUSD: Expected to give +100% return.Chainlink has turned overbought on its 1D technical outlook (RSI = 70.291, MACD = 0.870, ADX = 19.937) and has validated the start of the new bullish wave of the Channel Up as it crossed above both the 1W MA200 and MA50. Both prior bullish waves rose by nearly +300%, the most recent by +275%. Technically it can repeat at least that and double in price (TP = 35.00) before the wave peaks at the top of the Channel Up.
## If you like our free content follow our profile to get more daily ideas. ##
## Comments and likes are greatly appreciated. ##

BTCUSD; Heikin Ashi BITSTAMP:BTCUSD
Weekly time frame and divergences.
Maybe big correction after sweep of previous ATH...
It is very interesting how different methods, approaches we traders use, either to actively look for daily or weekly opportunity or longer term investment.

ALTSEASON is here!The Crypto Total Market Cap (excluding the Top 10 coins) broke above the 1D MA200 (orange trend-line) and is consolidating on an overbought 1D RSI (>70.00).
Since October 2023 when this set of conditions emerge, the long-term Channel Up starts a rally (technically its Bullish Leg). This is what in the crypto world is known as 'Altseason',which is when the lower cap coins see enormous gains relative to the top 10.
The last Bullish Leg (2024) rose by +200%. The previous one, even more. If it 'just' repeats the +200% Leg, we are looking at a market cap of $525 Billion.
The time to invest in alts is now!
-------------------------------------------------------------------------------
** Please LIKE 👍, FOLLOW ✅, SHARE 🙌 and COMMENT ✍ if you enjoy this idea! Also share your ideas and charts in the comments section below! This is best way to keep it relevant, support us, keep the content here free and allow the idea to reach as many people as possible. **
-------------------------------------------------------------------------------
💸💸💸💸💸💸
👇 👇 👇 👇 👇 👇

DOGEUSD Massive Bull Flag targets $0.40 like late 2024!Dogecoin (DOGEUSD) is posting a Bull Flag pattern on the 4H time-frame, being supported by the 4H MA50 (blue trend-line).
A similar Bull Flag was formed at the start of its previous major rally in October 2024, which made the price jump to the 2.0 Fibonacci extension, in as much time as it took for the price to reach the Bull Flag's start from the bottom.
As a result, we expect DOGE's next short-term Target to be $0.40.
-------------------------------------------------------------------------------
** Please LIKE 👍, FOLLOW ✅, SHARE 🙌 and COMMENT ✍ if you enjoy this idea! Also share your ideas and charts in the comments section below! This is best way to keep it relevant, support us, keep the content here free and allow the idea to reach as many people as possible. **
-------------------------------------------------------------------------------
💸💸💸💸💸💸
👇 👇 👇 👇 👇 👇

IOTA Could Be On The Way Back To December 2024 HighsIOTA with ticker IOTUSD made sharp and impulsive rally at the end of 2024, which we see it as a first leg (A)(1) of a bigger recovery in minimum three waves (A)(1)-(B)(2)-(C)(3). Since the beginning of 2025, Crypto market slowed down and IOTA made a deep retracement, but in three legs ABC with an ending diagonal/wedge pattern into wave C, which indicates for a correction in wave (B)(2).
Well, it nicely bounced recently, making a clean five-wave impulse away from projected 78,6% Fibonacci support and back above channel resistance line, so it can be wave 1 of a new five-wave bullish cycle within higher degree wave (C) or (3). That said, after current pullback in wave 2, be aware of more gains for wave 3 of a five-wave bullish cycle that can send the price back to December 2024 highs this year.

BITCOIN on similar spot as before the U.S. elections! 155k next?Bitcoin (BTCUSD) broke last week above the Lower Highs trend-line of its December 2024 High and so far on the current 1W candle, it's consolidating on it.
This is the exact same price action we saw on the October 21 2024 1W candle, which after breaking above that Lower Highs trend-line at the time, it spend 2 weeks consolidating on it before the November 05 U.S. election result started a relentless 7 week rally just below the 2.0 Fibonacci extension.
Note that on both fractals, the Lower Highs break-out and then re-test, took place on the 0.786 Fibonacci retracement level. If BTC manages to close above it at all times, we will have a strong case to expect again a Bullish extension as last December. The symmetrical level just below the 2.0 Fib ext in today's terms is $155000.
Do you think that will be next after a short-term consolidation? Feel free to let us know in the comments section below!
-------------------------------------------------------------------------------
** Please LIKE 👍, FOLLOW ✅, SHARE 🙌 and COMMENT ✍ if you enjoy this idea! Also share your ideas and charts in the comments section below! This is best way to keep it relevant, support us, keep the content here free and allow the idea to reach as many people as possible. **
-------------------------------------------------------------------------------
💸💸💸💸💸💸
👇 👇 👇 👇 👇 👇

Phemex Analysis #80: Can Bitcoin Hold $100k?Bitcoin’s breakout above the $100,000 mark on May 8, 2025—its highest level since early January—reflects renewed risk-on sentiment across global markets, supported by easing U.S.-China tension and expectations of favorable crypto regulation. Spot ETF flows have also played a pivotal role: U.S. Bitcoin ETFs have accumulated over $1 billion in net inflows this month, with BlackRock’s IBIT leading demand, underpinning liquidity in the $100k zone. Despite the enthusiasm, trading volumes on leading exchanges have shown signs of plateauing, hinting at cautious engagement from larger players.
Possible Scenario
Support Analysis
1. $100,000 Psychological Support
After initially spiking to $105,784, BTC retreated to hover just above $100k, which has transitioned into a crucial support level. A decisive hold here would confirm buyer conviction at round-number thresholds.
$97,000 Major Technical Floor: Beneath six figures, the $97,000 region—previously a resistance zone in April—now offers strong demand, reinforced by the convergence of the 50- and 100-day moving averages.
$92,000 Secondary Support: Should broader market risk aversion emerge, traders could see a retracement back to $ 92K, where on-chain data indicates accumulation by long-term holders. This level aligns with the 200-day moving average, often cited as a bear-market safeguard.
2. ETF-Driven Cushion
Spot ETF inflows continue to absorb sell-side pressure, potentially dampening volatility around support levels. Historical data shows ETFs acted as a buffer during the March sell-off, suggesting they may again prevent sharp dives if BTC dips towards $90k–$100k.
Resistance Analysis
1. $105,000 Near-Term Cap
BTC peaked at approximately $105,784 on May 12, encountering supply from short-term profit-takers. A close above this region would target the early-2025 all-time high near $109,917.
2. $109,917 All-Time High
Surpassing the January ATH at $109k remains a key objective for bulls. However, historical patterns reveal increasingly subdued momentum on successive tests of this level, indicating potential exhaustion if attempted too quickly.
3.Upside Target $120,000
Most Analysts highlight a possible extension to $120k should institutional demand persist and macro conditions remain supportive.
Conclusion
Bitcoin’s ability to hold the $100,000 mark hinges on its capacity to stave off profit-taking around headline-grabbing price points and sustain ETF-driven support. Key technical floors at $100k and $ 97K—reinforced by moving-average convergence—provide a strong base, while resistance levels at $105k and the all-time high near $109.6k represent the next hurdles. If these zones are negotiated successfully, a new leg toward $120k could unfold; if not, traders should watch for a pullback to the mid-$90,000 range for renewed entries.
Overall, barring sudden negative macro shocks, the outlook favors BTC maintaining its foothold at six figures, underpinning continued upside momentum.
Pro Tips:
Armed Your Trading Arsenal with advanced tools like multiple watchlists, basket orders, and real-time strategy adjustments at Phemex. Our USDT-based scaled orders give you precise control over your risk, while iceberg orders provide stealthy execution.
Disclaimer: This is NOT financial or investment advice. Please conduct your own research (DYOR). Phemex is not responsible, directly or indirectly, for any damage or loss incurred or claimed to be caused by or in association with the use of or reliance on any content, goods, or services mentioned in this article.

BITCOIN TO $140KAccording to this weekly chart I have, bitcoin has a very important trendline that no one pay attention to, which gives us a very strong resistance about $134k to $140k , depends when bitcoin touch that, and I expect a big rejection from that area.

BITCOIN about to test its ATH following HUGE U.S. - China deal!Bitcoin (BTCUSD) is marching towards the $109000 Resistance, which is its All Time High (ATH), following the U.S. - China trade agreement 3 hours ago. This can be a huge fundamental boost to the bullish trend as technically, every time the Resistance level broke during this Bull Cycle, the break-out that followed was extremely aggressive.
On October 2 2023, the Resistance test resulted into a strong break-out, which completed a +96.18% rise from the bottom before a 1D MA100 (green trend-line) pull-back. At the same time of the Resistance break-out, we had a 1D MA50/100 Bullish Cross and a 1W MACD Bullish Cross.
The October 29 2024 Resistance test on the other hand was initially unsuccessful and made a 5 day rejection back near the 1D MA50 (blue trend-line) before the next successful test. Again the rise was more than +96.18%.
As a result, we are expecting to see at least $145k by July (+96.18%) once the Resistance breaks.
Do you think that is a realistic time-frame for $145000? Feel free to let us know in the comments section below!
-------------------------------------------------------------------------------
** Please LIKE 👍, FOLLOW ✅, SHARE 🙌 and COMMENT ✍ if you enjoy this idea! Also share your ideas and charts in the comments section below! This is best way to keep it relevant, support us, keep the content here free and allow the idea to reach as many people as possible. **
-------------------------------------------------------------------------------
💸💸💸💸💸💸
👇 👇 👇 👇 👇 👇

110-111KMorning folks,
So, everything goes with the plan and we still consider 110-111K area as the nearest target.
At the same time this area agrees with weekly and daily overbought, so direct upside breakout hardly possible.
Naturally, when the market is already near the target it doesn't show deep retracement. Thus, we suggest that either upward action continues right from flag shape or 101K support. 98K support area looks cool, but it is more for stop placement and invalidation level rather than for expecting of real retracement there.

Ethereum (ETH) XABCD Pattern – $3,000 Target Ahead?ETHUSDT is at $1,759 and we’ve got an XABCD harmonic pattern in play!
▸ From $1,516 (X) to $4,147 (A), then slow retracement to $2,120 (B), then a big spike to $4,120 (C), and crash to $1,385 (D).
▸ Now, the chart is eyeing $3,000 as the next big target!
▸ Watch $2,100 and $2,500 as resistance on the way up. $1,500 is key support – let’s see if it holds!
✉️ What’s your take?
Will ETH hit $3,000, or are we dipping first? Drop your thoughts! ⬇️

Will gold reach an all-time high?Gold (XAU/USD) Market Analysis
Trend Environment
The 4-hour chart of Gold (XAU/USD) from OANDA illustrates a strong impulsive structure within a broader bullish trend. Following a sharp upward movement that broke through previous structure, gold formed a swing high before entering a corrective phase. The market has since pulled back and appears to be stabilizing near a zone of high confluence, suggesting potential for a renewed move to the upside.
Key Levels
Support Zone 3,280-3,300 region, characterized by a fair value gap and Fibonacci golden pocket zone (0.618-0.65 retracement levels).
Potential Targets Higher lows and break of structure above recent swing highs, with buy-side liquidity levels (BSL) marking areas where buy stops are likely to be clustered.
Technical Confluence
The alignment of the fair value gap and Fibonacci retracement levels in the 3,280-3,300 region increases the likelihood of price reacting positively. Fair value gaps represent inefficiencies in the market caused by strong institutional participation, while the golden pocket is historically known for acting as a magnet for reversals within trending markets.
Bullish Scenario
The chart projects a potential bullish continuation move, with a series of higher lows anticipated to form en route to a break of structure above recent swing highs. A methodical stair-step advance is expected, respecting interim levels before ultimately attempting to reach the prior high near 3,530.
Strategic Framework
This analysis offers a methodical roadmap for bullish continuation, rooted in the smart money framework of liquidity, inefficiency, and institutional order flow. The confluence between the fair value gap and Fibonacci retracement serves as a key validation area for bullish traders. By understanding the technical and institutional drivers of the market, traders can better navigate the complexities of the gold market and identify potential opportunities for growth.

BTCUSDTHello Traders! 👋
What are your thoughts on Bitcoin?
Bitcoin has successfully broken above the $100,000 resistance zone and is now holding above this key level.
The price is expected to challenge the previous high, which represents a major resistance area.
A short-term pullback may occur after testing this heavy resistance.
Once the correction is complete, Bitcoin could resume its upward move toward higher targets.
Will Bitcoin continue its rally after a healthy pullback? Share your thoughts below!
Don’t forget to like and share your thoughts in the comments! ❤️

IOTX Is Still Bullish (12H)The important trigger line has been broken, and the price has recently formed the main bullish CH (Change of Character).
If the demand zone holds, the price may move toward the flip line.
A daily candle closing below the invalidation level would invalidate this analysis.
Do not enter the position without capital management and stop setting
Comment if you have any questions
thank you

Binance Coin (BNB)The world's largest crypto exchange by volume, Binance continues its push into the embattled crypto mining industry with a plan to begin offering a crypto cloud mining product next month. crypto miners have had a tough year, with the price of bitcoin having hung around $20,000 for months, a far cry from its peak above $68,000 in November 2021. Other cryptos have faced similar or even worse declines. One of the largest mining-related firms in the U.S. filed for Chapter 11 bankruptcy in late September. Other companies, however, are seeing opportunity from this crisis, with CleanSpark going on a buying spree of mining rigs and data centers, and DeFi platform Maple Finance starting a $300 million lending pool
Binance Pool announced its own $500 million lending fund for bitcoin miners last week and said it would enter cloud mining, a service that allows investors – who otherwise might not be able to buy and operate their own equipment – to rent crypto mining machines. The official launch of the cloud mining service will come in November.
BNB can back to 300 in a short time but 195 is a good price for entry and long term investment

BITCOIN ( Is this the final DIP ? )I bought the dip but it just keeps dipping!
it's time to put on my bear glasses and check this ponzi chart !! oh yeah
As you can see in these patterns the moments everyone ready for breakout, bitcoin dumps to another lower level and kills all hopium that moonboyz, frog army and GM gurus got
if you think that you are person who manage to buy the exact number at dip you are wrong too, like people who bought at 60k and had plan to sell at 90k
RSI looks bearish like the pattern , I start shorting at 17490 and not going to close it till 16950$
If you got crypto on Huobi and Gemini exchange watch out too
funds are NOT safu

BTCUSD Analysis (1W)Current Price: $103,252.95
Trend: Strong (28.05%)
Volatility: High (115,000)
Volume: 106.35K (weekly)
Supports: $100,000, $90,000
Resistances: $110,000, $120,000
Ichimoku: Bullish cloud, price above
Smart Trend: Buy signal (9.21)
📅 Since 2023, Bitcoin has maintained a clear uptrend. At this price, there could be a push towards $110,000 in the short term.
⚠️ Disclaimer: This is not financial advice. Trade at your own risk.
#BTC #Crypto #Trading
SmartTrend Indicator @tradingbauhaus

ALTSEASON: Market to skyrocket to a 1.6 Trillion cap.The Cycle's Channel Up on the Crypto Total Market Cap (exc BTC and ETH) technically started its new bullish wave, which is translated to what is known as an altseason. Based on this chart, it is expected to rise by at least +139%, bringing the market to a $1.6 Trillion cap. Time to invest heavily in altcoins.
## If you like our free content follow our profile to get more daily ideas. ##
## Comments and likes are greatly appreciated. ##

Dominance BTCHere’s something interesting on the 4H chart.
We can clearly see that BTC dominance has broken its bullish structure. A retest around 64.50% is likely, followed by a potential 2.60% drop toward 62.50%.

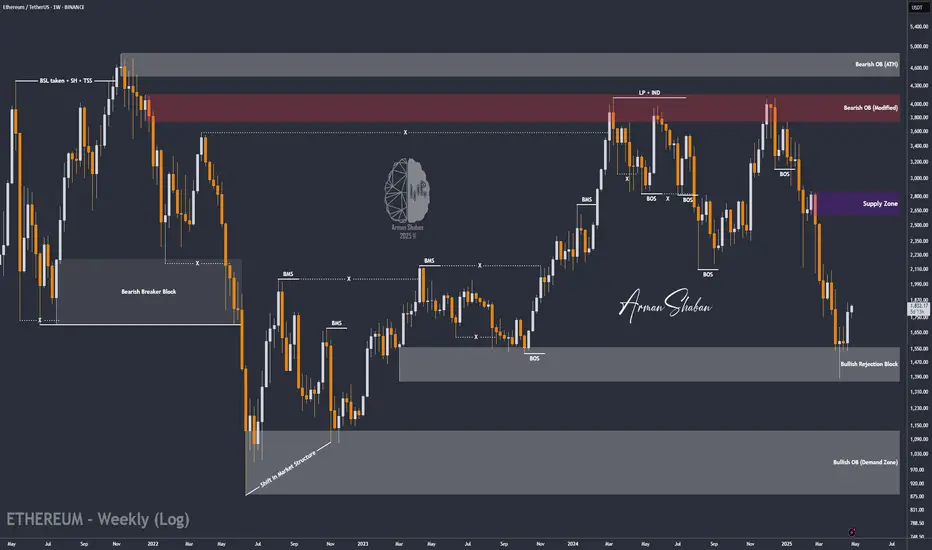
ETH/USDT : Bulls are coming back? (READ THE CAPTION)By analyzing the #Ethereum chart on the weekly (logarithmic) timeframe, we can see that after reaching the demand zone between $1400 and $1550, buying pressure increased significantly. Currently, Ethereum is trading around $1800, and I expect to see the next bullish wave soon. The potential upside targets are $1990, $2500, and $2600. This analysis will be updated accordingly!
Please support me with your likes and comments to motivate me to share more analysis with you and share your opinion about the possible trend of this chart with me !
Best Regards , Arman Shaban
TON/USDT : The Next Bullish Rally Ahead? (READ THE CAPTION)By analyzing the #Toncoin chart on the 3-day timeframe, we can see that the price is currently trading around $3.00, which is approximately 60% below its all-time high of $8.20. If Toncoin can hold above the $2.80 level, we may expect further bullish momentum in the mid-term.
The next potential upside targets are $3.39, $3.64, $4.20, and $4.66.
Please support me with your likes and comments to motivate me to share more analysis with you and share your opinion about the possible trend of this chart with me !
Best Regards , Arman Shaban

ADA/USDT: Is ADA Preparing for Its Next Rally?(READ THE CAPTION)By analyzing the #Cardano (ADA) chart on the 3-day timeframe, we can see that over the past few months, the price surged from $0.33 to $1.32, delivering a gain of over 300%. After reaching its highest level in 3 years, it faced selling pressure and corrected down to $0.50.
Currently, Cardano is trading around $0.70, and if the price can hold and close above the $0.65 level, we may expect further upside in the medium term.
The next potential targets are $0.75, $0.81, $0.93, and $1.05, respectively.
Please support me with your likes and comments to motivate me to share more analysis with you and share your opinion about the possible trend of this chart with me !
Best Regards , Arman Shaban
