ETHEREUM is getting ready for a major breakout (12H)This analysis is an update of the analysis you see in the "Related publications" section
The red zone represents a supply area based on the Philip strategy. It’s possible that the price might not be able to break through this zone on the first attempt. If the price gets rejected, the lower green box will be a re-entry opportunity for those who missed the move.
Let’s closely monitor this chart and see how it plays out.
A daily candle closing below the invalidation level will invalidate this analysis. invalidation level : 1198$
For risk management, please don't forget stop loss and capital management
When we reach the first target, save some profit and then change the stop to entry
Comment if you have any questions
Thank You
Cryptocurrency

BTC DOMINANCEBitcoin dominance could break down at this point, potentially signaling the start of an exceptional altseason.

BITCOIN is filling all gaps as it should.Bitcoin (BTCUSD) is having its strongest 1D green candle since April 22 (for now) and basically today's analysis is a continuation/ modification of our April 14 buy call (see chart below):
Our Target was $99500 but we now update it to $106000 as we see a different pattern through filling the Lower Highs gaps. As you can see, since BTC's April 07 bottom, the rebound has filled one Lower High of the downtrend after the other.
At the same time, it has posted identical rallies before consolidating, the 1st one +15.37% and the 2nd +15.11%. We are currently on the 3d and if it makes again +15.11%, then it gets us to $106.9k. That is marginally above the Lower High of January 30, practically the first Lower High after the January 20 All Time High (ATH).
Moreover, the 2.0 Fibonacci extension level is at $106k and this is why we've moved our short-term Target there. This fills all dynamic conditions of this uptrend.
Do you think that's a fair estimate? Feel free to let us know in the comments section below!
-------------------------------------------------------------------------------
** Please LIKE 👍, FOLLOW ✅, SHARE 🙌 and COMMENT ✍ if you enjoy this idea! Also share your ideas and charts in the comments section below! This is best way to keep it relevant, support us, keep the content here free and allow the idea to reach as many people as possible. **
-------------------------------------------------------------------------------
💸💸💸💸💸💸
👇 👇 👇 👇 👇 👇

Bitcoin 1-Hour Chart: Quick Market BreakdownIn this concise market review, we'll analyze the latest movements on Bitcoin's 1-hour chart.

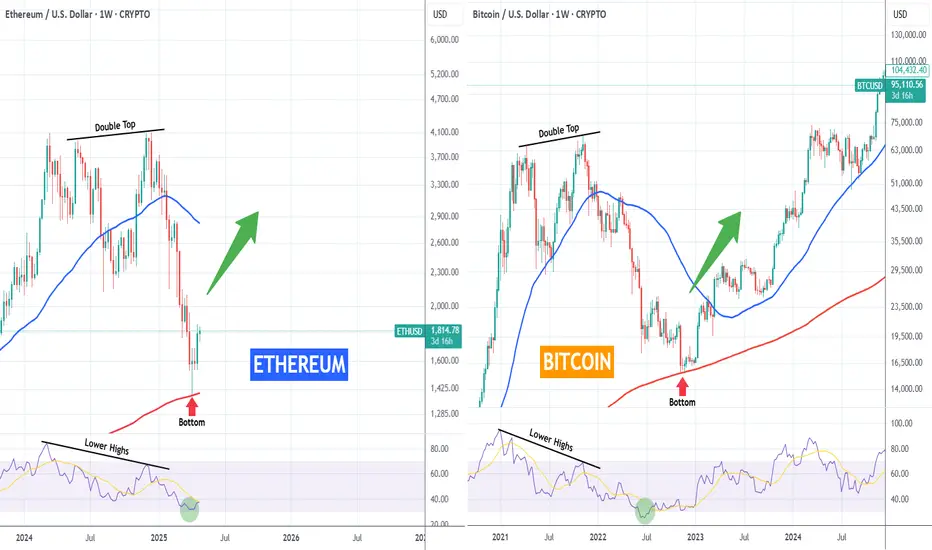
ETHEREUM vs BITCOIN fractals you'd never thought to look at!Odd comparison but you'd be lying if you say those fractals between Ethereum (ETHUSD) 2024 - 2025 and Bitcoin (BTCUSD) 2021 - 2022 don't look similar. But if you do believe it, can this mean ETH is about to see a rally to a new All Time High?
Anyway as the title says, this is fun fractal for comparison purposes only. The conclusion is yours!
-------------------------------------------------------------------------------
** Please LIKE 👍, FOLLOW ✅, SHARE 🙌 and COMMENT ✍ if you enjoy this idea! Also share your ideas and charts in the comments section below! This is best way to keep it relevant, support us, keep the content here free and allow the idea to reach as many people as possible. **
-------------------------------------------------------------------------------
💸💸💸💸💸💸
👇 👇 👇 👇 👇 👇
98+ actionMorning folks,
So, market mostly stands at the same place where we leave it last time :)
But now our monthly bullish pattern is officially confirmed, so mid term direction is up with 110K target at least and potential progress up to 127K.
Now we see a lot of minor bullish signs pointing on upside breakout attempt. Last time we talked about 3-Drive, but today it seems that it could go out of its limits. Not just to 97K but up to 103 K AB-CD upside target.
Until price is above 91.5K lows we do not consider any shorts. Following expected downside pullback is still on the table but not for this week probably. We return to it later as soon as upside action will be over.


TradeCityPro | ENSUSDT Huge Breakout Coming? 👋 Welcome to TradeCityPro Channel!
Let’s dive in and analyze one of the DeFi coins, ENS, together. It’s been performing well recently and has some exciting news!
🌐 Bitcoin Overview
Before starting the analysis, I want to remind you that, as per your request, we’ve moved the Bitcoin analysis from the main section to a separate daily analysis. This allows us to discuss Bitcoin’s status in more detail and analyze its charts and dominance together.
This is the general analysis of Bitcoin dominance, which we promised to cover separately and analyze in longer timeframes.
📊 Weekly Timeframe
In the weekly timeframe, ENS is one of the bullish coins in the market with a promising outlook. It began its main upward movement before the start of 2025, back in late 2023.
After breaking the 9.99 level, we entered the main uptrend, and we can say that we broke the market cap ceiling, achieving a new ATH market cap.
We’re also riding a bullish curved line that acts as support. If this line is broken, it signals a weakening of the main uptrend. A drop below 15.90 would indicate a trend change in the MWC (Market Wide Correction).
Currently, our key weekly support has shifted. We were supported at 13.15, easily moving past this level. Our spot exit trigger is now 13.15, whereas last week it was 15.90.
📈 Daily Timeframe
In the daily timeframe, after a rejection from the ATH at 47.68, we entered a range box between 30.75 and 37.77. After some weak movements toward resistance, we saw a corrective wave.
Following a daily engulfing candle that covered the previous three candles, we experienced a sharp downward wave to 13.49. After that, seller pressure seemed to fade, and buyers stepped in. After a fake breakout at 13.49, we saw a move up to 18.41.
Additionally, the trendline formed during the recent declines in this chart was broken after the support at 13.49. However, since the trigger hasn’t been activated yet, we’re not acting on this trendline for now. But if 18.41 is broken, you could consider a risky spot buy.
✍️ Final Thoughts
Stay level-headed, trade with precision, and let’s capitalize on the market’s top opportunities!
This is our analysis, not financial advice always do your own research.
What do you think? Share your ideas below and pass this along to friends! ❤️

USDT Dominance Update (12H)It seems it can drop a bit more. Upon reaching the green box, it could reverse upwards and lead to a market correction in crypto.
In the green zone, caution is needed, and new purchases in the crypto market should be accompanied by precise capital management.
For risk management, please don't forget stop loss and capital management
Comment if you have any questions
Thank You

ETH ANALYSIS🔮 #ETH Analysis 🚀🚀
💲💲 #ETH is trading between support and resistance area. There is a potential rejection again from its resistance zone and pullback from trendline. If #ETH sustains above major resistance area then we will a bullish move till its major resistance area
💸Current Price -- $1,755
⁉️ What to do?
- We have marked crucial levels in the chart . We can trade according to the chart and make some profits. 🚀💸
#ETH #Cryptocurrency #DYOR

SOLANA's massive 1W MA200 rebound hints to enormous rally ahead.Solana (SOLUSD) made a very strong rebound on its 1W MA200 (orange trend-line) on the very first week of April. Now that the month is about to close, it has already completed three straight green 1W candles and is aiming for the critical 1W MA50 (blue trend-line) test.
If broken, we expect it to turn into a long-term Support again and target the Higher Highs of the Wedge at $350. After all, the 1W MA200 rebound also made contact on the 2-year Higher Lows trend-line of the Bull Cycle, so technically it is a massive Bottom cluster. The 1W RSI also broke above its MA last week, confirmed the buying pressure.
Given that the recent 3-month correction was -67.23%, identical to the last correction (May 2021) of the previous Cycle, we expect one final rally to the 2.0 Fibonacci extension at $900, if the Higher Highs trend-line breaks.
-------------------------------------------------------------------------------
** Please LIKE 👍, FOLLOW ✅, SHARE 🙌 and COMMENT ✍ if you enjoy this idea! Also share your ideas and charts in the comments section below! This is best way to keep it relevant, support us, keep the content here free and allow the idea to reach as many people as possible. **
-------------------------------------------------------------------------------
💸💸💸💸💸💸
👇 👇 👇 👇 👇 👇

BITCOIN This is where the real BULL started in 2017.We've mentioned on numerous occasions how Bitcoin's (BTCUSD) current Cycle resembles that of 2014 - 2017 and this evidence is self-explanatory on the chart. What we want to bring forward today, and the timing couldn't be better, is that symmetrically speaking, it was the exact same time of the year (April 2017) when the past Cycle started printing predominantly green candles that lasted until the very end of 2017 (December) and the Cycle Top.
The 3W RSI sequences are identical among the two fractals with a Pivot trend-line dominating both Cycles, first as a Resistance (red arrows) and then turned into Support (green arrows). Before the end-of-year Parabolic Rally, the Bull Cycle was classified into 3 pull-back/ consolidation Phases (blue Rectangles) and, no surprise, the mini rallies started around the same times.
Can this indicate that we are about to see a strong rally of predominantly green candles towards the end of the year to form the new Cycle High? What do you think?
Feel free to let us know in the comments section below!
-------------------------------------------------------------------------------
** Please LIKE 👍, FOLLOW ✅, SHARE 🙌 and COMMENT ✍ if you enjoy this idea! Also share your ideas and charts in the comments section below! This is best way to keep it relevant, support us, keep the content here free and allow the idea to reach as many people as possible. **
-------------------------------------------------------------------------------
💸💸💸💸💸💸
👇 👇 👇 👇 👇 👇

XRP/USDT 1H Chart: Ready for a Moonshot? Hey XRP fam! Let’s break down this sizzling 1-hour chart. XRPUSDT is cooking up something big, and we’re on the edge of our seats!
We’re seeing a series of triangles forming, with XRP stuck in consolidation phases — each one tighter than the last. The price is currently testing the upper trendline of the latest triangle, sitting around $2.247 after bouncing off a solid support at $2.050. This setup screams potential breakout! I put on the chart a bold “Highway to Moon” arrow pointing upward, hinting at a possible surge toward $2.600 or beyond if XRP breaks free.
But let’s not get too starry-eyed — failure to break out could see XRP retreat to the support zone at $2.050, or even lower to $2.000 if things get shaky.
Key Levels to Watch:
Resistance: $2.299
Support: $2.2184
Breakout Target: $2.360+
Breakdown Risk: $2.000
Are we heading to the moon, or is this a fakeout? Let’s hear your thoughts below!

Phemex Analysis #77: Pro Tips to Trade SIGN! SIGN token ( PHEMEX:SIGNUSDT.P ) has experienced a remarkable surge this week, gaining 60% in a short period as seen on the 1-hour chart. This surge has attracted significant investor attention, driven by SIGN's unique approach to cross-chain verification. Cross-chain verification addresses a critical challenge in the blockchain space: the secure and efficient transfer of data and assets between different blockchain networks. SIGN aims to streamline this process, enhancing interoperability and reducing the risks associated with cross-chain transactions. This innovative solution has positioned SIGN as a potentially valuable asset in the expanding multi-chain ecosystem, contributing to the recent price appreciation.
Possible Scenarios (1-hour Chart)
Given the recent surge and the volatility inherent in the cryptocurrency market, here are potential scenarios for SIGN token, focusing on the 15-minute timeframe:
1. Continuation of the Uptrend
If SIGN maintains strong buying pressure and volume, the uptrend observed could continue. This scenario suggests that the market is highly optimistic about SIGN's cross-chain verification technology.
Pro Tips:
Identify key resistance level, such as $0.10. If the price breaks out of this level, it would suggest the continuation of this uptrend.
Consider entering long positions on the breakout, with stop-loss orders below a recent low like $0.092.
Short-term profit targets include $0.109 & $0.125.
2. Short-Term Consolidation
Following the rapid price increase, SIGN may enter a period of consolidation on the 1-hour chart. This consolidation could be characterized by sideways price action within a defined range.
Pro Tips:
$0.105 might act as the upper boundary, and $0.09 might act as the lower boundary of the consolidation range.
Be patient and watch for a breakout from the consolidation range, which could signal the resumption of the uptrend or a trend reversal.
Use volume and breakout confirmation techniques to validate any breakout trades.
3. Rapid Price Correction
Given the sharp price increase, SIGN is vulnerable to a rapid price correction, especially if profit-taking occurs or negative news emerges.
Pro Tips:
Monitor for signs of weakening momentum, such as lower highs with lower lows, and RSI divergence.
Be prepared to exit long positions quickly if a correction begins.
Consider shorting opportunities if the price breaks below key support levels (such as $0.09) with strong volume, but manage risk carefully.
Conclusion
SIGN token's recent 60% surge, driven by its innovative cross-chain verification technology, has created short-term trading opportunities. Analyzing the 1-hour chart reveals potential scenarios, including a continued uptrend, short-term consolidation, and rapid price correction. Traders should employ appropriate risk management strategies, closely monitor price action and volume, and stay informed about any developments related to SIGN token and the broader cross-chain ecosystem.
Pro Tips:
Trade Smarter, Not Harder with Phemex. Benefit from cutting-edge features like multiple watchlists, basket orders, and real-time strategy adjustments. Our unique scaled order system and iceberg order functionality give you a competitive edge.
Disclaimer: This is NOT financial or investment advice. Please conduct your own research (DYOR). Phemex is not responsible, directly or indirectly, for any damage or loss incurred or claimed to be caused by or in association with the use of or reliance on any content, goods, or services mentioned in this article.

Daily Price Action: BITCOIN BTCUSD Tuesday 4/29/2025In this video, we will be looking into the potential price action BTCUSD.

NEAR/USDT 1H Chart: Breakout or Breakdown?Hey crypto traders! Let’s zoom into this 1-hour chart, because NEAR is serving up some serious action!
We’ve got a massive triangle forming, with the price squeezing tighter and tighter between converging trendlines. NEAR is currently dancing around $2.466, teasing a breakout after bouncing between resistance at $2.729 and support at $2.419. This pattern is a pressure cooker, and a big move is coming — will it soar to new highs or crash back down?
A bullish breakout above the upper trendline could propel NEAR past $2.610, potentially targeting $2.729 or higher! But if it fails to hold support at $2.540, we might see a dip toward $2.419 or even lower.
Key Levels to Watch:
Resistance: $2.610
Support: $2.540
Breakout Target: $2.729+
Breakdown Risk : $2.419
What’s your take — bullish surge or bearish pullback? Let’s hear your predictions below!

Pullback's Almost Over — Get In Before It RunsThe best time to enter in a bull market is during a pullback — when price temporarily retraces before continuing its upward trend.
In the case of BINANCE:SUPERUSDT , price is currently pulling back into a demand zone between 0.7178 – 0.7109. The overall structure remains bullish, with the blue arrows showing a series of higher lows and the red arrows indicating higher highs.
We expect the price to bounce from this demand zone and potentially break the previous high, continuing the bullish trend.
To confirm the pullback is ending and a reversal is underway, we’ll watch for candlestick patterns. Here are two possible bullish confirmation scenarios:
Price breaks and closes above the high of the last red candle — a bullish engulfing setup.
Price dips deeper into the demand zone, then forms a bullish pattern such as:
Bullish Engulfing
Bullish Harami
Other reversal signals, like a close above the high of the previous two candles.
These are the scenarios I’m watching for on $SUPERUSDT.
Let me know your thoughts!

Bullish Pennant in ARDR: A Pause Before Another RallyAfter an aggressive surge marked by a big green candle, BINANCE:ARDRUSDT is now moving sideways. This sideways action represents a "voting phase" between buyers and sellers — a battle to decide who will take control next.
Looking at the current price structure, this consolidation is setting up a potential continuation move toward the next target zone at 0.15199 – 0.15900.
Technically, the sideways movement is forming a bullish pennant pattern — a classic sign where price briefly pauses after a strong rally, gathering momentum before continuing its upward trend.
One thing to watch: after breaking the previous high (marked by the red arrow), price should not fall back into the pennant structure. A re-entry would weaken the bullish setup.
As long as price holds above the key support at 0.12273, the bullish scenario remains intact.
What's your view on this setup?

BITCOIN Why is this rally surprising you?Bitcoin (BTCUSD) has completed 3 straight green weeks, with an impressive last 1W candle closing and started the new one right where it left. This rise shouldn't be surprising to most as it has fulfilled all the conditions that initiated all major rallies since the November 2022 Bear market bottom.
The first week of April rebounded strongly on the 1W MA50 (blue trend-line), which as mentioned numerous times on our channel, has been this Bull Cycle's main Support and kickstarted the Q4 2023 and Q4 2024 rallies.
At the same time, the 1W RSI broke last week above its MA, which has been the final confirmation of those Bullish Legs. With the 1W Bollinger Bands (BB) still ranged, the top trend-line is expected to rise aggressively as BTC's uptrend accelerates, something that resembles October 2023 and October 2024.
Throughout this Bull Cycle, those rallies have lasted around the same time, the longest being 14 weeks. As a result, the latest the current Bullish Leg tops should be on the week of July 14 2025 and a +92% rise as February - March 2024 should deliver a test of the Higher Highs trend-line around $140000.
Do you think that's the most probable scenario? Feel free to let us know in the comments section below!
-------------------------------------------------------------------------------
** Please LIKE 👍, FOLLOW ✅, SHARE 🙌 and COMMENT ✍ if you enjoy this idea! Also share your ideas and charts in the comments section below! This is best way to keep it relevant, support us, keep the content here free and allow the idea to reach as many people as possible. **
-------------------------------------------------------------------------------
💸💸💸💸💸💸
👇 👇 👇 👇 👇 👇

BTCUSDTHello Traders! 👋
What are your thoughts on BITCOIN?
Bitcoin has reclaimed the $90K– GETTEX:92K zone after a sharp 32% correction from its all-time high, closing the week strongly above this critical area.
As long as price holds above $90,000, the primary bias remains bullish. The $90K– GETTEX:92K area now acts as a key support zone, ideal for pullback buying opportunities.
A breakout above $101,000 could trigger a strong acceleration toward the next major targets at $115K–$125K.
A weekly close below the green support zone would invalidate the bullish scenario and suggest caution.
What’s your outlook? Will Bitcoin maintain momentum and break $101K? Share your thoughts below!
Don’t forget to like and share your thoughts in the comments! ❤️

28/04/25 Weekly OutlookLast weeks high: $95,778.66
Last weeks low: $84,688.21
Midpoint: $90,233.44
Last week Bitcoin ETFs recorded their second highest net inflows ever, $3.06B between April 21st-25th. The result of this buyside volume is evident on the chart as BTC breaks up into the mid $90k's, and in doing so is now back at the level in which BTC fell from originally to hit $74,500. As a result it is fair to say this area will be a big resistance level, but where is new support after this rally?
The aggressive nature of last weeks move up has left a number of areas of imbalance that the market does tend to revisit. Just below midpoint we have the $89,000-$90,000 area just below a key S/R level at $91,000. Dipping below this area into the FWB:88K 's briefly to sweep the demand and reclaiming $91,000 would be ideal for the bulls and very healthy for the next rally.
A less appealing area of imbalance for the bulls would be towards weekly low of $85,300-$86,300, that would be very painful for anyone longing a retest of the $91,000 area and from a HTF perspective would be a lower high and a SFP of the range midpoint, both bearish signals. The 4H 200 EMA is currently around that area at $87,000 too which would mean losing the level after just climbing back above it.
This week I'm looking at that first imbalance area to be a level of support for the next leg up, that's the ideal bullish scenario in my mind. A move below midpoint with acceptance is a red flag on this move and would start to look like a lower high bearish continuation.
Good luck this week!

BITCOIN's Trump effect: The 2025 PARABOLIC FINALE is coming!Bitcoin (BTCUSD) has completed 3 straight green 1W candles, making an impressive start into Q2 2025. But is it a coincidence or systemic behavior of technical trends?
It certainly is no coincidence the structure that the market has with Trump under President. Q1 has been undoubtedly disastrous due to the Trade War fueled by back and forth tariffs. But this is a pattern we've seen before and more specifically in Trump's 1st Term during Q1 2017.
As you can see, BTC was again under heavy volatility during Trump's 1st Term Q1, even though the correction wasn't as hard initially. What's more interesting however, is that in both Terms, the U.S. Dollar Index (DXY, blue trend-line) topped in Q1 and started collapsing. In 2017 that was the catalyst that fueled BTC's insane Parabolic Rally for the rest of the year.
Can the current Dollar collapse kick-start a rally for the rest of 2025? If the Trade War stabilizes, it certainly looks so. It is no coincidence that in 2017 Trump came out storming that the Dollar was too high just like he states now that the Interest Rates are too high, pressuring the Fed to cut.
So what do you think? Is the rest of 2025 destined to be as strong as 2017? Feel free to let us know in the comments section below!
-------------------------------------------------------------------------------
** Please LIKE 👍, FOLLOW ✅, SHARE 🙌 and COMMENT ✍ if you enjoy this idea! Also share your ideas and charts in the comments section below! This is best way to keep it relevant, support us, keep the content here free and allow the idea to reach as many people as possible. **
-------------------------------------------------------------------------------
💸💸💸💸💸💸
👇 👇 👇 👇 👇 👇

97K and 88KMorning folks,
So picture almost has not changed since our last talk. Now we get great setup on monthly chart with upside potential starting from 110K and up to 127K. And our task now is to join this coming action.
It would be great to get a pullback, but the shape of intraday market has changed slightly and it seems that BTC is forming 3-Drive "Sell" with target around 97K. Hopefully this pattern will trigger the pullback that we need.
If it happens, then the next area that we will be watching is around 88-90K, which is nice support area .
That's being said, our strategy for now is action to ~97-97.3K first and pullback to 88-90K second.
I mark this update as "bullish" due to our first point, but you've got the idea.
