TradeCityPro | MNTUSDT The Best Coin for Short Positions👋 Welcome to TradeCityPro Channel!
Let’s dive into the analysis of the popular DeFi coin that’s active on the Mantle chain—where they’re running multiple airdrops and utilizing it for fees. Let’s break it down and analyze it together!
🌐 Overview Bitcoin
Before starting the analysis, I want to remind you again that we moved the Bitcoin analysis section from the analysis section to a separate analysis at your request, so that we can discuss the status of Bitcoin in more detail every day and analyze its charts and dominances together.
This is the general analysis of Bitcoin dominance, which we promised you in the analysis to analyze separately and analyze it for you in longer time frames.
📊 Weekly Timeframe
After hitting 1.4077, which was our previous ATH, there were practically no buyers present here, preventing us from breaking this key ceiling and moving upward.
Additionally, after the rejection from this high and an engulfing of the previous two candles, it’s safe to say our upward movement has concluded, and we’re now heading into at least a period of correction. This has already started as we’ve entered a resting phase from the prior trend.
However, after breaking 0.9030 coinciding with the news of the Bybit hack and the theft of Ethereum and its coins by North Korean hackers we experienced a sharp drop. Given that Bybit held a large volume of this token, the decline was even more pronounced.
📉 Daily Timeframe
In the daily timeframe, after the rejection from 1.4077 and a deep drop, we moved upward again. This time, we hit resistance at 1.2353 multiple times, but nothing happened buyers couldn’t push above this level.
With this lack of buying pressure, sellers stepped into the market. We then formed a support at 1.0102, but after breaking it along with the hack news we saw a sharp drop down to 0.06552! This level is highly significant!
It’s important because this was previously a key resistance, and after breaking it earlier, we kicked off our main uptrend. So, it’s a critical support now, and it won’t break easily! However, if this support does fail, we’ll likely see a drop to 0.5340.
For buying, it’s not a good time yet. But if we get support at 0.6552 with a strong daily candle, we could consider a buy. Alternatively, wait for a box formation and structure. Our current entry trigger would be a break above 0.8464. For selling, my stop loss would be below 0.5340.
🕓 4-Hour Timeframe
In the 4-hour timeframe, after a rejection from 0.8492, we moved down to 0.6539, where we’re currently ranging around this support. A break of this level could set up an excellent short position opportunity.
For a short position, breaking below 0.6539 offers a clean and complete trigger, allowing us to capitalize on this move.
For a long position, we have a couple of scenarios: a fake breakout of the critical 0.6539 support or a break above the 0.6716 trigger could justify opening a long. While there are better coins for longs, a break of the ceiling with higher highs and lows could also warrant a long position.
✍️ Final Thoughts
Stay level-headed, trade with precision, and let’s capitalize on the market’s top opportunities!
This is our analysis, not financial advice always do your own research.
What do you think? Share your ideas below and pass this along to friends! ❤️
Cryptocurrency

BTC/USDTBINANCE:BTCUSDT
CRYPTOCAP:BTC is respecting my levels perfectly 📈 88K target hit ✅
We’ve just tapped into a major resistance zone—so a short-term pullback could be on the table 📉⚠️
#Altcoins might see a bit of cooling off too, but if BTC manages a clean retest around the 85K–85.5K range, that’d be a bullish confirmation 📍
"Disclaimer : Not Financial Advice"

VET ANALYSIS🚀#VET Analysis : Pattern Formation
🔮As we can see in the chart of #VET that there is a formation Inverse Head And Shoulder Pattern and it's a bullish pattern. If the candle sustain above the neckline then a bullish move could be confirmed✅
🔰Current Price: $0.02435
⚡️What to do ?
👀Keep an eye on #VET price action. We can trade according to the chart and make some profits⚡️⚡️
#VET #Cryptocurrency #TechnicalAnalysis #DYOR

BITCOIN Most POWERFUL Signal Activated—Former ATH IS NOW SUPPORTBitcoin (BTCUSD) completed two straight green 1W candles and has started off this week equally impressive, approaching 4-week Highs! This is a direct consequence of the 1W MA50 (blue trend-line) holding as a Support, similar to what happened on the last two Higher Lows of the 3-year Channel Up on August 05 2024 and September 11 2023.
The hidden catalyst perhaps behind this strong move may be the fact that the April 07 2025 Low, besides the 1W MA50, it also rebounded on the former All Time High (ATH) Resistance Zone (red), which now turned into Support (green). This is the Zone that started with the November 08 2021 Cycle High and rejected BT on March 11 2024, April 08 2024, June 03 2024 and July 29 2024.
As long as this critical Support cluster (1W MA50, 2021 ATH Zone) holds, we are expecting the 1W MACD to form a new Bullish Cross, the first since October 14 2024, which technically confirmed the new Bullish Leg of the 3-year Channel Up.
In fact all previous 3 Bullish Legs got confirmed by a 1W MACD Bullish Leg and the minimum the rose by was +105.30%. As a result, after the Bullish Cross is confirmed, we will be expecting to see at least $150000 on this current bull run.
But what do you think? Can this hugely important Support cluster lead Bitcoin to $150k? Feel free to let us know in the comments section below!
-------------------------------------------------------------------------------
** Please LIKE 👍, FOLLOW ✅, SHARE 🙌 and COMMENT ✍ if you enjoy this idea! Also share your ideas and charts in the comments section below! This is best way to keep it relevant, support us, keep the content here free and allow the idea to reach as many people as possible. **
-------------------------------------------------------------------------------
💸💸💸💸💸💸
👇 👇 👇 👇 👇 👇

21/04/25 Weekly OutlookLast weeks high: $86,492.19
Last weeks low: $83,112.72
Midpoint: $84,802.45
Is the market finally showing its hand?
After President Trumps escalation of the tariff trade war, BTC saw huge volatility swings in line with Tradfi, the panic led to de-risking and as a result BTC hit $74,500. Then after a small bounce another revisit of the exact same area resulted in a much more substantial reversal back up into the $80K's. A double bottom and rally despite the tariff situation ongoing suggests huge support/strength in that area on the HTF, I am now satisfied that BTC has closed the area of imbalance caused by the US election pump, confirming support. This event also coincided with SPX bouncing off the 1D 200 EMA.
Since then Bitcoin has rallied back to the upper limit of the downtrend channel (see my previous posts on this structure) which also has the 4H & 1D 200 EMA placed there. For a bullrun to sustain itself these moving averages are important to maintain momentum, time spent under these MA's kill the bullish trend and weaken sentiment around the move.
Last week we saw a very tight trading range of only 4%, that is compared to 15.4% the week previous. My theory was that this compression of price around a key area (4H & 1D 200 EMA + trend channel high) leads to a much bigger impulse move, the only question was in which direction?
The minute the weekly bar closed BTC exploded above both of these MA's and out of the downtrend, so it looks like the question is answered when it comes to direction of the impulse move. The next question is, will it stick?
I do find the timing of the move somewhat suspicious as the majority of Europe are on a public holiday, could this be a MM taking advantage of thin order books? the SPX pre-market is fairly neutral and so I believe tomorrow will tell the true story of where BTC really is.

88.5KHappy Easter,
So, our bullish trade is started well. But for now we wouldn't consider too extended targets. Based on AB=CD that we have on 4H chart , next extension is around 93K.
But here is a tricky moment exists and it relates to the H&S shape and strong 87-89K daily resistance. The point is that the right arm is yet to be formed, and it could be started right around 88.5K 1H chart targets.
That's why we're focused on just near standing targets. If Somehow, BTC will jump above 90K, then, the different scenario could appear. But for now we think it would be better to not take more risk and try to extract as much as good result from current positive position.

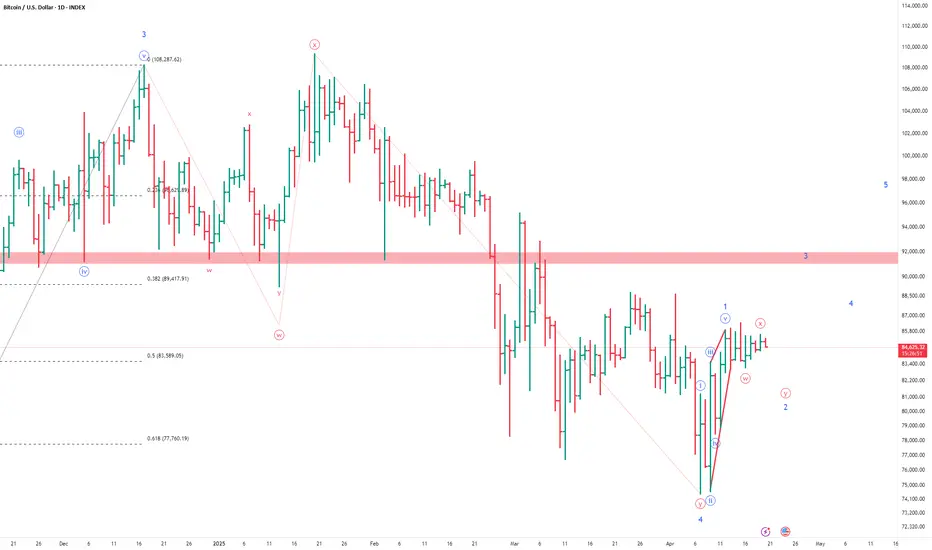
Could this be beginning of 5th wave up in Bitcoin?Being cautiously optimistic - I can see a potential leading diagonal formation followed by 3-3 legs which could be legs w-x of w-x-y or w-x-y-x-z .
Only time will tell if this is what I think it is o it evolves into another corrective rise followed by further downside.
Inverted Head & Shoulders Pattern for BTC??!!!??!Bitcoin appears to be trading in an inverted h&s pattern.
Which coincides with a bullish breach of a Bullish Expanding Triangle highlighted in red to the upside!!
A double bottom is where the head of the inverted triangle can be formed, the space between the two bottoms forms the apex of the head of triangle.
First upside target of $90k USD
Second upside target is $260k USD

The Black Swan Method- Making TA as a trader is like reading a magical ball but some major unpredictable events are out of control.
- i usually accurate most of the time but i should be a fool to think i am always right, it's impossible to make TA in that markets conditions.
- So this post is not to make some kind of predictions but to warn peoples on what's going on right now.
- i will try to explain very basically the situation (with my bad english skills, so forgive me if i make some mistakes) :
1/ the first attack was based on Luna and UST, some entities started to short UST/Luna with some billions $, FTX and SBF surely did it. Luna tried to save the situation with their BTC reserve but it was effortless. they lost all. (Luna have never been hacked, important to specify this )
2/ the fail of UST was the first step to create a snowball effect.
3/ 3AC, Celsius, Voyager, and much more were all involved in Luna/UST and Anchor Protocol witch was giving 18% returns on UST. They used customers funds in UST and staked, when the situation started to turn really bad for Luna, they tried to save the situation trading customers funds and they failed. (any of those companies have been hacked, important to specify this )
4/ FTX used customers funds and started to short their own products, FTT, SOL, SRM, etc , Binance saw the move and twitted that they will drop all their FTT.
FTX locked their customers wallets. FTX used 8B$ Customers funds to short markets. they are still right now trying to short USDT on Binance. (FTX have never been hacked, important to specify this).
5/ The snow ball started to be transformed in an avalanche. The damage here is huge. An exchange implosion of this magnitude is a gift to bitcoin haters all over the world.
6/ Sam bankman-fried was a Trojan horse in the crypto space, surely backed by banks and govs, a kind of worm witch have to be eradicated.
7/ Soon bankers will tell you, " u saw what happened with your exchanges ??!!, better use CDBC and stick with Banks!! ", this is their ultimate goal.
- i pray for everyone who got caught up in this mess and lost money with those bad actors.
- i hope you take care of yourself and continue to be a part of this journey.
- i hope it doesn't turn you off of crypto witch are here to stay in the future.
- BTC is resilient. No matter the magnitude of the earthquake.
- Buy BTC
- Store in Ledger, Trezor or Paper Wallet.
- Hodl and come back later.
Have faith in what you believe and fight. Thanks for reading!
PS : Not sure this post will get me banned or censored, but at this point the freedom of speech is an human right.

Time for again DIPThe level 85000-86000 seems so important level... Until market is not breaking it market is not going Bullish... Level of 70000-69000, which I've already quoted in my last idea, am still waiting for that to swip.... I'll be Bullish from that level, until market breaks 85-86 level.

BITCOIN's secret catalyst. The Gold-to-Crypto Rotation Is ComingBitcoin (BTCUSD) is attempting to form a new medium-term bottom here, following the Tariffs-led sell-off of the past 2 months. While the crypto market is consolidating and accumulating, the Gold market is smashing every historic All Time High (ATH) after the other.
This is not the first time we see this divergence between Gold and BTC and this is what historically delivers what we call 'Gold-to-Crypto Rotation'. This happens when Gold peaks, making its Bull Cycle Top, initiating a capital transition to BTC, hence starting the final rally of its Bull Cycle.
This has already taken place 3 times in its short history and Gold's sheer ferocity of the 2025 rally, indicates that we may possibly be about to repeat another one.
So what do you think is Gold about to top and offer a mass exodus a capital to Bitcoin, hence kickstarting a massive rally? Feel free to let us know in the comments section below!
-------------------------------------------------------------------------------
** Please LIKE 👍, FOLLOW ✅, SHARE 🙌 and COMMENT ✍ if you enjoy this idea! Also share your ideas and charts in the comments section below! This is best way to keep it relevant, support us, keep the content here free and allow the idea to reach as many people as possible. **
-------------------------------------------------------------------------------
💸💸💸💸💸💸
👇 👇 👇 👇 👇 👇

Phemex Analysis #74: Pro Tips to Trade SUISUI ( PHEMEX:SUIUSDT.P ) is experiencing a challenging start to 2025, with its price declining 68% from its all-time high of $5.37 on January 6th. However, a potential bullish reversal signal is emerging, as the recent drop to $1.71 coincides with a Relative Strength Index (RSI) divergence, where the price makes lower lows while the RSI makes higher lows. This divergence suggests that the downward momentum may be weakening, and a trend reversal could be imminent. Let's explore the possible scenarios for SUI to guide our trades.
Possible Scenarios
Based on the current technical setup, here are several potential scenarios for SUI's price action:
1. Bullish Reversal and Breakout
The RSI divergence suggests a potential bullish reversal. If SUI breaks above key resistance levels with strong volume, it could confirm this reversal and lead to a significant upward move.
Pro Tips:
Monitor key resistance levels, such as $2.42 and $2.83.
A break above the $2.42 resistance level (or $2.83 for further confirmation), accompanied by increasing volume, would be a key signal.
Consider entering a long position on the breakout, with a stop-loss order placed below the breakout point or a recent swing low.
Potential profit targets for short-term profits are $3.56 and $4.25.
2. Consolidation and Range Trading
SUI's price may consolidate within a range as the market digests the recent decline and the potential for a reversal. This consolidation period could offer range-bound trading opportunities.
Pro Tips:
Identify support and resistance levels that define this range, such as the $1.71 support and $2.83 resistance.
Within this range, consider buying near the $1.71 support and selling near the $2.83 resistance.
It's important to set stop-loss orders outside the range to manage the risk of a potential breakout or breakdown.
3. Failed Reversal and Further Decline
While the RSI divergence is a bullish signal, there's a risk that the reversal fails, and the price continues to decline. This could happen if broader market sentiment turns bearish or if new negative information about SUI emerges.
Pro Tips:
Monitor key support levels, such as $2.0 and $1.71. A break below these levels with high volume could signal further decline.
If the price fails to break above $2.83 and starts to decline with strong volume, consider exiting long positions.
In a bearish scenario, shorting opportunities may arise on a break below significant support, but this should be done with caution and a tight stop-loss.
Conclusion
SUI presents a complex trading situation. The RSI divergence offers a potential bullish reversal, but the preceding sharp decline and overall market conditions create uncertainty. Traders should carefully monitor price action, volume, and key support and resistance levels. By considering the scenarios outlined above and employing sound risk management practices, traders can position themselves to potentially profit from SUI's price movements, whether it reverses upward, consolidates, or declines further.
Pro Tips:
Elevate Your Trading Game with Phemex. Experience unparalleled flexibility with features like multiple watchlists, basket orders, and real-time adjustments to strategy orders. Our USDT-based scaled orders give you precise control over your risk, while iceberg orders provide stealthy execution.
Disclaimer: This is NOT financial or investment advice. Please conduct your own research (DYOR). Phemex is not responsible, directly or indirectly, for any damage or loss incurred or claimed to be caused by or in association with the use of or reliance on any content, goods, or services mentioned in this article.

2018 Cycle Repeat? Bullish Bitcoin Until End of YearSee my DXY analysis for my full view on the performance on bitcoin (and other risk assets as well)
-Summary- bullish like 2018 until end of year.
-This chart pointing out time frames of past cycles, the over all market structure of bitcoins price, and the transformation of a bullish trend into the parabolic. (where I think we are now)

Daily Price Action: Bitcoin BTC Thursday 4/17/2025In this video, we will be looking into the potential price action of BTC.

BTC 4H VS 1D 200 EMAIt's quite a rare occurrence when the 200 EMA finds itself in a very similar position but right now BTC has that exact setup.
On the 4H BTC is fighting the moving average for the 12th time since losing the support level at the beginning in February. At this time the bearish trend channel upper limit also coincides with this level now, IMO a big move is being setup, but the direction is unsure.
On the daily we're seeing the moving average also in line with the trend resistance however the curve itself differs to the 4H in the way that it's levelling out from an uptrend, not levelling out from downtrend.
Bullish scenario - Breaking out above the moving average and trend channel with strength I believe would start to bring buyers back. Now I would not expect buyers to come flooding in at once as many have been burned too many times trying to long a breakout only for it to be a fakeout. I could see many looking for a form of confirmation, be that a retest as new support or a new HH & HL structure.
Bearish scenario - Yet another rejection off this level would be continuation of the downtrend with many adding to their shorts. This to me would be tied to the SPX/ Tradfi movements although those markets are much stronger than this time last week.
In conclusion there is no clear sense of direction just yet but I think it's coming very soon. The chop we are seeing at the moment is a symptom of a lack of confidence and uncertainty in market conditions. Naturally this lends itself to a continuation of the downtrend but all it takes is a catalyst and some big believers to push BTC out above the downtrend to continue the bullrun. I think we get our answer soon.

BITCOIN just triggered the ultimate post-Halving BUY SIGNAL!Bitcoin (BTCUSD) hit last week the top of the green Gaussian Channel (GC), a key indicator as last time it did (September 02 2024), kickstarted the massive 2024 rally towards the end of the year.
In fact, it can be argued that when BTC makes contact with the GC during a Bull Cycle, it is the ultimate pull-back Buy Signal after Halving events. More specifically, during the previous Cycle and after the May 2020 Halving, the price touched the GC three times (August 31 2020, July 19 2021 and September 20 2021), all of which were the most optimal pull-back Buy Entries as Bitcoin rebounded instantly.
So far during this Cycle and after the April 2024 Halving, this is the 2nd time the GC is tested. As mentioned the first also initiated an instant rebound. As a result, the current GC test is technically considered a very strong buy opportunity for the remainder of the Cycle, which based on the Time Cycles of the last 2 Cycle Tops, it should peak around October 06 2025.
So what do you think? If buying now towards a potential October 2025 Top, the perfect opportunity? Feel free to let us know in the comments section below!
-------------------------------------------------------------------------------
** Please LIKE 👍, FOLLOW ✅, SHARE 🙌 and COMMENT ✍ if you enjoy this idea! Also share your ideas and charts in the comments section below! This is best way to keep it relevant, support us, keep the content here free and allow the idea to reach as many people as possible. **
-------------------------------------------------------------------------------
💸💸💸💸💸💸
👇 👇 👇 👇 👇 👇

BTC has upside chances until it holds above 81K areaMorning folks,
So, picture barely has changes since our last discussion. Right now we do not see any ready-to-trade setups. But suggest some bullish support to the market. After major XOP target has been reached - BTC has not dropped but remains in tight consolidation. This is more a bullish sign.
In general, we could suggest here a kind of reverse H&S shape. It makes us think that until BTC price is above ~ 81K area, it keeps chances on upside breakout. Drop below 81K will lead BTC back to the previous lows.
So, if you would like to buy - try to do this as closer to the lows of consolidation as possible. We consider no shorts by far.

Is This The End of Pullback?BINANCE:SUPERUSDT has entered the support zone between 0.5142 – 0.4754 after a strong impulsive move to the upside.
This support zone is considered valid due to multiple rejections that occurred within this area in the past—indicating strong buyer interest.
Ideally, this is where we expect price to bounce and resume the bullish trend. The first sign of confirmation would be a break above 0.5272, which may open the path toward higher targets.
However, the bullish scenario remains valid only if the price stays above 0.4983—a key invalidation level.
Note:
If this level is breached before a clear candlestick confirmation, the candle pattern being used to validate the move becomes invalid.
Even if the price breaks below the invalidation level, as long as it remains within the support zone, the support is still valid — but it would require the formation of a new bullish candlestick pattern to re-confirm the potential for an upward move.

(JASMY) jasmy "cycle-phase-wave"According to an enhanced MACD indicator that follows three layers of information I found the peak MACD green to line up with the yellow lines on the chart that are assigned with the next alternative colored line to be aligned with the most recent improvement in the otherwise losing price for the last months of time. Although an elliott wave is not seen I figured it would be possible to create a measurement like wave using an indicator to guide where those points should be.

TradeCityPro | MANAUSDT Fake Breakout Trigger Activated!👋 Welcome to TradeCityPro Channel!
Let’s dive into the analysis of one of the metaverse coins and quickly check the trigger and the action unfolding on its chart together!
🌐 Overview Bitcoin
Before starting the analysis, I want to remind you again that we moved the Bitcoin analysis section from the analysis section to a separate analysis at your request, so that we can discuss the status of Bitcoin in more detail every day and analyze its charts and dominances together.
This is the general analysis of Bitcoin dominance, which we promised you in the analysis to analyze separately and analyze it for you in longer time frames.
📊 Weekly Timeframe
On the weekly timeframe, MANA is one of those coins still oscillating within its range box. After a rejection from the key ceiling at 0.7679, we moved back toward the lower end and continued to fluctuate within our range box.
The candle from two weeks ago attempted to close below the critical support at 0.2484—and it did close below this box’s floor. However, this didn’t trigger a sharp drop; instead, we saw a fake breakout!
A fake breakout occurs when a support or resistance level is breached, but the next candle reverses back above the support or below the resistance. This is often called a fake breakout, and it typically signals a trend reversal or the start of a new trend.
That’s exactly what happened here. After the break, the next candle closed as a strong green candle, returning MANA to its box. This could mark the start of a new trend. You can take this trigger with a stop loss at 0.1722 and capitalize on the potential move!
📉 Daily Timeframe
In the daily timeframe, MANA has continued to show the aftermath of the fake breakout. After the failed attempt to break below 0.2484, the price quickly recovered, with buyers stepping in to push it back into the range box.
The strong green candle that followed the fake breakout confirms the buying pressure, and the price is now testing the upper boundaries of the box. If we see a break above 0.7679, it could signal a strong bullish move. However, caution is needed—failure to break this resistance could lead to another rejection.
For buying, the fake breakout trigger at 0.2484 is active, and you can enter with a stop loss at 0.1722. Confirmation would come from sustained volume and a push above the 50-day moving average. For selling, if we break below 0.1722, it’s a sign to exit, as the downtrend could resume.
✍️ Final Thoughts
Stay level-headed, trade with precision, and let’s capitalize on the market’s top opportunities!
This is our analysis, not financial advice always do your own research.
What do you think? Share your ideas below and pass this along to friends! ❤️

BITCOIN Sell everything in October!Yep, kind of a clickbait title but it doesn't fail to serve justice to this very important Bitcoin (BTCUSD) chart.
Today's analysis displays in the most illustrative way the extremely tight symmetry between BTC's Cycles and how this can help us time our Sell at the Top of the Cycle and equally have the patience to buy as close to the next Bottom as possible.
As you see, in the past +10 years since the 2014 Bear Cycle, every Cycle has almost identical time ranges/ durations. All three Bear Cycles since then, lasted for approximately 1 year, and both Bull Cycles for almost 3 years (152 weeks, 1064 days to be exact). More specifically, the last two Bear Cycles were exactly 1 year long, the 2018 one started on the week of December 11 2017 and ended on December 10 2018 and the next Bear Cycle started on November 15 2021 and ended on November 07 2022. So it's been December-to-December and November-to-November Bear Cycles respectively.
If this high degree of symmetry continues to hold, counting 1064 days from the last Cycle Bottom o November 07 2022, gives a time estimate for the next Cycle Top on (the week of) October 06 2025. If also that holds for the Bear Cycle, expect an October-to-October duration, with an approximate bottom on October 12 2026.
So Sell everything up to October 2025 and Buy back as we get close to October 2026 is the strategy?
Feel free to let us know in the comments section below!
-------------------------------------------------------------------------------
** Please LIKE 👍, FOLLOW ✅, SHARE 🙌 and COMMENT ✍ if you enjoy this idea! Also share your ideas and charts in the comments section below! This is best way to keep it relevant, support us, keep the content here free and allow the idea to reach as many people as possible. **
-------------------------------------------------------------------------------
💸💸💸💸💸💸
👇 👇 👇 👇 👇 👇

BTCUSDTHello Traders! 👋
What are your thoughts on BITCOIN?
Bitcoin is still struggling to break through the specified resistance zone.
As long as this resistance level remains unbroken, it is better to wait before entering a buy position. However, as long as Bitcoin does not fall below the specified support level, we can remain optimistic about its potential to rise.
Our outlook remains bullish, but we will wait for the breakout above the resistance before entering a buy. Once the level is broken, we will look for an opportunity to enter long positions.
Will Bitcoin break through resistance and continue higher? Share your thoughts below!
Don’t forget to like and share your thoughts in the comments! ❤️

Phemex Analysis #73: Pro Tips to Trade OM Upon the 90% CrashMANTRA (OM) experienced a dramatic price crash of over 90% last Sunday (April 13th). While many initially suspected a "rug pull" event, similar to what happened with Luna and FTX, OM Founder JP Mullin attributes the massive sell-off to forced liquidations at an exchange, triggering a panic sell-off. While the exact cause of this 90% crash is still unconfirmed, this volatility presents significant trading opportunities.
We suggest that traders use smaller time frames, such as 1-hour or 15-minute charts, to identify more trading opportunities in this volatile situation.
Here are possible scenarios on the 15-minute chart:
Possible Scenarios
1. V-Shaped Recovery
If strong buying pressure emerges and quickly pushes the price back up to pre-crash levels, it could signal a V-shaped recovery. This would indicate that the market has absorbed the sell-off and buyers are back in control.
Pro Tips:
Watch for large green candles with significant volume on the 15-minute chart, that rise above $0.89 or $1.0.
Consider entering a long position on the breakout above key resistance levels ($0.89 & $1.0).
Place a stop-loss order below a recent swing low to protect against a reversal.
2. Consolidation and Accumulation.
The price may consolidate in a range after the crash, as the market tries to find a new equilibrium. This consolidation phase could represent a period of accumulation, where buyers are slowly absorbing the remaining supply.
Pro Tips:
Identify key support and resistance levels within the consolidation range, which is $0.89 to $0.73 or $1.0 to $0.55.
Consider range-bound trading strategies, such as buying near support and selling near resistance.
Alternatively, use Phemex Grid Bots to capitalize all the small price movement during the accumulation phase.
3. Further Decline
If the selling pressure continues or new negative information emerges, the price could decline further. This scenario would be characterized by continued large red candles and a lack of significant buying interest.
Pro Tips:
Monitor key support levels ($0.73, $0.55 & $0.45); a break below these levels could trigger further selling.
Consider exiting any long positions to avoid further losses.
Be cautious about entering new long positions until a clear bottom has been established.
Consider shorting opportunities if the price breaks down through significant support, but manage risk carefully.
Conclusion
The 90% crash in MANTRA (OM) has created a highly volatile trading environment. While the cause of the crash remains debated, the current market conditions offer substantial trading opportunities. By analyzing price action on smaller time frames, such as the 15-minute chart, and considering the scenarios outlined above, traders can potentially profit from both upward and downward price movements. However, it is crucial to exercise caution, manage risk effectively, and stay informed about any new developments related to MANTRA (OM).
Pro Tips:
Elevate Your Trading Game with Phemex. Experience unparalleled flexibility with features like multiple watchlists, basket orders, and real-time adjustments to strategy orders. Our USDT-based scaled orders give you precise control over your risk, while iceberg orders provide stealthy execution.
Disclaimer: This is NOT financial or investment advice. Please conduct your own research (DYOR). Phemex is not responsible, directly or indirectly, for any damage or loss incurred or claimed to be caused by or in association with the use of or reliance on any content, goods, or services mentioned in this article.
