BTCUSDT BEARISH RISING WEDGE PATTERN IN 15-MI Created This BTCUSDT Chart Analysis In 15-M Tf
Entry: SELL from 83800
Resistance zone : 83800 / 84100
Target Will Be : 82200
BINANCE:BTCUSDT Make Rising wedge, Probably BTC going downtrend.
Cryptocurrency

FXAN & Heikin Ashi TradeBINANCE:XRPUSD
In this video, I’ll be sharing my analysis of XRPUSD, using FXAN's proprietary algo indicators with my unique Heikin Ashi strategy. I’ll walk you through the reasoning behind my trade setup and highlight key areas where I’m anticipating potential opportunities.
I’m always happy to receive any feedback.
Like, share and comment! ❤️
Thank you for watching my videos! 🙏

XRPUSD starting the parabolic rally to $6.000Ripple (XRPUSD) has been trading within a 5-year Channel Up since the March 2020 COVID flash crash. That COVID bottom initiated the first Bullish Leg of XRP, which was the previous Cycle's Bull run.
XRP has started the second Bullish Leg after the July 2024 Channel Up bottom and since basically December, the market has been under heavy volatility, entering a consolidation period similar to December - March 2021.
That was XRP's last accumulation phase before the 2021 Cycle Top. The 1W RSI patterns between the two Bullish Leg fractals are also similar, indicating that even though the current Bullish Leg has been more aggressive since November 2024, it is being harmonized now inside the parabolic growth Channel.
We expect a symmetrical +1668% rise in total for this Bullish Leg, similar to 2021, with our Target being marginally lower at $6.000, expecting it within July - October 2025.
-------------------------------------------------------------------------------
** Please LIKE 👍, FOLLOW ✅, SHARE 🙌 and COMMENT ✍ if you enjoy this idea! Also share your ideas and charts in the comments section below! This is best way to keep it relevant, support us, keep the content here free and allow the idea to reach as many people as possible. **
-------------------------------------------------------------------------------
💸💸💸💸💸💸
👇 👇 👇 👇 👇 👇

BTC Short Setup – Targeting 78,320Looking for a sell opportunity at the daily Fair Value Gap (FVG), aiming for a profit target of 78,320, with a stop-loss set at 87,617. Monitoring price action for confirmation before execution. Let’s see how it plays out! 🚀📉 #BTC #Crypto #Trading

TONUSD: New bullish wave started. Next stop $9.000.Toncoin recovered its bullish 1D technical condition (RSI = 62.631, MACD = 0.117, ADX = 36.295) as this is the 4th straight week of gains following the bottom on the 3 year Channel Up. With the 1W RSI rebounding also after being oversold on March 3rd, we have a strong indication that the new bullish wave has technically started. If it only follows the weaker leg of +300% at the start of the Channel Up, it can reach $9.000 by September.
## If you like our free content follow our profile to get more daily ideas. ##
## Comments and likes are greatly appreciated. ##

BTCUSD: Bollinger squeeze paving the way for $160k.Bitcoin remains marginally neutral on its 1W technical outlook (RSI = 46.017, MACD = 2013.300, ADX = 45.410) and started last week a Bollinger Bands squeeze process. This squeeze has been present inside the 2.5 year Channel Up every time after it bottomed. Only July-August 2024 made a slightly lower low because the squeeze process turned out to be longer. Even in the event, what follows all Bollinger squeezes is an expansion rally, especially after a 1W STOCH RSI Bullish Cross and the pattern shows that by this September, we can reach $160,000.
## If you like our free content follow our profile to get more daily ideas. ##
## Comments and likes are greatly appreciated. ##

BITCOIN This is why it will make new ATH this year.The simplest explanation is perhaps sometimes the best. In this context, this is a simple yet powerful Bitcoin (BTCUSD) chart, showing why the Bull Cycle hasn't peaked yet and why a new All Time High (ATH) is coming by the end of 2025.
So, this is the 12M time-frame, essentially each BTC candle represents 1 whole year (12 months). If you are familiar with BTC's 4-year Cycles, which we've been discussing regularly and in-depth on this channel, then it makes perfect sense to see the market peak, then decline for 1 year and then spend the remaining 3 making a Bull Cycle that will ultimately peak on the 4th year.
Practically each Cycle so far had 1 year of Bear Cycle and 3 years of Bull Cycle with the 3rd one always making a new All Time High (ATH) towards the end.
1 red candle followed by 3 green ones. Simplistic yet delivering a powerful message that since we are currently on Year 3 of the Bull Cycle, there are far more greater probabilities to end this 12M (1 year) candle in green as well and with a new ATH.
So what do you think? Ae we getting this fat green 2025 yearly candle or this time will be different? Feel free to let us know in the comments section below!
-------------------------------------------------------------------------------
** Please LIKE 👍, FOLLOW ✅, SHARE 🙌 and COMMENT ✍ if you enjoy this idea! Also share your ideas and charts in the comments section below! This is best way to keep it relevant, support us, keep the content here free and allow the idea to reach as many people as possible. **
-------------------------------------------------------------------------------
💸💸💸💸💸💸
👇 👇 👇 👇 👇 👇

Bitcoin back test 81kBitcoin is back-testing the trend line which is started almost 40 days ago, and in 4 hour time frame looks like we have got a bullish divergence on RSI from the previous low.

XRP’s Path to Dominance: A Forecasted Price Per TokenAs of March 30, 2025, XRP, the cryptocurrency powering the XRP Ledger (XRPL) and Ripple’s On-Demand Liquidity (ODL) solution, is poised for a potential surge in adoption and value. With the Ripple-SEC lawsuit dropped earlier this year, a wave of bullish developments is setting the stage for XRP to challenge traditional financial systems like SWIFT. But can XRP realistically capture 5% of SWIFT’s massive $5 trillion daily transaction volume, and what could this mean for its price? Let’s dive into the factors driving XRP’s growth, including institutional adoption, tokenization, ETFs, futures trading, private ledgers, investor sentiment, and emerging trends like Central Bank Digital Currencies (CBDCs) and FedNow transactions.
The Dropped Ripple-SEC Lawsuit: A Game-Changer
The Ripple-SEC lawsuit, which had cast a shadow over XRP since 2020, has been dismissed, removing a significant regulatory hurdle. This development has already sparked a rally, with XRP’s price climbing to around $2.50 from earlier lows, driven by renewed investor confidence. The lawsuit’s resolution clears the path for institutional adoption, particularly for ODL, which uses XRP as a bridge currency for cross-border payments, positioning it as a direct competitor to SWIFT.
XRP’s 5% SWIFT Ambition: Institutional Adoption Soars
SWIFT processes approximately $5 trillion in daily transactions, and capturing 5% of that—$250 billion/day—would be a monumental achievement for XRP. Recent developments suggest this goal is within reach. Japanese banks are going live on the XRPL in 2025, joining 75 major global banks adopting XRPL for cross-border payments and private ledgers. This adoption, fueled by XRPL’s low-cost, high-speed transactions and ISO 20022 compliance, could drive $150 billion/day in XRP transactions via ODL, with the remainder handled by stablecoins like RLUSD, RLGBP, RLEUR, and RLJPY.
Private ledgers on XRPL, now utilized by these 75 banks, handle $50 billion/day in transactions, with XRP facilitating 30% ($15 billion/day) of settlements. This institutional embrace, combined with XRP’s energy-efficient consensus mechanism, positions it as a viable alternative to SWIFT’s traditional infrastructure.
Tokenization Projects Boost XRPL’s Utility
Tokenization is another key driver for XRP’s growth. Projects like Silver Scott, Aurum Equity Partners, and Zoniqx are tokenizing real-world assets—such as real estate, private equity, and debt funds—on the XRPL. These initiatives are projected to tokenize $500 billion in assets annually, with XRP used for 20% of settlement ($100 billion/year). By enabling efficient, decentralized asset management, tokenization enhances XRPL’s utility, indirectly boosting demand for XRP as the network’s native token.
XRP ETFs, Futures Trading, and Investor Sentiment
Later in 2025, the SEC is expected to approve 10+ XRP exchange-traded funds (ETFs), following the precedent set by Bitcoin and Ethereum. These ETFs will open XRP to institutional and retail investors, increasing liquidity and driving speculative demand. Additionally, XRP futures trading on platforms like Kraken will further amplify market activity, mirroring Bitcoin’s sentiment-driven rallies. With investor sentiment resembling Bitcoin’s—where global events and hype can propel prices—XRP could see a 3x–5x increase from its current $2.50, potentially reaching $7.50–$12.50 in the short term.
Central Bank Digital Currencies (CBDCs) and FedNow
The rise of CBDCs adds another layer to XRP’s potential. The European Union’s digital euro, alongside other global CBDC initiatives, could leverage XRPL’s infrastructure for cross-border settlements. Ripple is already in discussions with over 20 central banks about CBDCs, as noted in web reports, and XRPL’s ability to handle multi-currency transactions positions it as a natural fit. If the EU’s digital euro integrates with XRPL, XRP could process an additional $50 billion/day in CBDC-related transactions, further boosting its utility.
Similarly, the U.S. Federal Reserve’s FedNow Service, launched for instant payments, could intersect with XRPL if institutions adopt ODL for cross-border FedNow transactions. While FedNow focuses on domestic U.S. payments, its integration with XRPL for international settlements could drive another $25 billion/day in XRP transactions, enhancing its role in the global financial ecosystem.
Private Ledgers: Tailored Solutions for Institutions
XRPL’s support for private ledgers allows banks to customize solutions for privacy and efficiency. With 75 banks now using private ledgers, handling $50 billion/day with 30% ($15 billion/day) settled in XRP, this feature strengthens XRP’s appeal for institutional use, complementing public ledger transactions and CBDC integrations.
Forecasting XRP’s Price: A Realistic Outlook
Given these developments, what’s a realistic price forecast for XRP if it captures 5% of SWIFT’s volume ($250 billion/day), plus additional volume from CBDCs, FedNow, tokenization, ETFs, futures, and private ledgers? Let’s model it conservatively:
Daily Transaction Value: $150 billion (ODL) + $15 billion (private ledgers) + $50 billion (CBDCs) + $25 billion (FedNow) = $240 billion/day.
Annual Value: $240 billion * 365 = $87.6 trillion/year.
Tokenization Contribution: $100 billion/year.
Total Annual Value: $87.7 trillion/year.
Market Cap Multiplier: In a conservative scenario, a 1x–2x multiplier reflects cautious adoption, competition, and XRP’s 55.5 billion supply:
At 1x: Market cap = $87.7 trillion, price = ~$1,580.
At 2x: Market cap = $175.4 trillion, price = ~$3,161.
Adjusted for Realism: A $175.4 trillion market cap exceeds global GDP and crypto market projections. Adjusting to 0.5x (conservative, reflecting competition and supply limits): $43.85 trillion, price = ~$790.
Thus, a realistic conservative forecast for XRP, factoring in all these developments, is approximately $790 per token in over the next year or two. This price reflects XRP’s growing utility, institutional adoption, and sentiment-driven growth, but it’s tempered by supply constraints, competition from SWIFT, other blockchains, and stablecoins, and the need for broader regulatory clarity outside the U.S.
Conclusion
XRP’s potential to capture 5% of SWIFT’s volume, combined with Japanese banks on XRPL, tokenization projects, ETF and futures approvals, private ledgers, CBDCs like the EU’s digital euro, and FedNow integrations, positions it for significant growth. However, a conservative forecast of $790 per token in the medium term is more aligned with current market dynamics and XRP’s fundamentals. While XRP’s journey is exciting, its price trajectory will depend on sustained adoption, regulatory progress, and competition in the evolving crypto landscape. Stay tuned as XRP continues to reshape global finance!

TradeCityPro | TONUSDT From Pavel’s Release to Blockchain Events👋 Welcome to TradeCityPro Channel!
Let’s dive into the analysis of TON, one of the most efficient and widely used blockchain projects that is making significant waves in the space.
🌐 Overview Bitcoin
Before starting the analysis, I want to remind you that we have moved the Bitcoin analysis to a separate section based on your requests. This allows us to discuss Bitcoin’s status in more detail and analyze its charts and dominance separately.
This is the general analysis of Bitcoin dominance, which we promised you in the analysis to analyze separately and analyze it for you in longer time frames.
🚀 Pavel Durov’s Release!
Pavel Durov, Telegram’s founder, has returned to Dubai after months of restrictions in France. He was detained in August 2024 over content monitoring allegations but announced on March 17, 2025, that he has finally returned to his main residence and Telegram’s headquarters in Dubai.
Durov thanked his team and lawyers, emphasizing that Telegram had gone beyond its legal obligations. While investigations in France continue, this return could be a turning point for Telegram’s future.
At the same time, the TON blockchain is gaining attention with its NFT ecosystem, including projects like GetGems and TON Diamonds. From Telegram usernames as NFTs to event tickets, TON is building a fast, scalable, and practical ecosystem that’s making headlines.
🔍 Deep Research
In our previous analysis, we conducted an in-depth fundamental review of TON—covering team background, blockchain developments, and ecosystem growth. Since investing requires a full understanding of a project, make sure to check out the previous analysis if you haven’t already.
📊 Weekly Time Frame
TON is one of the strongest altcoins in the market right now. While most altcoins have reached or formed new lows, TON is still holding above major supports.
After forming its all-time high of $8.288, TON entered a distribution zone. Due to overall market corrections, it lost the $4.765 support, leading to a sharp drop that reached the $2.650 support an area we previously identified for entries.
This support level is crucial, as it represents nearly 50% of the chart’s structure. Additionally, the 0.786 Fibonacci level and previous long-term resistance reinforce its importance. As seen on the chart, after touching this level, TON bounced sharply.
There is no clear spot buying trigger at this time frame yet. However, if TON forms a higher low, the chart will turn fully bullish.
For exit strategies, I am currently utilizing my TON within its ecosystem (NFT trading, etc.), so I do not plan to sell unless the price drops below $1.914.
📉 Daily Time Frame
After getting rejected at $6.912, TON entered an ascending triangle pattern—which is typically a bearish continuation pattern. The chart continued forming lower highs and lower lows, indicating that selling pressure outweighed buying interest.
After breaking down from this triangle, TON experienced a sharp 50% drop from the breakout point. However, upon reaching the $2.512 support, the price suddenly pumped, partly influenced by Pavel Durov’s release and new TON blockchain developments.
Even without the fundamental catalysts, this support level was critical, and a bounce was likely. This move has now formed a V Pattern, which is bullish.
If TON breaks above $3.857, we could see further price increases, making this a potential buy opportunity. Confirmation signals include RSI entering overbought territory and increased volume.
⏳ 4H Time Frame
TON is on my watchlist for long positions due to its strong hype and ecosystem developments.
🟢 Long Position:
We are currently testing a major resistance at $4.076. If this level breaks, we can safely enter a long position. If a lower time frame trigger appears, it may be worth entering early.
🔴 Short Position:
I generally don’t recommend shorting TON, but if it breaks below $3.569, it could trigger a decent short trade. However, since TON is still ranging in the daily time frame and market volume is low at the end of the month, be cautious—unpredictable wicks are likely.
✍️ Final Thoughts
Stay level headed, trade with precision, and let’s capitalize on the market’s top opportunities!
This is our analysis, not financial advice always do your own research.
What do you think? Share your ideas below and pass this along to friends! ❤️

TradeCityPro | ATOMUSDT Restarting Daily Analyses!👋 Welcome to TradeCityPro Channel!
Let's get back to our daily analysis routine starting today! From now on, I’ll be sharing daily altcoin analyses again. Today, we’re focusing on one of my favorite coins for futures trading: ATOM.
🌐 Overview Bitcoin
Before starting the analysis, I want to remind you again that we moved the Bitcoin analysis section from the analysis section to a separate analysis at your request, so that we can discuss the status of Bitcoin in more detail every day and analyze its charts and dominances together.
This is the general analysis of Bitcoin dominance, which we promised you in the analysis to analyze separately and analyze it for you in longer time frames.
📊 Weekly Time Frame
ATOM is currently neither in a great position nor in a terrible one. Unlike some altcoins like BNB, SOL, and SUI that have moved towards their highs, ATOM hasn’t made a significant move towards $44 yet. However, it also hasn’t lost its major lows.
The strong green candle from the past two weeks bounced off the $3.728 support level, confirming that this level remains significant and won’t be easily lost. But this alone is not a reason to buy. After the candle closed, the price did not make a significant move.
If you are holding ATOM (like me, as I have staked ATOM in my wallet), I would exit below $3.728 because there is a high probability of a sharp drop toward $1.824.
For buying opportunities, setting a stop-buy order above $5.088 could be an option. We’ll discuss this more in the daily time frame section.
📉 Daily Time Frame
After bouncing off the $3.58 support, we started a bullish move but couldn’t reach $14.184. Instead, after getting rejected at $10.434, we formed a lower high and continued the price correction.
Following this rejection, we continued forming lower highs and lower lows based on Dow Theory. After breaking $5.665, which was an important support, we experienced a sharp drop, reaching the $3.585 support level. After bouncing, a V Pattern was formed.
$4.948 is an important level to watch as it triggers both the V Pattern activation and the trendline breakout.
I will only open short positions below $4.337, but I will not sell my coins unless $3.585 is broken, in which case I will exit my holdings.
⏳ 4H Time Frame
After getting rejected at $4.948, the price dropped to the $4.424 support level. Since it’s Saturday and the market is relatively slow, we might see range-bound movement around this level.
🔴 Short Position:
If $4.424 breaks and RSI enters the oversold zone with increased volume, we could see a short opportunity targeting $4.020.
🟢 Long Position:
I am currently waiting and prefer to open a long position on MKR instead. I don't want to waste the $4.948 trigger, so I will wait for a confirmed breakout before entering a position.
✍️ Final Thoughts
Stay level headed, trade with precision, and let’s capitalize on the market’s top opportunities!
This is our analysis, not financial advice always do your own research.
What do you think? Share your ideas below and pass this along to friends! ❤️

NEARUSD Huge bullish divergence targeting $7.000NEAR Protocol / NEARUSD is trading inside a 1 year Channel Down.
The price is lately inside a smaller Channel Down that failed today and got rejected on the 1day MA50.
The 1day RSI howver has been on a Channel Up in the meantime, which is a huge bullish divergence and resembles the mid September 2024 rejection.
That was on the larger scale though a bottom for the Channel Down that initated a big rally to its top.
Buy and target $7.000.
Follow us, like the idea and leave a comment below!!

BTCUSD: Such consolidations end up very well for Bitcoin.Bitcoin just turned bearish again on its 1D technical outlook (RSI = 44.578, MACD = -918.200, ADX = 29.021) and with 1W still neutral, we are again on strong long term buy levels. Today's chart is yet another illustration of the market dynamics and the similarities with the previous Cycle. The market is well on its way towards the 1.618 Fibonacci extension target, which now translates to $175,000. Unless the 1W MA50 support breaks, BTC is a buy opportunity on every pullback.
## If you like our free content follow our profile to get more daily ideas. ##
## Comments and likes are greatly appreciated. ##

XRPUSD: The 5 year Channel Up is targeting 6.500XRP is neutral on its 1W technical outlook (RSI = 53.399, MACD = 0.310, ADX = 41.023) as since the Jan 13th High, the uptrend took a pause and turned into a sideways consolidation. As long as the 1W MA50 is intact, the Bull Cycle will be supported and since the dominant pattern is a 5 year Channel Up, we are on the latest bullish wave. As a matter of fact we have technically entered the last year of the bullish wave, which is so far identical to the March 2020 - April 2021 wave (also on RSI count). The market is currently (March 2025) on a consolidation much like March 2021. We estimate a similar +1,648% rise (TP = 6.500).
## If you like our free content follow our profile to get more daily ideas. ##
## Comments and likes are greatly appreciated. ##

BITCOIN Is it owed a parabolic rally based on the GoldBTC ratio?Bitcoin (BTCUSD) has been trading on a highly structured manner within a Channel Up for the entirety of its Bull Cycle since the November 2022 bottom. We've discussed before how this is the smoothest Cycle of all.
What we didn't bring into the mix before was the Gold/BTC ratio (black trend-line), naturally negatively correlated to Bitcoin, which has been trading within a Channel Down since its January 2023 Top. As you can see it posts the same pattern on every Cycle: Channel Down (blue), followed by its bearish break-out and a huge drop (red ellipse) that prices the Bull Cycle Top on BTC.
So far every BTC Cycle had its parabolic rally (green ellipse) when the Gold/BTC ratio broke downwards. Does the market owe one this time also? Feel free to let us know in the comments section below!
-------------------------------------------------------------------------------
** Please LIKE 👍, FOLLOW ✅, SHARE 🙌 and COMMENT ✍ if you enjoy this idea! Also share your ideas and charts in the comments section below! This is best way to keep it relevant, support us, keep the content here free and allow the idea to reach as many people as possible. **
-------------------------------------------------------------------------------
💸💸💸💸💸💸
👇 👇 👇 👇 👇 👇

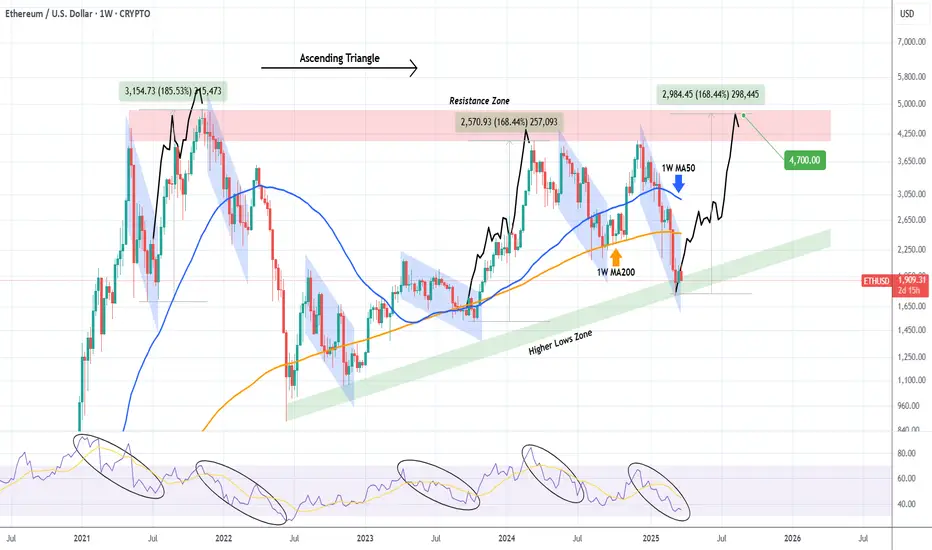
ETHEREUM Ascending Triangle bottomed and is targeting $4700.Ethereum (ETHUSD) hit 2 weeks ago the bottom (Higher Lows Zone) of its 4-year Ascending Triangle pattern, following the recent 3-month correction. That correction has technically been the pattern's Bearish Leg and during those 4 years we've had another 5 similar to this, all with the exception of one, producing a Higher High.
This is actually more similar to the October 09 2023 and June 21 2021 bottoms, so at worst we should get a +168.44% rally from here that will interestingly enough test the Triangle's top (Resistance Zone) a $4700.
-------------------------------------------------------------------------------
** Please LIKE 👍, FOLLOW ✅, SHARE 🙌 and COMMENT ✍ if you enjoy this idea! Also share your ideas and charts in the comments section below! This is best way to keep it relevant, support us, keep the content here free and allow the idea to reach as many people as possible. **
-------------------------------------------------------------------------------
💸💸💸💸💸💸
👇 👇 👇 👇 👇 👇
Bitcoin to backtestAs the white trendline got broken few days ago, now its normal for bitcoin to back test that.
At 82k to 83k we have multi supports as the trendline, horizontal line, moving averages..

BITCOIN new All Time High is a certainty.Bitcoin / BTCUSD found excellent support on the 1week MA50 and is staging a full force recovery.
According to the Time Cycles, it sits between the 0.786 and 1.0 Fibonacci levels. That's hostorically the Final Year of the Cycle.
All Fib stages have been fairly similar among those Cycles so if it continues to be that consistent, we should expect the price to rise now non-stop towards the end of the year and price a new All Time High.
Follow us, like the idea and leave a comment below!!

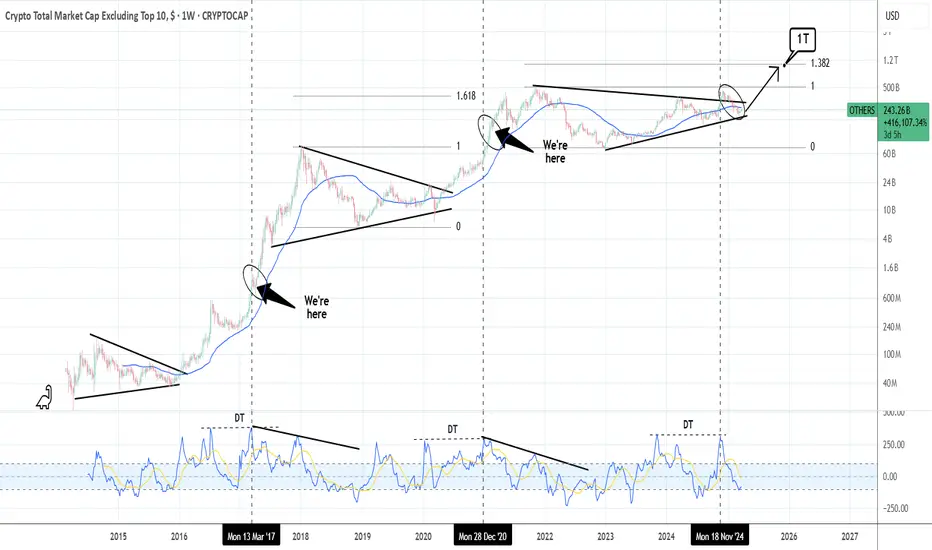
ALTSEASON: Is it really just around the corner?The Crypto Total Market Cap (excluding the Top 10) seems to agree. And it's simply because the price has already broken past the Cycle's Triangle and despite the correction, remains supported on the HL bottom trendline. According to the 1W CCI we are currently well in line with the previous two Cycles and even though the market is unlikely to reproduce the strong returns of especially the first Cycle, it does suggest that there is one last (All Time) High left. A mere 1.382 Fibonacci extension test, will give us the much sought 1 Trillion USD target.
## If you like our free content follow our profile to get more daily ideas. ##
## Comments and likes are greatly appreciated. ##
BTCUSD: What if it's just a Channel Up to $175k?Bitcoin remains neutral on its 1D technical outlook (RSI = 51.175, MACD = -714.800, ADX = 31.665) as it is stuck between the 1D MA50 and 1D MA200 but it's the wider timeframes that are particularly critical right now and more specifically the 1W, which is causing the current rebound on the 1W MA50. We can argue that the pattern since the Dec 2017 Top is a Channel Up, even though the last Bear Cycle bottom didn't make exact contact with its bottom.
We can equally however assume that the new Cycle High won't make direct contact with the Channel's Top either. And that's also backed up technically by the Fibonacci levels of the previous Cycle, which saw BTC making a Top just over the 1.618 Fib extension. Consequently we can assume the new Top to hit at least $175,000 (Fib 1.618 currently). The bullish wave is also a direct Channel Up since the November 2022 bottom after all. Even on the previous Cycle, if we exclude the COVID crash price distortion, the bullish wave was a Channel Up as well.
## If you like our free content follow our profile to get more daily ideas. ##
## Comments and likes are greatly appreciated. ##

SUI ANALYSIS🚀#SUI Analysis :
🔮As we can see in the chart of #SUI that there is a formation of "Falling Wedge Pattern". In a daily timeframe #SUI broke out the pattern. Expecting a bullish move in few days if #SUI retest the levels
⚡️What to do ?
👀Keep an eye on #SUI price action. We can trade according to the chart and make some profits⚡️⚡️
#SUI #Cryptocurrency #TechnicalAnalysis #DYOR

SOLUSD: Bottom formation in process. Target 350.Solana just turned neutral on its 1D technical outlook (RSI = 48.726, MACD = -4.803, ADX = 29.746) as it is approaching the 1D MA50 following a strong rebound on both the S1 Zone but more importantly the 1W MA100. Straight after the low, the market formed a 1D Death Cross. The previous such pattern (September 6th 2024) was formed again on a market low on the S1 Zone. Whether the rebound takes effect immediately or 2 months (max) after, we see this as a great buy opportunity to aim at the HH Zone and the 2.618 Fibonacci extension (TP = 350.00).
## If you like our free content follow our profile to get more daily ideas. ##
## Comments and likes are greatly appreciated. ##

XRP ANALYSIS🔮#XRP Analysis 💰💰
#XRP is trading in a symmetrical triangle in a weekly time frame and if it breakouts with high volume then we can see a bullish momentum in #XRP. Before that we will see little bit bearish movement towards its support zone and that a bullish movement.
🔖 Current Price: $2.3520
⏳ Target Price: $2.9740
⁉️ What to do?
- We can trade according to the chart and make some profits in #XRP. Keep your eyes on the chart, observe trading volume and stay accustom to market moves.💲💲
🏷Remember, the crypto market is dynamic in nature and changes rapidly, so always use stop loss and take proper knowledge before investments.
#XRP #Cryptocurrency #Pump #DYOR
