march rally coming for bitcoin BTCUSD BTC!Bitcoin's price action is also influenced by broader financial cycles and patterns that are more subtle.
Here's a look at those:
General Financial Cycles:
Market Sentiment Cycles:
Like all financial markets, Bitcoin experiences cycles of fear and greed. These psychological waves drive price fluctuations, with periods of euphoria leading to overbought conditions and subsequent corrections.
These cycles are often amplified in the cryptocurrency market due to its 24/7 nature and the prevalence of social media.
Economic Cycles:
Bitcoin's performance can be influenced by macroeconomic trends, such as inflation, interest rates, and global economic growth.
In times of economic uncertainty, some investors may turn to Bitcoin as a hedge against traditional assets. Conversely, during periods of strong economic growth, capital may flow into more traditional investments.
Adoption Cycles:
Bitcoin's adoption by individuals and institutions follows a pattern of gradual growth, punctuated by periods of rapid acceleration.
As adoption increases, liquidity improves, and the market becomes more mature, which can influence price volatility and long-term trends.
"Secret" or Less Obvious Bitcoin Cycles:
On-Chain Data Cycles:
Analysis of Bitcoin's blockchain data reveals patterns in investor behavior, such as accumulation and distribution phases.
Metrics like:
Hodl waves: which track the age of bitcoin held in wallets.
Entity adjusted dormancy: which shows when older coins are being moved.
These can give indications of underlying cycle activity.
Liquidity Cycles:
The flow of liquidity into and out of the Bitcoin market can create its own cycles.
Periods of high liquidity can fuel price increases, while periods of low liquidity can exacerbate price declines.
The availability of stablecoins, and the actions of large market makers, effect these cycles.
Technological Adoption Cycles:
The development and adoption of layer 2 solutions, and other technological improvements to the bitcoin network, can create their own cyclical impacts on the bitcoin price.
These cycles are less predictable, but can have profound long term effects.
It's important to understand that these cycles are interconnected and can overlap, making it challenging to isolate their individual effects. Additionally, the cryptocurrency market is still relatively young, and its cycles may evolve over time.
Cryptocurrency

BITCOIN IDEA
After retest price FVG and level 70 of FIBO and liqudity taken of 2 previous weekly low we will see a reversal to taken liqudity buyside at 109312

BTC ANALYSIS🔮 #BTC Analysis
💲💲 #BTC is trading in a Symmetrical Triangle Pattern. If the price of #BTC breaks and sustain the higher price then will see a pump. Also there is an instant strong support zone. We may see a retest towards the support zone first and then a reversal📈
⁉️ What to do?
- We have marked crucial levels in the chart . We can trade according to the chart and make some profits. 🚀
#BTC #Cryptocurrency #Support #Resistance #DYOR

DXY (Dollar Index) and Pamp/Dump BTC. Markets Cycles.USA Dollar Index + Bitcoin Pamp/Dump Cycles. Logarithm. Time frame 1 week. Minima and maxima of bitcoin secondary trends are shown. Everything is detailed and shown, including what everyone always wants to know. Cyclicality. Accuracy.
This is what it looks like on a line chart to illustrate simple things.

BITCOIN may take 1 month to form bottom but upside is huge.Bitcoin / BTCUSD is consolidating on the 1 stdev below following February's pullback.
With the 1day RSI rebounding after turning oversold, this reminds us of all the previous major Lows of the current Bull Cycle.
Those took around 1.5 - 2 months to be priced, so don't be susprised if Bitcoin doesn't rise before mid April.
The upside until the end of the year remains huge however and if it 'only' tests again the Mean MM, it can reach $140k.
If it approaches the 1 stdev above, the estimated value can be as high as $180k.
Follow us, like the idea and leave a comment below!!

LINKUSD: forming a bottom on the 1W MA100.Chainlink is neutral on its 1D technical outlook (RSI = 47.039, MACD = -1.130, ADX = 24.859) as it posted a double rebound on its 1W MA100. The long term pattern is a Channel Up and its prior HL bottom was formed just under the 1W MA100. With the 1W RSI rebounding though from oversold levels, LINK is already a great buy opportunity in terms of Risk-Reward, even if the bottom takes the whole month of March to be completed. We expect a new bullish wave to take place around the same +300% range as the previous two. The trade is long, TP = 45.00.
## If you like our free content follow our profile to get more daily ideas. ##
## Comments and likes are greatly appreciated. ##

BTCUSD: Bottom formed. Road to $150k started.Bitcoin has turned neutral on its 1W technical outlook (RSI = 50.811, MACD = -265.000, ADX = 36.155) as it recovered some losses from last week. The most important outcome is that both last week and so far the current one, the 1W candle entered the long term Support Zone comprised of the 1W MA25/MA50 and rebounded over it. This is the Zone that has produced all HL bottoms of the 2 year Channel Up. As the 1W RSI is also about to enter its multiyear Buy Zone, we expect the bottom to be formed within 4-6 weeks max and then start the standard +97.97% rally it printed on all three prior bullish waves. The trade is long, TP = 150,000.
## If you like our free content follow our profile to get more daily ideas. ##
## Comments and likes are greatly appreciated. ##


BITCOIN Same bottom, different year.Bitcoin (BTCUSD) has formed a Triangle pattern of Lower Highs (Resistance) and Higher Lows (Support), following the February 28 Low. The bullish confirmation will be given if the price breaks above its 4H MA200 (orange trend-line) but this already looks like a Bottom formation, similar to the Triangle patterns formed around August 2024 and September 2023.
Those were the major bottoms (so far) of the 2023 - 2025 Bull Cycle and it won't be surprising at all if 2025 has its own now that will drive BTC to its eventual Top towards the end of the year.
Both rallies that followed the 2023 and 2024 Triangle break-outs, reached at least their 1.786 Fibonacci extension. As a result, this gives us a minimum medium-term Target of $120000 in the event the 4H MA200 breaks.
So do you think this is a standard Bull Cycle Triangle bottom formation? And if yes, is $120k the immediate Target? Feel free to let us know in the comments section below!
-------------------------------------------------------------------------------
** Please LIKE 👍, FOLLOW ✅, SHARE 🙌 and COMMENT ✍ if you enjoy this idea! Also share your ideas and charts in the comments section below! This is best way to keep it relevant, support us, keep the content here free and allow the idea to reach as many people as possible. **
-------------------------------------------------------------------------------
💸💸💸💸💸💸
👇 👇 👇 👇 👇 👇

Could Cardano Bulls "Raise The Flag" To $2??COINBASE:ADAUSD has some very interesting Price Action happening with the decline starting from beginning of December 2024 forming what looks to be a Descending Channel with the potential to become a Bull Flag!
With a Bull Flag being a Continuation Pattern, we can expect a higher probability of a Bullish Break to this Channel to continue in the trend it was following prior to falling into this Consolidation Period.
Last week we saw a huge Bullish Candle form and Break the Channel after testing the March 2024 Highs, the 200 EMA @ .7719, along with the Linear Regression or "True Trendline" of the Descending Channel.
Other indicators suggest Bullishness as well with the RSI staying above 50 in Bullish Territory and we can see a large amount of Volume entering this Weekly Candle with 2 days and 19 hours left until Close at the time of publishing.
*If Cardano can continue to find Support and is able to make a Valid Bullish Break of this Channel, based off the "Flagpole" or Rally, prior to price falling into Consolidation, we can expect a potential 120% gain from the Break, potentially sending price up to test the overhead Resistance Zone in the ( $1.85 - $2.15 ) Range!
3/7 - The White House will be holding the very first U.S. Crypto Summit to make plans to start bringing cryptocurrency into a U.S. Crypto Strategic Reserve
www.tradingview.com

Phemex Analysis #65: Pro Tips for Trading XRPIn the dynamic world of cryptocurrency, few narratives are as compelling as that of XRP ( PHEMEX:XRPUSDT.P ), the digital asset developed by Ripple Labs. Once mired in regulatory challenges, XRP is now entering an exciting phase, reshaping its path and sparking renewed discussions about its future potential.
Crypto Strategic Reserve
On March 2, 2025, President Donald Trump announced the creation of the U.S. "Crypto Strategic Reserve," aiming to position the United States as a leader in digital finance. XRP was among the select cryptocurrencies—including Bitcoin, Ethereum, Solana, and Cardano—chosen for this reserve. This announcement sent waves through the market, significantly boosting XRP's value and reaffirming its importance in the cryptocurrency ecosystem.
White House Crypto Summit
Anticipation is building for the upcoming White House Crypto Summit on March 7, 2025. Ripple’s CEO, Brad Garlinghouse, along with other industry leaders, will discuss regulatory frameworks and the integration of cryptocurrencies into the broader financial system. This event is expected to provide insights that could influence XRP's adoption and market dynamics.
These developments mark a pivotal moment for XRP, highlighting Ripple’s evolution from controversy to prominence and underscoring the cryptocurrency’s growing significance in the financial sector.
Possible Scenarios for XRP Price Movement
1. Sustained Bullish Momentum
The inclusion of XRP in the U.S. Crypto Strategic Reserve has bolstered investor confidence. This endorsement may attract institutional investors, increasing demand and potentially driving XRP's price higher. If the White House Crypto Summit results in favorable regulatory outcomes, XRP could experience sustained bullish momentum.
Pro Tips:
Monitor Institutional Involvement and Regulatory Developments: Positive news in these areas can further fuel XRP's bullish momentum.
Key Resistance Levels: A breakout above $2.65 could signal a bullish run, with a move above $3.00 on high volume confirming this trend.
2. Profit-Taking and Short-Term Correction
After recent gains, some investors might take profits, leading to a short-term price correction. This is common following rapid price increases as traders seek to realize gains.
Pro Tips:
Identify Support Levels: Key support levels include $2.12, $1.95, $1.76, and $1.35, where buying interest may resume.
Consider Staggered Entries: To mitigate volatility, consider placing buy orders at various support levels. Utilizing Phemex's scaled orders feature can streamline this process.
3. Regulatory Uncertainty Leading to Volatility
While the summit aims to provide regulatory clarity, outcomes perceived negatively by the market could lead to increased volatility. Uncertainty in regulatory developments can cause rapid price fluctuations as investors react to new information.
Pro Tips:
Implement Risk Management Strategies: Use stop-loss orders and appropriate position sizing to protect against adverse price movements.
Diversify Investments: Avoid overexposure to XRP by diversifying your cryptocurrency holdings to manage risk effectively.
Final Thoughts
XRP's inclusion in the U.S. Crypto Strategic Reserve and the upcoming White House Crypto Summit have positioned it at a critical juncture. Traders should stay vigilant, keeping informed about institutional developments and regulatory changes that could impact XRP's price. By considering the scenarios outlined above and implementing sound risk management practices, traders can navigate the evolving landscape of XRP trading with greater confidence.
Tips:
🔥 Break free from "buy low, sell high"! Our new Pilot Contract empowers you to profit from ANY market direction on DEX coins with up to 3x leverage. Go long, go short, go further!
Check out Phemex - Pilot Contract today!
Disclaimer: This is NOT financial or investment advice. Please conduct your own research (DYOR). Phemex is not responsible, directly or indirectly, for any damage or loss incurred or claimed to be caused by or in association with the use of or reliance on any content, goods, or services mentioned in this article.

The US Dollar Index is Decreasing - Positive for Cryptocurrency#DXY #Analysis
Description
---------------------------------------------------------------
+ The Dollar Index has breached its support level and is now trading below it, moving toward the next support zone around $100.
+ This development is positive for Bitcoin and the broader cryptocurrency market, as the US Dollar Index typically declines during a bull run.
+ In the long term, I anticipate further declines, potentially reaching the $90 range.
---------------------------------------------------------------
Enhance, Trade, Grow
---------------------------------------------------------------
Feel free to share your thoughts and insights. Don't forget to like and follow us for more trading ideas and discussions.
Best Regards,
VectorAlgo

DOGE Strong BUY. Next stop $0.90Dogecoin / DOGEUSD is trading inside a Channel Up for exactly 1 year and the price is currently very close to its bottom.
The bearish wave is under the 1day MA200 with the 1day RSI oversold, which is exactly the conditions that were present on the August 5th 2024 bottom.
This is an excellent long term buy opportunity, potentially the last one that will lead DOGE to its Cycle Top.
The natural technical target is the 1.618 Fibonacci extension, which is what the prior bullish wave targeted.
Buy and target 0.9000.
Follow us, like the idea and leave a comment below!!

BITCOIN and the People's Bank of China Liquidity.Bitcoin / BTCUSD is often correlated with traditional assets that can be easily related to like the USD, stock indices etc.
On this idea we introduce the Liquidity of the People's Bank of China and as you can see there is a strong correlation between the two.
Every time China's central bank pumps money into the markets, BTC enters a strong Bull Phase. On the contrary, when it starts tightening, BTC enters a Bear Phase.
For the past two years we've been inside a Bull Cycle. Towards the end of 2025, the Liquidity should have topped based on the Time Cycle tool, and that should be our signal to exit the market with the highest profit possible in this Cycle.
Follow us, like the idea and leave a comment below!!

SUIUSD: 1W MA50 holding. Excellent long term buy opportunity.SUI is bearish on its 1D technical outlook (RSI = 43.481, MACD = -0.255, ADX = 17.753) as it is on a decline since the early January top. This is technically the bearish wave of the cyclical Channel Up and the Jan top was its HH. This is so far a -58% decline that almost tested the 1W MA50. This is same kind of decline after the previous HH of late March 2024. The July break under the Channel Up was a market overreaction but now since we are in the final year of the Bull Cycle, it is very unlikely to see another one. Quite possibly, as long as the 1W MA50 holds, it is more probable to gradually initiate the 3rd bullish wave of the Channel Up. Aim for a similar +500% rise, TP = 12.000.
## If you like our free content follow our profile to get more daily ideas. ##
## Comments and likes are greatly appreciated. ##

BTCUSD: Historic comparison shows hyper rally about to begin.Bitcoin turned neutral again on its 1D technical outlook (RSI = 55.581, MACD = 979.600, ADX = 19.348) as it recovered last week's selloff and rebounded on its 1D MA200. Technically the pattern since 2024 is identical to 2020 as you can see on the chart above. The moment Bitcoin crossed again above its 1D MA50, a new hyper rally started. This suggests that a final target inside the 160,000 - 200,000 Zone is quite possible to take place.
## If you like our free content follow our profile to get more daily ideas. ##
## Comments and likes are greatly appreciated. ##

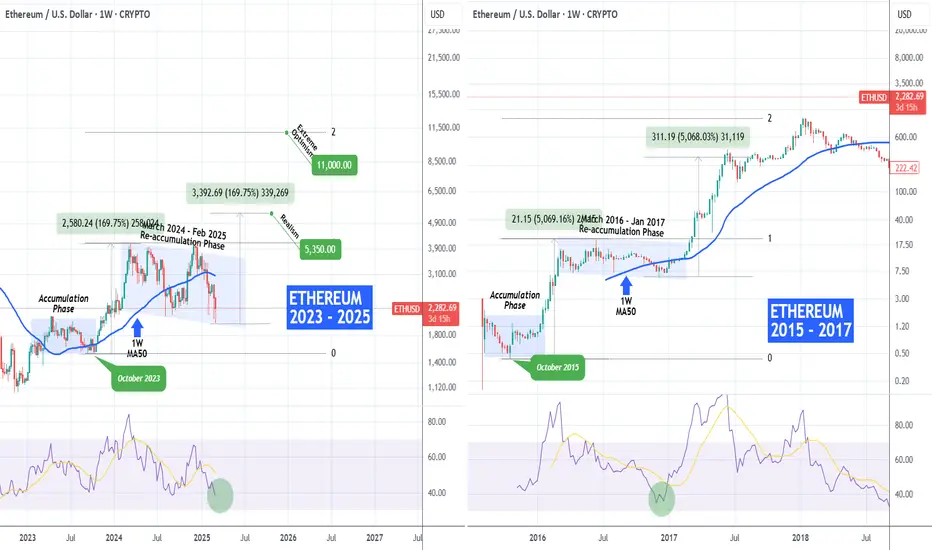
ETHEREUM Is a massive rally about to begin?Ethereum (ETHUSD) started the week lower but is attempting a closing near last week's candle close. Still below its 1W MA50 (blue trend-line) but the practically ranged price action of the past 12 months (March 2024 - Feb 2025) may be a Re-accumulation Phase similar to ETH's first Cycle when between March 2016 - Jan 2017 it consolidated but then started a massive rally until the end of the year.
As you can see, the two fractals are fairly similar, both starting with an initial Accumulation Phase. In the 2015 - 2017 Bull Cycle, the rally that followed the October 2015 Low was fairly symmetrical (+5069%) with the rally that followed the Re-accumulation Phase's bottom. The Cycle Top was priced higher on the 2.0 Fibonacci extension.
If ETH keeps replicating this past fractal, we can expect a more realistic Target at $5350 (+169.75% rise) and an extremely optimistic at $11000 (Fib 2.0 extension).
-------------------------------------------------------------------------------
** Please LIKE 👍, FOLLOW ✅, SHARE 🙌 and COMMENT ✍ if you enjoy this idea! Also share your ideas and charts in the comments section below! This is best way to keep it relevant, support us, keep the content here free and allow the idea to reach as many people as possible. **
-------------------------------------------------------------------------------
💸💸💸💸💸💸
👇 👇 👇 👇 👇 👇
Bearish until 98-100K Morning folks,
So, Old Donny euphoria was over on the next day, as we've suggested. ETH was even worse than BTC...
And we're skeptic on coming Crypto Summit tomorrow. What could happen in three days? A lot of speech and empty promises definitely will sound, but where the real deals? Recently. S. Lummis said that BTC Reserve issue is still under question and no guarantees that it will be formed. That's it... Nothing is prepared for BTC Reserve forming. Coming D. Trump talks could shake the market, but that will be only emotions.
Speaking practically, we suggest that until BTC stands under 98-100K area - context remains bearish. We see a few patterns, and this butterfly one of them. If you want to go short - this is the point that you have to think about. Based on the butterfly, the risk is not too big.
If even we will get "222" Sell - setup remains bearish, because upside AB=CD agrees with daily Fib resistance level. Only upside breakout of 98-99K will give BTC theoretical chances to start wobbling in 100-108K range.
Thus, for now we're not ready to speak about BTC buying. Albeit you want to make a bet on Summing euphoria tomorrow.

(ETH) ethereum "sliding scale"A view of Ethereum per the indicator I use the most, moving average with increments of a year, and symbols to determine the crossover/under patterns. dots are bad, plus signs are good generally based on the indicator.

LayerZero Hits Bottom: Good News (Easy 630% Target)Bitcoin turns bullish, after months of sideways and a final flush. This is happening in a bull-market year, 2025. It is safe to safe that Crypto is going up.
When Bitcoin turns bullish, everything grows.
What one does, the rest follows.
LayerZero was made available for trading in June 2024. The action started bullish right away, an entire month. This was followed by a sideways period and then a weak higher high. In early 2025, a major correction developed, timed with Bitcoin's final flush. Bitcoin is moving ahead now and LayerZero, ZROUSDT, is now in the process of printing a double-bottom on the weekly timeframe. Surely a bullish signal.
This week wicked below the 3-Feb. week low. A recovery from the lowest price possible is happening and now the action moves above the previous low. This is the purple line on the chart.
As long as ZROUSDT trades above this line the bulls are active and getting ready to move ahead. The fact that volume is super low and continues to drop every week is a bullish signal. It is the end of the bearish wave.
This is potentially a bottom catch. Growth will start happening in a matter of days. We can expect long-term growth. Easy targets amount to 142% and 387%. A stronger target, still easy but will take longer to reach, sits at $16.5 and can yield a total of 630%.
Solid chart. Good risk reward ratio. Can turn into easy profits based on a stress free buy and hold strategy. We are going up and we are going LONG.
The Altcoins market is waking up and will soon start to heat up. Three weeks from now, instead of extreme fear we will have an euphoric market as everything grows.
Prepare for the 2025 bull-market bull-run.
Thanks a lot for your continued support.
If you enjoy the content, consider hitting a follow.
You can request analysis for your favorite Altcoins in the comments section below.
Namaste.

Univers Of Signals | JUPLet's quickly review JUP, one of the DeFi coins, which is currently ranked 51st on CoinMarketCap with a market cap of $1.75 billion.
🔍 In the 4-hour timeframe, we are observing a very large range box from 0.6312 to 1.2542, where JUP is currently at the bottom of its box.
✨ There is also a descending channel that has been accompanying the price from the top of the box, with several touches to both the bottom and top of the box, and now it has approached the bottom of the box again.
📉 If the area of 0.6312 is breached, you can enter a short position targeting 0.5588. Entry of the RSI into the oversell zone would provide a suitable confirmation for this move.
📈 For a long position, wait until the channel is broken upwards, and in this case, with the breakout of the trigger at 0.8365, you can enter a long position.

BITCOIN Like a well tuned Swiss clock...Bitcoin (BTCUSD) has had a red February with a correction that touched its 1D MA200 and almost hit the 1W MA50 (blue trend-line), spurring massive liquidations and ETF outflows. On the wider picture though and the long-term technical trend of this Cycle, this looks nothing more than a normal technical pull-back at the start of the last year of the Bull Cycle.
More specifically, since the start of the current Bull Cycle following the November 2022 market bottom, BTC has been replicating to almost perfection the 2015 - 2017 Bull Cycle. As this chart on the 1W time-frame shows, every medium-term top and bottom since July 2023, matches harmonically the tops and bottoms since July 2015.
In addition, the 1W RSI is now on its 2nd bottom of the 'Buy the dip Volatility Phase', which started after the Higher Lows trend-line that was initiated on the market bottom, peaked and turned sideways. In 2016 - 2017, that was the ultimate guide to buy low through Bitcoin's last year of Bull Cycle all the way to the Top.
Based on this analogy, BTC should now form a Channel Up that might form the next Higher High in June, pull-back in July, then new Higher High in August, pull-back in September and final push for a Cycle Top around November. Based on this pattern, this may very well be around $200k but again, a 1W RSI top sell signal is more fitting.
But do you think the market will continue replicating the 2015 - 2017 Bull Cycle all the way to the top? And if yes, is a $200k peak plausible? Feel free to let us know in the comments section below!
-------------------------------------------------------------------------------
** Please LIKE 👍, FOLLOW ✅, SHARE 🙌 and COMMENT ✍ if you enjoy this idea! Also share your ideas and charts in the comments section below! This is best way to keep it relevant, support us, keep the content here free and allow the idea to reach as many people as possible. **
-------------------------------------------------------------------------------
💸💸💸💸💸💸
👇 👇 👇 👇 👇 👇

BtcUsd is going to 120k/130k!What I see!
Looking for impulse up.
BtcUsd is going to 120k/130k after a bit more retracement. It might retrace to maximum 90k to 80k. It's important to have your own rules on RR and adhere to them. This trading idea is intended to assist you and enhance your knowledge. If you have any questions, please ask me in the comments.
Learn & Earn!
Wave Trader Pro
