MIGGLES/USDT THE BREAK RETURN TO THE MOONMIGGLES/USDT THE BREAK RETURN TO THE MOON
We are following with live data on this coin for the next volume trend, which can have a break in the coming time.
At this moment, this coin is showing signs of an increase. When it gets confirmed, we will follow it with live updates.
Cryptocurrency

PRCL/USDT NEW INCREASE VOLUMEPRCL/USDT NEW INCREASE VOLUME
it shows new volume depending on the 1H volume. Since this unexpected volume, there isa new follow for this coin.

FLOKI ANALYSIS🔮 #FLOKI Analysis 🚀🚀
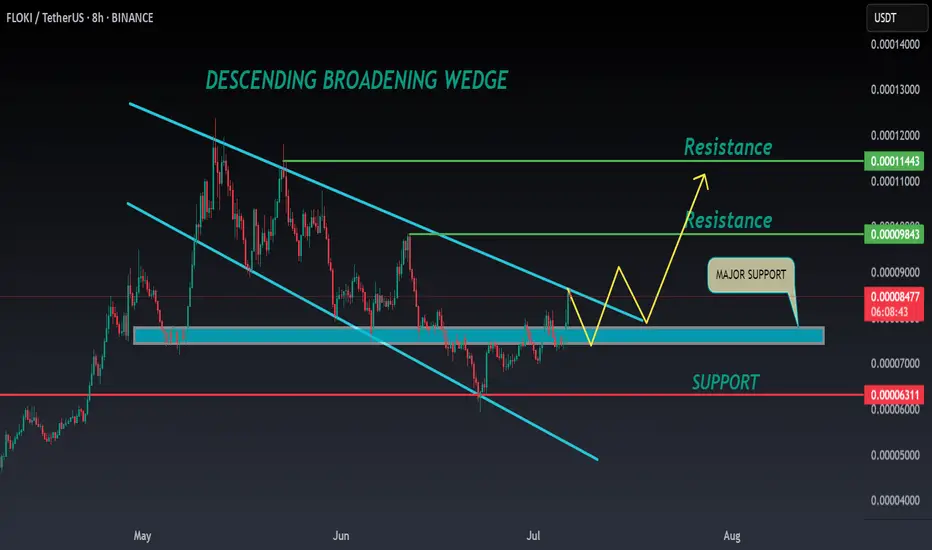
💲💲 #FLOKI was trading in a Descending Broadening Wedge Pattern, and trying to breakout the pattern. Also there is a instant support zone and after the breakout of resistance zone we will see a bullish move. 📈📈
💸Current Price -- $0.00008540
📈Target Price -- $0.00009840
⁉️ What to do?
- We have marked crucial levels in the chart . We can trade according to the chart and make some profits. 🚀💸
#FLOKI #Cryptocurrency #Breakout #DYOR
ES, SPY, SPX will be testing key support on Sunday After a welcome rally into new highs for the s&p, there appears to be a critical crossroad forming. Using the ES continuous contract I have placed 2 anchored VWAP's. The first being anchored to the last higher low on Thursday, June 19. And the the second, being anchored to this last Thursdays high on July 3rd.
For this post we will call the anchor from June 19 - VWAP1. And for the July 3rd anchor - VWAP2
VWAP1 r1 has acted as a key support line since the higher low was set. Successfully bouncing and holding support several times.
As we headed lower on this Thursdays July 3rd session, we remained between the center and r1 of VWAP2 indicating strong selling pressure for the day. With it being a shortened trading day with less liquidity however, I have less concern over the days price action. The forming crossroads and the upcoming Sundays open will be more telling for where we likely head this week.
The blue Horizontal Line at 6266 is placed directly on VWAP1s r1 (green line) which has acted as support. If we trade into this level on the Sunday open, it's a clear signal the sellers are still in control. If however, price can consolidate at that level (6266) and form structure, a breakout of the structure would be evidence of sellers backing off and buyers stepping in creating a good buying opportunity for the week.
Another possible scenario, if we first manage to trade up into s1 of VWAP2 (orange line) around the 6300 level, I will be looking for a short scalp down to the r1 of VWAP1 at 6266. From here it would be prudent to sit and wait for more confirmation on if this is a reversal, or just another pullback in the uptrend.
These are my two trade setups and ideas for Sunday's open. Hope this analysis helps. Happy trading 🤙💰📈

KAIAUSD Buy this level for a bullish continuation.Kaia (KAIAUSDT) is pulling back towards its 1W MA50 (blue trend-line) for a technical re-test of its natural long-term Support.
We think it will be a January 2024 type of test, with a breach and subsequent rebound to test the Resistance and potentially a 1W MA200 (orange trend-line) test. Target 0.32000.
-------------------------------------------------------------------------------
** Please LIKE 👍, FOLLOW ✅, SHARE 🙌 and COMMENT ✍ if you enjoy this idea! Also share your ideas and charts in the comments section below! This is best way to keep it relevant, support us, keep the content here free and allow the idea to reach as many people as possible. **
-------------------------------------------------------------------------------
💸💸💸💸💸💸
👇 👇 👇 👇 👇 👇

TAIKO/USDT NEW INCREASE VIEWThe latest data shows that this coin is entering a new uptrend, which can be confirmed in the coming time frames, see the last update.
In trading, it's about building a real, confirmed trend, starting with building and holding levels.
The keys are: Start of a new cycle, start of new smart money
This coin is at the first level of scan, and time frames should confirm if it's an interesting coin or not. Until now, there is no confirmation; only the first scan shows it can be interesting.
* This coin is a high-risk coin.

ETH could be about to rip into a short-term rallyWhile the stock market has seen surprising upside in the past weeks (presumably due to pricing in rate cuts / a more positive liquidity picture / high expectations for Q2), crypto has lagged behind. I don't believe anything significantly above current prices - no matter in which market - is sustainable for now, but we can certainly milk it for whatever it's worth.
Notably, BTC has shown way more resilience and dominance in the current cycle so far. This makes sense in a high interest environment. However, within the bias of the markets pricing in expectations for rate cuts and as such more liquidity, we could also assume that demand for assets other than "safe havens" would now increase as well, leading us to the biased conclusion that we could see altcoins wildly outperforming BTC over the next weeks.
Indeed, if we look at the BTC chart, technicals such as VWAP stddevs show significantly less potential for upside if compared to ETH in the current moment in time. We therefore would focus on ETH at this point (as money flow seems to cycle BTC->ETH->Others).
PLEASE NOTE: SL and TP are not accurate. This is not a precise trading idea. Please use your own judgement in accordance with your trading style.

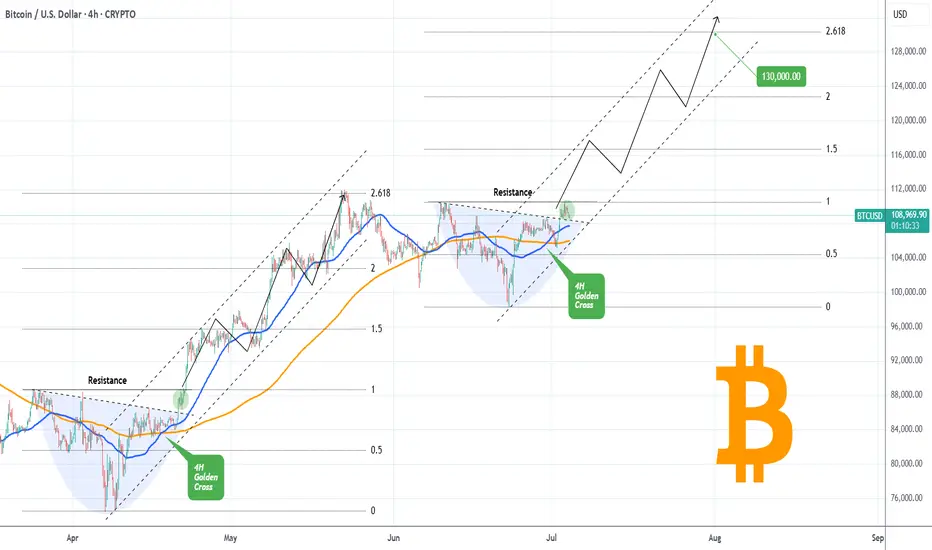
BITCOIN Golden Cross going to slingshot it to $130kBitcoin (BTCUSD) has completed a Golden Cross on the 4H time-frame and is attempting to keep the 4H MA50 (blue trend-line) as Support. If successful, it has high probabilities of staging a Channel Up similar to April - May, which peaked on the 2.618 Fibonacci extension.
So far, the bases of those to fractals are virtually identical, with a Lower Highs trend-line initially acting as a Resistance, which broke and on the current one it is testing the final Resistance (dotted trend-line).
This is the green circle, which on April 21 staged a quick consolidation before breaking aggressively upwards. If the pattern continues to repeat itself, we can get $130k (Fib 2.618 ext) at the end of the Channel Up.
Do you think it will? Feel free to let us know in the comments section below!
-------------------------------------------------------------------------------
** Please LIKE 👍, FOLLOW ✅, SHARE 🙌 and COMMENT ✍ if you enjoy this idea! Also share your ideas and charts in the comments section below! This is best way to keep it relevant, support us, keep the content here free and allow the idea to reach as many people as possible. **
-------------------------------------------------------------------------------
💸💸💸💸💸💸
👇 👇 👇 👇 👇 👇
Ethereum Trading Strategy: 5:1 Risk-to-Reward Ratio"Ethereum Showing Strength on the 4-Hour Chart — A New Bullish Trend Emerging?"
The 4-hour timeframe is starting to show strong bullish momentum. Could this be the beginning of a new uptrend?
A potential 5:1 risk-to-reward setup is forming:
Entry: 2,620
Stop Loss: 2,364
Target: 4,062
Support 2500 must hold!!!

BTC Setup: 2.7 R:R"Bitcoin Poised for New Uptrend After Bull Flag Breakout Retest"
Bitcoin appears ready to begin a new uptrend after successfully retesting the breakout from a bull flag pattern and completing consolidation above key support.
This setup offers a 2.7:1 risk-to-reward ratio, with the following trade parameters:
Entry: $109,965.79
Stop Loss: $106,300
Target: $120,000
BTCUSD 4hr Technical Analysis : Rejects $110K - Next TargetsOverview:
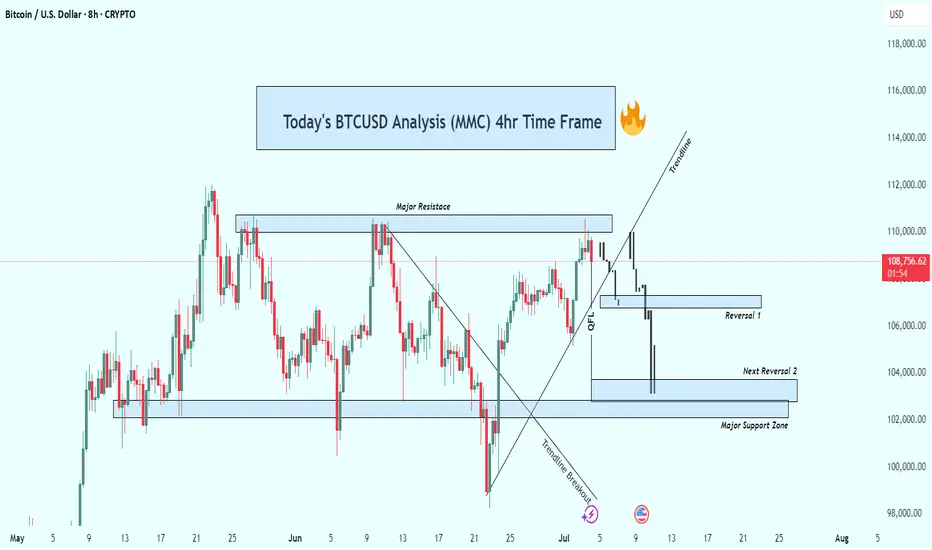
Bitcoin is currently undergoing a significant technical correction after rejecting a strong resistance level. The 4-hour chart shows a decisive bearish breakdown, suggesting that the bulls are losing control and sellers are gaining momentum. As the price continues to fall, all eyes are now on the major support levels that could trigger a potential reversal—or further acceleration to the downside.
📊 Technical Breakdown:
1. Major Resistance Zone (~$110,000 – $111,000):
This zone has acted as a strong supply area, where price has repeatedly failed to break through. Multiple rejections from this zone confirm it as a key distribution area, where large sellers are stepping in. The repeated failure to close above it shows market exhaustion at the highs.
Multiple candle wicks and strong bearish closes around this area.
Bull traps occurred after brief moves above this resistance, followed by sharp sell-offs.
2. Trendline Breakout:
Previously, BTC had been respecting a rising ascending trendline, which served as dynamic support throughout the last rally. Recently, price broke below this trendline with strong bearish momentum.
This marks a break in market structure.
The trendline retest acted as resistance—textbook confirmation of the trend shift.
3. QFL (Quantity Following Line) Breakdown:
The QFL zone, typically a bullish defense level, has failed to hold. This breakdown confirmed that bulls lost a critical level of control.
Price briefly retested the QFL from below before continuing downward.
This zone now acts as resistance, reinforcing the bearish outlook.
🔻 Downside Targets & Reversal Zones:
✅ Reversal Zone 1 (~$106,000):
This minor support level provided minimal reaction and was quickly breached.
Lack of volume or candle confirmation suggests weak buying interest here.
✅ Next Reversal Zone 2 (~$104,000):
This zone has historical importance as a short-term demand area.
Monitor closely for bullish candlestick patterns, volume spikes, or bullish divergences to assess potential bounce scenarios.
✅ Major Support Zone (~$102,000 – $100,000):
This is the most critical level in the near term.
Historically, price has reversed strongly from this zone, indicating strong buyer interest.
If price breaks and closes below this level, expect a high-probability continuation towards the $98,000 psychological level or lower.
🧠 Market Psychology:
The breakdown from the trendline and QFL indicates panic or profit-taking.
Many late long positions are likely being liquidated.
Smart money may be waiting at the $100K zone to accumulate, depending on market conditions and macro factors.
🎯 Trading Strategy Ideas:
🛑 For Bears (Shorts):
Stay short below $110K resistance.
Trail stop-loss above QFL zone or trendline breakdown.
Look to take profit at $104K and $102K zones.
Add to positions on confirmed bearish retests of broken supports.
📈 For Bulls (Longs):
Wait for clear confirmation (e.g., bullish engulfing, double bottom, RSI divergence) near $104K or $102K before entering.
Avoid catching falling knives—patience is key.
Consider scaling in with smaller position sizes and tight stops.
Watch for a reclaim of the QFL zone or a strong bounce from the $100K psychological level.
🧭 Bias: Bearish
Structure: Lower highs & lower lows.
Momentum: Selling volume increasing, bulls losing steam.
Invalidation: A strong daily close above $111K would flip bias back to neutral/bullish.
🧩 Final Thoughts:
Bitcoin is currently in a fragile state as it retraces from a failed breakout. With multiple key support zones ahead, the next few sessions will be critical in determining whether bulls can reclaim control or if we see deeper downside movement. Watch for signs of exhaustion from sellers or fresh accumulation zones to position accordingly.
Ethereum in JULYEthereum should close above $3000 by the end of July to stay in the bull run, Monthly candle is so important now.

SUI Historic Pitchfork targets $10 at least!Sui (SUIUSD) has been staging a bounce attempt on its 1W MA50 (blue trend-line) since last week and if the current 1W candle closes in green, it will be the first 2-week green streak of Sui since March 24.
There are high probabilities of a sustainable rebound here, that may very well turn into a strong parabolic rally, similar to those of August - December 2024 and October 2023 - March 2024.
The reason is that the price hit and is staging this rebound attempt on the 0.786 level of the Pitchfork, which is where it started the April 07 2025 rally.
If we repeat the 'shortest' of those parabolic rallies (+492.14%), then we should hit $10.00 at least, which will also test the 0.236 level of the Pitchfork.
-------------------------------------------------------------------------------
** Please LIKE 👍, FOLLOW ✅, SHARE 🙌 and COMMENT ✍ if you enjoy this idea! Also share your ideas and charts in the comments section below! This is best way to keep it relevant, support us, keep the content here free and allow the idea to reach as many people as possible. **
-------------------------------------------------------------------------------
💸💸💸💸💸💸
👇 👇 👇 👇 👇 👇

ADAUSD Is this 1W Golden Cross what the market needs??Cardano (ADAUSD) just formed a 1W Golden Cross this week, the first in its history, amidst a continuous bearish sequence since the December 02 2024 High. With its 1W RSI just below neutrality, this simply highlights the undervalued condition of this token relative not only to the rest of the high cap market, but also to its previous Bull Cycle.
As you can see, based both on 1W RSI and price action terms, we may be in a consolidation phase similar to September - November 2020, at the end of a Megaphone pattern. That pattern was the Accumulation vessel of the Cycle that led to the massive 2021 parabolic rally and the eventual Cycle Top / Higher High of the historic Channel Up.
According to that, we should be expecting a 1.236 Fibonacci extension test, targeting $5.000.
-------------------------------------------------------------------------------
** Please LIKE 👍, FOLLOW ✅, SHARE 🙌 and COMMENT ✍ if you enjoy this idea! Also share your ideas and charts in the comments section below! This is best way to keep it relevant, support us, keep the content here free and allow the idea to reach as many people as possible. **
-------------------------------------------------------------------------------
💸💸💸💸💸💸
👇 👇 👇 👇 👇 👇

TRBUSDT Setup – Staggered Exits, Smart Profits📌 Entry: 36.70
🎯 TP1: +10% → Secure 50% of position
🛡️ Move to risk-free after TP1 to protect capital
🎯 TP2: Take 50% of remaining volume
🎯 TP3: Close all remaining volume
Calculated exits. Risk-managed. Momentum-ready.

Crypto Market Completes A Correction Within Bullish TrendGood morning Crypto traders! We got a nice bounce and recovery in the Crypto market along with stock market rally after US President Donald Trump announced that Iran and Israel had agreed to a ceasefire, calling the conflict “The 12-Day War.”. Crypto TOTAL market cap chart now shows that correction is completed, support is in place and bulls back, so more upside can be seen in upcoming days/weeks, just be aware of short-term intraday pullbacks.

BITCOIN now starts ascent to $150k.Bitcoin (BTCUSD) closed last week with a strong green 1W candle, recovering all loses and has started the current one with a stable rise. As stable as the whole Bull Cycle has been so far since the November 2022 market bottom.
The current uptrend is the technical Bullish Leg that has always emerged the Triple Support Combo of the 1W MA50 (blue trend-line), 0.5 Fibonacci retracement level and former Resistance, turned Support (Pivot).
As you can see, this has happened 2 times already and this is the 3rd. The previous one peaked a little above the 1.382 Fibonacci extension, which gives us an immediate Target on a 2-month horizon at $150000. This confirms a number of previous studies we conducted, all leading towards this price or around it.
So do you think all roads lead to $150k? Feel free to let us know in the comments section below!
-------------------------------------------------------------------------------
** Please LIKE 👍, FOLLOW ✅, SHARE 🙌 and COMMENT ✍ if you enjoy this idea! Also share your ideas and charts in the comments section below! This is best way to keep it relevant, support us, keep the content here free and allow the idea to reach as many people as possible. **
-------------------------------------------------------------------------------
💸💸💸💸💸💸
👇 👇 👇 👇 👇 👇

Wait for something more reliableMorning folks,
Since our last update action was anemic. Nothing has changed seriously. BTC was able to show just minor upside action. Based on current performance, I do not want to take long position right here and prefer to wait for something more reliable. Because BTC action stands rather different from the one that we expected to see.
For example it might be H&S pattern on 1H chart. Thus, an area around 103K seems the one that we will keep an eye on.

(DEEP) deepbook "new to kraken" Noticed this being new, slipped past me noticing. Publicly known now.

ADA/USDT : Get Ready for another Bullrun (READ THE CAPTION)By analyzing the #Cardano chart on the 3-day timeframe, we can see that the price is currently trading around $0.59. After sweeping the liquidity below $0.51, our bullish outlook for the next upward wave has strengthened significantly.
I'm now expecting a strong move from ADA, with short-term targets at $0.61 and $0.76, and longer-term targets at $0.93, $1.05, and $1.33!
Please support me with your likes and comments to motivate me to share more analysis with you and share your opinion about the possible trend of this chart with me !
Best Regards , Arman Shaban

BTC Weekly Analysis : Rise or Fall ? Let's SeeBy analyzing the #Bitcoin chart on the weekly timeframe, we can see that last week’s candle closed at $108,350, and BTC is currently trading around $107,500. If the price manages to hold above $105,700, we could expect further upside momentum. The next potential bullish targets are $111,700, $124,000, and $131,800.
So far, this analysis has yielded over 9% return, and we’ll be sharing more updates soon from lower timeframes!
🎥 If you enjoyed this video analysis and found it helpful, please show your support with a LIKE and COMMENT below!
These video-style breakdowns take time and effort, and I’ll only continue them with your support 🙌
Your engagement is my biggest motivation to keep going 💛
Thanks for being part of the journey!

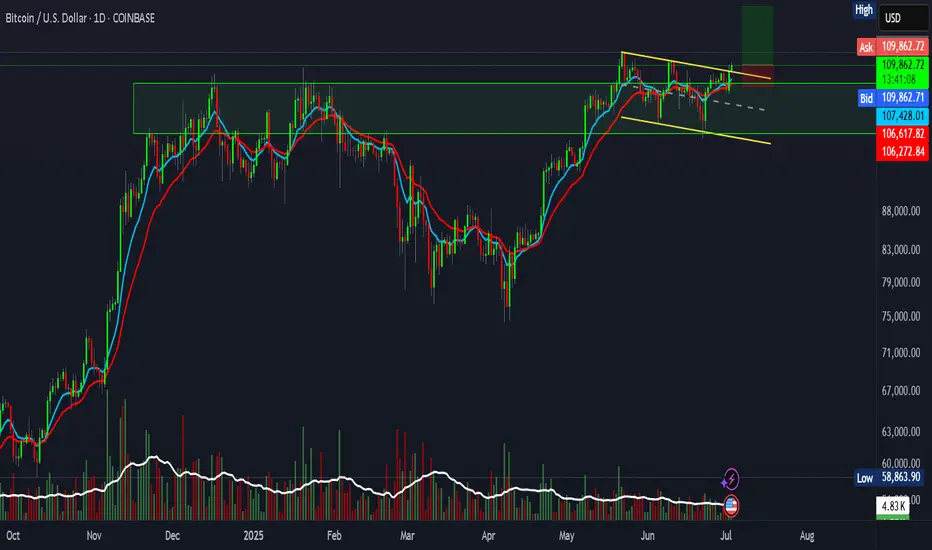
BITCOIN Bull Cycle's next two probable stops..Bitcoin (BTCUSD) has been trading within a 2.5-year Channel Up throughout the entirety of its 2023 - 2025 Bull Cycle, showcasing incredible consistency. This is perhaps BTC's most stable Bull Cycle and that can help us estimate to some degree its next two key levels, before its tops.
As you can see, every major Higher High of this pattern has been either on or marginally above a +0.5 Fibonacci interval:
Fib 0.5 was the February 2023 High and Accumulation Phase.
Fib 1.0 the April - September 2023 Accumulation.
Fib 1.5 December 2023 - January 2024.
Fib 2.0 March - September 2024.
Fib 2.5 December 2024 - February 2025.
Right now the market seems to be attempting a break-out above a Bull Flag, following the massive April 07 2025 rebound on the 1W MA50 (blue trend-line), a level that has been the most optimal buy entry in the past 2 years.
The next stop based on this model is the 3.0 Fibonacci extension level at 133000, where there are high probabilities for the market to consolidate (accumulation phase) in preparation for perhaps the final stop and Cycle peak on the 3.5 Fib ext around 191000. As we've discussed on previous analyses, a final Target between those two around $150000 may be more fitting, carrying less risk into the final months of the Bull Cycle.
So what do you think? Do you believe that's the blueprint to follow until the end of the year/ Cycle? Feel free to let us know in the comments section below!
-------------------------------------------------------------------------------
** Please LIKE 👍, FOLLOW ✅, SHARE 🙌 and COMMENT ✍ if you enjoy this idea! Also share your ideas and charts in the comments section below! This is best way to keep it relevant, support us, keep the content here free and allow the idea to reach as many people as possible. **
-------------------------------------------------------------------------------
💸💸💸💸💸💸
👇 👇 👇 👇 👇 👇

Bitcoin STANDING..bitcoin now is standing on monthly pivot and hold that as the support.
3rd pivot's resistance is at 124k is reachable in few weeks.
