SUIUSD starting rally for a $12 Cycle Top.Sui / SUIUSD is reversing this week into green territory and if the 1week candle closes in gains, it will be a strong bullish signal as it would have rebounded just over the 1week MA50.
The pattern is a Channel Up for this Cycle, pushing the price slowly but steadily upwards.
Like the April 8th 2024 pull back, this week's correction almost touched the 0.5 Fibonacci retracement level, posting a symmetric 1week RSI pattern.
As long as the 1week MA50 continues to hold, we expect the new bullish wave of the Channel Up to start.
Since the December 30th high was on the 1.5 Fib extension, we believe the next one, which will most likely be the Cycle's Top, will also be on that level.
Buy and target 12.000.
Follow us, like the idea and leave a comment below!!
Cryptocurrency

We Are Almost Back!Over the past few days (January 30th - February 4th), the "whales" tore up XRP but the good news we are almost back. During the first few days, we experienced a 32.75% drop which took out a lot of retail traders (planned by the whales) but now we have already gained 27.87% which leaves up 4.88% below January 30th.
Those of us that didn't panick, found those days a great time to purchase more XRP and today we are much more happy than we were on January 29th before the drop.
My big concern as an XRP trader now is to be extremely careful with ANY short positions in XRP. The question that you as a trader have to ask yourself is what IF the rumors are true that XRP could go up to $1,000 or more overnight and you are in a SHORT position. Guess what, you don't own anymore XRP. Trade carefully and as the saying has always been "BUY LOW AND SELL HIGH."

TradeCityPro | ARBUSDT The Most Important Support of Its Life👋 Welcome to the TradeCityPro channel!
Let's analyze and review one of our important Layer 2 projects, which is currently at one of its most critical support levels, and update our previous analysis.
🌐 Overview Bitcoin
As always, before starting our analysis, let’s take a look at Bitcoin on the one-hour timeframe. We have settled down a bit compared to yesterday's fluctuations, but it’s still not a great time to open futures positions because any news can trigger stop-losses.
However, if you insist on opening a position, the breakout of 100,026 wouldn’t be a bad entry, but you must reduce your risk. These days, it’s better to be an observer in futures trading. On the other hand, Bitcoin dominance is also crucial with this level’s breakout—if it turns green, you can open a position; otherwise, it’s better to switch to an altcoin or not open any position at all.
🕵️♂️ Previous Analysis
In our previous Arbitrum analysis, we had a more bullish outlook and were waiting for a breakout of 0.9689 on the four-hour timeframe to open a long position. This breakout happened, and we experienced a clean move up to the 1.2364 resistance level.
📊 Weekly Timeframe
On the weekly timeframe, we clearly see a rejection from the 1.1887 resistance, which was previously tested as a pullback. Now, this level has become even more significant, and after rejection, we reached the critical level of 0.4792.
If you had bought earlier after the breakout of 0.6487, taking profit at 1.1887 was very logical—either securing profits or withdrawing your initial capital. If you didn’t take these actions, you likely hit your stop-loss by now. However, if you managed your capital properly and only lost a maximum of 2% of your funds, then nothing major has happened. Taking profit at 1.1887 was the smart move.
This weekly candle is one of the most volatile we’ve seen recently for ARB, dropping 30% in a single day before recovering. If it closes green or even slightly higher with better volume, it could act as an entry trigger for those whose strategy aligns with it. However, I personally prefer to see some ranging first and enter on a different timeframe to follow the movement.
📈 Daily Timeframe
Yesterday’s daily candle was truly impressive and showed the strength of buyers. Under normal market conditions, I would have bought with this candle, anticipating the start of an uptrend.
However, this candle was mainly driven by emotions and FOMO, and many traders still don’t fully grasp the consequences of their decisions—they might realize it in the coming days. That’s why this candle doesn’t convince me, and I’m not buying based on it.
Now, you might think, “What if this is the best entry point?” Personally, I would be much happier if price makes a sharp move up to 0.6487 with momentum—this would provide a more confident entry with a tighter stop-loss. In that scenario, both positions would reach their risk-to-reward targets up to 0.9178, but my entry would be more secure, and I could allocate more capital.
If the daily candle closes below 0.4792 and RSI enters the oversold zone, ARB’s situation will worsen significantly, potentially forming new lows. That wouldn’t be good and could lead to deeper corrections.
📝 Final Thoughts
Stay calm, trade wisely, and let's capture the market's best opportunities!
This analysis reflects our opinions and is not financial advice.
Share your thoughts in the comments, and don’t forget to share this analysis with your friends! ❤️

HBAR Seeking Golden Ratio After False Break of Consolidation?There's some big tells in what COINBASE:HBARUSD could potentially be getting ready to do so lets break it down on the Daily Chart!
Since the High on Dec. 3rd @ .392, Price has steadily been forming what looks to be a Descending Triangle while finding Support in the ( .25 - .23 ) cent range. Bearish volume building and RSI going from Overbought to currently going Below 50 suggests further Bearish Price Action could occur!
After the Positive USD Economic News Results for ISM Services and JOLTS Jobs Openings coming in well above Forecast, this seen the Dollar gain strength and other markets like Stocks and Crypto take a dive, in COINBASE:HBARUSD instance, it generated a False Break of the Descending Triangle to now where we see Price plummeting down to test the Support of this Consolidation Pattern.
If Support breaks, we could see Price make a Retracement to the April 2024 Highs @ ( .18 - .15 )
This area looks especially favorable because:
-From the Low before the Rally @ .04172 to the High of the Rally @ .392, lands the Fibonacci Golden Ratio levels priced @ ( .19619 - .17553 ) with the April 2024 High @ .1842 right in the Middle of this Zone!
-The 200 EMA is curving up into the suspected Support of the April 2024 Highs if Price were to fall, it would test this as well!
*If Price continues to fill the Pattern more, keep an eye out for more False Breaks, this will be evident with Price breaking either Area of Value ( Falling Resistance or Support Zone) followed with minimal Volume.

TONUSD Be ready for $12.00 this Summer.It has been almost 5 months (September 12, see chart below) since the last time we analyzed Toncoin (TONUSD) and made our bearish call:
As you can see, it successfully hit our 3.50 Target and the 0.618 Fibonacci level. With that being a direct contact with the bottom (Higher Lows trend-line) of the 1-year Channel Up, while the 1D RSI got oversold (<30.00), we expect the new Bullish Leg to start.
All previous oversold RSI hits (with the exception of Aug 05 2024) have been bottoms and with +300% being a standard rise within this pattern, we expect to see $12.000 as the next High.
-------------------------------------------------------------------------------
** Please LIKE 👍, FOLLOW ✅, SHARE 🙌 and COMMENT ✍ if you enjoy this idea! Also share your ideas and charts in the comments section below! This is best way to keep it relevant, support us, keep the content here free and allow the idea to reach as many people as possible. **
-------------------------------------------------------------------------------
💸💸💸💸💸💸
👇 👇 👇 👇 👇 👇

DYDX on the way to $17DYDX on the way to $17? 🚀
DYDX is showing potential for a massive rally! According to the analysis, the target is set at $17, which translates to +2300% growth 🚀. The current price is still low, but if momentum continues, we could see an explosive move.

Crypto Market Is Still Bullish Despite A New Sell-OffCrypto market faced some deeper decline, but still looks like a complex W-X-Y correction in wave 4 within a bullish trend for wave 5. A drop came from a stock market slowdown due to end of the month flows last week on Friday and due to US tariffs. However, now that US tariffs for Mexico and Canada are delayed, we can see a strong stabilization and recovery, which can be an indication for a bullish continuation within a new five-wave bullish cycle for wave 5, at least for the first half of 2025.

HBARUSD Few consolidation days, then $0.65Hedera (HBARUSD) breached through its 1D MA100 (green trend-line) yesterday but recovered immediately as the 1D RSI almost turned oversold (<30.00). We expect a few more days of consolidation and buy accumulation, similar to the April 13 2024 consolidation on the 1D MA200 (orange trend-line), before the next Bullish Leg.
On the April fractal, the price rebounded to the 1.236 Fibonacci extension to make a peak on the Higher Highs trend-line. With the two fractals having also similar 1D RSI patterns, similar rebound would place our Target at 0.6500.
-------------------------------------------------------------------------------
** Please LIKE 👍, FOLLOW ✅, SHARE 🙌 and COMMENT ✍ if you enjoy this idea! Also share your ideas and charts in the comments section below! This is best way to keep it relevant, support us, keep the content here free and allow the idea to reach as many people as possible. **
-------------------------------------------------------------------------------
💸💸💸💸💸💸
👇 👇 👇 👇 👇 👇

Rising Wedge Pattern For SWFTCoin.... Hidden Ascending Triangle!The rising wedge is a chart pattern used to identify possible reversals.
The pattern appears as an upward-sloping price channel featuring two converging trend lines.
It's usually accompanied by falling trading volume.
Wedges can either form in the rising or falling direction.
A rising wedge is often considered a bearish chart pattern, meaning it indicates a breakout to the downside.
Be careful of a shakeout-fake-out.
It appears as though an Ascending Triangle is hiding in the shadows.
It is very common for whales to accumulate at the bottom of these patterns..
glta

BTCUSDTHello Traders! 👋
What are your thoughts on BITCOIN?
Bitcoin is still struggling with its key resistance zone, showing signs of weakness in continuing its upward movement. Based on the current price structure, we anticipate a short-term correction towards the identified support level.
If the support holds and a rebound is confirmed, the uptrend could regain strength, with the first target in this scenario being the $115,000 zone.
Don’t forget to like and share your thoughts in the comments! ❤️

SUAI/USDT NEW TOKEN : AI AGENT 5-10x?SUAI/USDT NEW TOKEN
This is a high-risk coin, which can show some possibilities in the coming time.
There is no data about this coin, and the only reason for checking is the first TA confirmation includes some trend following.
Can this coin gain to $0,08?
This is exactly what we are going to follow.
Never hold high-risk coins, but you can follow them with the right SL.
This coin is added at the mexc exchange
This is not trading advice, manage always the risk since crypto is risk full.

TradeCityPro | DOGEUSDT End of the Downtrend👋 Welcome to TradeCityPro Channel!
Let's go together into a turbulent day in the market, which was accompanied by the opening of global markets, Trump’s side events, and economic sanctions on Canada and Mexico. Let’s take a look at the chart together.
📣 How did this happen?
The event that occurred last night with the market opening in the Tokyo session was that Trump suddenly increased import tariffs from China, Canada, and Mexico to 25%, causing economic conflicts among these countries.
Along with this, we saw an increase in USDCAD, the dollar index, gold, and cryptocurrency, leading to market fluctuations. However, today it was announced that these changes will take effect next month.
🌐 Overview Bitcoin
Before starting the Bitcoin analysis, let’s first examine Bitcoin on the one-hour timeframe as usual. We had already opened our short position after breaking 101,654 in previous analyses, and this morning, due to sell-off candles around the 92,000-dollar range and excessive overselling, we secured a lot of profit and completely exited the position. This drop caused a severe shock to most people, leading to the liquidation of $2 billion in long futures positions.
This price drop was accompanied by an increase in Bitcoin dominance, reaching my psychological ceiling, and a very long shadow up to 64.30% was recorded. In my opinion, this is the Bitcoin dominance peak, but we will wait for confirmation. The reason I say this is the peak is that a large volume of other coins is staked and locked outside the cycle. This makes it unlikely that we will go above these numbers, and we will likely experience corrections and declines gradually.
However, Bitcoin itself has completely recovered its drop, which is a very good sign for upward movement and momentum because a momentum shift has practically occurred. The reason for this shift was the announcement that these economic events will be implemented next month, not now, which brought calm to the markets. But Bitcoin still has good momentum, and you shouldn’t feel left out. Feeling left out is for those who lack risk management and enter positions recklessly, not us.
📊 Weekly Timeframe
On the weekly timeframe, Dogecoin, Elon Musk’s favorite coin that has practically established itself as an entity in the U.S. and made him the second most influential person in the country, has had an outstanding performance recently. It has both recorded a higher low compared to 2023 and has not undergone significant price corrections—just a rejection from its ATH, which is entirely logical.
I am not buying for now and prefer to miss a move, or if I do buy, it will be very low-risk. But if you want to buy a coin, be very careful about how it performed during this correction and what its Bitcoin pair looks like. Most coins that experienced more decline, like NOT, had a bearish Bitcoin pair, while some coins that held up well were either ranging or bullish.
With this weekly candle, you can take a risk and make your purchase, but you must consider that it has merely bounced off support and made a pullback. Therefore, it may range for a few weeks before continuing its momentum, as the high volatility at the beginning of the month means the market may need some rest—unless we enter a bull run. For selling, hold on for now and do nothing.
📈 Daily Timeframe
On the daily timeframe, however, DOGE is one of the coins that has reacted well to recent events and is behaving almost like Bitcoin. It has rebounded from this range and is closing a strong candle with high volume, preventing the daily RSI from entering oversold territory.
On the other hand, DOGE is among those coins that are positioned at higher levels compared to the daily range that most altcoins have formed, showing its relative strength against Bitcoin. If you check Ethereum on the daily timeframe, you will understand what I mean.
After breaking the important 0.31019 support and the 0.236 Fibonacci support, we saw a sharp candle that rebounded between the 0.382 and 0.5 range, which is not a bad reaction at all. Most likely, some purchases will be made upon the closing of this candle.
If this aligns with your strategy, it is not a bad entry point, but I personally prefer to wait a little longer and enter with a better trigger and a smaller stop-loss. Or, I might wait for the 0.466 resistance break and take the trade with more certainty or higher risk.
First, when the market becomes range-bound and boring, that is exactly when the highest probability of movement occurs.
Second, take risk and capital management very seriously. I know 90% of our community follows this, but I need to repeat it repeatedly to make it universal and prevent people from being liquidated unnecessarily by opening reckless positions based on mere hope.
📝 Final Thoughts
Stay calm, trade wisely, and let's capture the market's best opportunities!
This analysis reflects our opinions and is not financial advice.
Share your thoughts in the comments, and don’t forget to share this analysis with your friends! ❤️

SOLANA double bottomed on 1day MA200. Target $400.Solana / SOLUSD is trading inside a Channel Up since the July 29th 2024 high.
The price hit today the 1day MA200 for the 2nd time since January 13th and instantly rebounded.
Technically this makes it a Double Bottom formation and took place right at the bottom of the Channel Up.
The pattern is very similar with the Megaphone of May-August 2024 that was followed by a strong uptrend, the bullish wave of the Channel Up.
Their 1day RSI patterns are identical.
Buy and aim for a +140% rise from the bottom. Target 400.
Follow us, like the idea and leave a comment below!!

BITCOIN: Pattern gets repeated again and again and again.Bitcoin is on the most desirable buy levels long term as apart from only being neutral on its 1D technical outlook (RSI = 47.257, MACD = 281.800, ADX = 29.399) it just validated today the enormous buying zone that was waiting on the 1D MA100. This is a level that has worked as a buy entry over and over again these 2 years of the Bull Cycle. The last time it did was exactly a year ago on January 22nd 2024. The result was a +90% rally. If this gets repeated again the exact same way, then a new ATH at 170,000 is more than plausible.
## If you like our free content follow our profile to get more daily ideas. ##
## Comments and likes are greatly appreciated. ##

FARTCOIN: Buy and sell strategy around the Channel Down.FARTCOINUSD is about to turn neutral on its 1D technical outlook (RSI = 43.244, MACD = -0.099, ADX = 22.114) as it is approaching the 4H MA50. This is a little under the top of the short term Channel Down and is where the last sell signal flashed. Consequently it is a technical sell entry to target near the S1 level (TP = 0.55000) but tight SL needed. The reason is that if it crosses over the top of the Channel Down, the sentiment will turn bullish and we will abandon shorts, turn to longs and aim for a +300% increase (TP = 2.000), same as the Jan 13th-19th bullish wave.
## If you like our free content follow our profile to get more daily ideas. ##
## Comments and likes are greatly appreciated. ##

CRV Pullback for 300%??Analysis using SNR ORIGINAL chart Pattern, trade at ur own risk, u may TP at goodseller for scalping.

ETH/USDT : Get Ready for the next Bullish Move! (READ)By analyzing the weekly (logarithmic) chart of Ethereum, we can see that the price experienced a sharp crash last night, dropping to $2100. After reaching this key demand zone, Ethereum rebounded and is currently trading around $2600.
As long as the $2200 support holds, we can expect further bullish momentum. The mid-term targets for Ethereum are $3900, $4600, $5700, and $7400. 🚀
Please support me with your likes and comments to motivate me to share more analysis with you and share your opinion about the possible trend of this chart with me !
Best Regards , Arman Shaban

DOGEUSD Giant Bull Flag or Channel Down rebound?Dogecoin (DOGEUSD) is trading within a 2-month Channel Down, which on the wider scale may be a Bull Flag for this Bull Cycle. Regardless of the time-frame, the price got sold aggressively today and hit its 1D MA200 (orange trend-line) for the first time since October 25 2024.
If that's just a 1D Channel Down, then today's Low is technically a bottom on the pattern's Lower Lows trend-line. The previous one (December 20 2024), rebounded towards almost the 0.786 Fibonacci retracement level.
With an oversold (<30.00) 1D RSI for the first time since August 07 2024 making the buy opportunity even stronger, we expect the new Bullish Leg to target 0.3800 (just below the 0.786 Fib).
-------------------------------------------------------------------------------
** Please LIKE 👍, FOLLOW ✅, SHARE 🙌 and COMMENT ✍ if you enjoy this idea! Also share your ideas and charts in the comments section below! This is best way to keep it relevant, support us, keep the content here free and allow the idea to reach as many people as possible. **
-------------------------------------------------------------------------------
💸💸💸💸💸💸
👇 👇 👇 👇 👇 👇

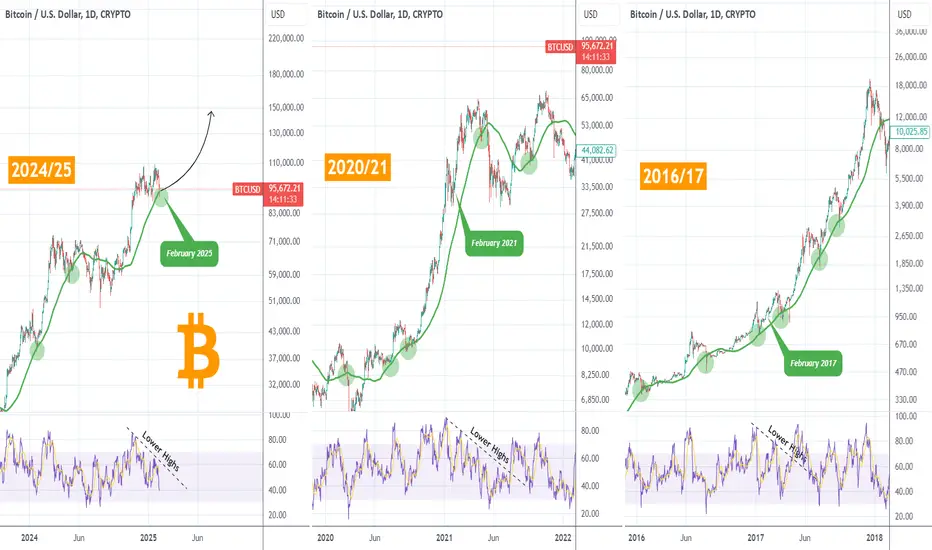
BITCOIN Can a 1D MA100 rebound reverse the 'Tariffs narrative'?Just a week ago (January 27, see char below) we made a case of why it was essential for Bitcoin (BTCUSD) to test and rebound on its 1D MA100 (green trend-line), if the market was to find the necessary Support to move it forward through the rest of the year and the Bull Cycle:
Well BTC went on to confirm our expectation and hit the 1D MA100 for the first time in almost 4 months (since October 11 2024).
That analysis was focused on the current Bull Cycle (2023 - 2025) and the recurring 1D MA100 rebound sequence within the 2-year Channel Up, which has so far provide its Higher High both times.
Today's analysis examines if this is a pattern that emerged and held during the previous Bull Cycles as well. The results are eye opening.
During the last two years of each of the past 3 Bull Cycles, a 1D MA100 contact has most of the times (9) met with an incredible rebound, making it the most efficient buy entry on such basis. It was only 3 times this failed to initiate an immediate rebound (April 2024/ ETF led rally corrected, April 2021/ Musk led rally corrected, March 2020/ COVID flash crash), all valid reasons fundamentally.
Is this new all-out Trade War another one of those events? Not impossible, but this chart shows that it is 3 times more probable for this 1D MA100 contact to produce an aggressive rebound. If we narrow the sample to just the last year of the Bull Cycle, it was only once that a 1D MA100 failed to produce an instant rally.
As a result, it is now more probable to see a rally similar to the one that followed the January 2024 or October 2024 1D MA100 contacts, which were within a +85% / +90% range. Even the 1D RSI patterns among the Cycle fractals at the start of each final Bull year are similar.
So what do you think? Do you expect this technical 1D MA100 contact to reverse the dismal Tariffs sentiment? Feel free to let us know in the comments section below!
-------------------------------------------------------------------------------
** Please LIKE 👍, FOLLOW ✅, SHARE 🙌 and COMMENT ✍ if you enjoy this idea! Also share your ideas and charts in the comments section below! This is best way to keep it relevant, support us, keep the content here free and allow the idea to reach as many people as possible. **
-------------------------------------------------------------------------------
💸💸💸💸💸💸
👇 👇 👇 👇 👇 👇
Watching for 98.2K resistance for short entryMorning folks,
So, this week / our DRPO "Sell" pattern is one step closer to confirmation and has a good chances to start working this week.
Meantime, due to weekend collapse BTC now is overextended. The problem is not about BTC itself but in jump of the USD, triggered by Donny's tariffs. We suggest to get technical rally, back to ~98.2K resistance area and consider short entry there if DRPO still will be OK.
If DRPO will be confirmed this week, its target stands around 81K support area. So, it is worthy to pay attention to...

AT CryptoScan: BTCUSD downside target is...As highlighted previously, there were issues with the recent BTCUSD Bitcoin rally... and so it is very clear now that there is a TOP resistance to breakout eventually. This is marked out by the green box at about 107K. Furthermore, breaking back into the purple box also suggests a breakdown out of the lower end... to which just about happened. The thing is, this is only a beginning and there should be about 5 to 8 days more of overall sliding down.
Notice that the candlesticks of late are getting longer and longer? This is indicative of momentum and as it falls over the cliff, it would continue until it stops. Meanwhile, it just is about to break the SuperTrend support.
So expect more downside...
I marked out the immediate TDST at 89,164, expecting that over the next 5 days shou;ld breakdown below that level. The next TDST is at 69,284... and I think this is a little too far down.
Looking for two bounce areas at 88K and 75K for reaccumulation, some time in mid- to end- February. That's the plan.

Is XRP Still A Good Idea To PurchaseWith this recent drop in XRP, I have been asked multiple times if I am still bullish on XRP and my comment still is YES!!!!
Why Now is the Perfect Time to Invest in XRP
I remain steadfast in my position: now is an even better time to buy and hold XRP. The reasons are compelling and numerous, reflecting the immense growth potential and strategic positioning of XRP as a global financial network.
Pilot Programs and Strategic Partnerships
The XRP Ledger (XRPL) is at the forefront of numerous pilot programs, demonstrating its utility and potential. Major financial institutions and corporations, including BlackRock, are exploring the integration of XRPL into their operations. Additionally, six upcoming ETFs and an XRP Futures market set to launch in 2025 highlight the growing interest and confidence in XRP's future.
Global Integration and Regulatory Developments
The Bank of Japan has announced that all Japanese banks will be connected to XRPL by 2025, marking a significant milestone in XRP's global adoption. Furthermore, the ongoing SEC lawsuit is expected to be resolved by April, potentially removing a significant barrier to XRP's growth. The pro-crypto stance of the Trump administration adds another layer of optimism for the future of XRP.
A Proven Track Record and Future Potential
Reflecting on my past investment in Bitcoin, where I purchased 9,099 BTC at $0.11 and sold them at $0.54, I realize the potential missed opportunity. Today, that investment would be worth $1.1 billion. Unlike Bitcoin, which had limited utility at the time, XRP is designed to move trillions of dollars globally on a daily basis, showcasing its practical applications and value.
Innovative Financial Solutions
Ripple Labs is actively working on a FOREX alternative with their stablecoins, including RLUSD, RLJPY, RLEUR, and RLGBP. These innovations further solidify XRP's position as a versatile and valuable asset in the financial ecosystem.
Recognition and Influence
The presence of Ripple Labs executives at the Presidential Inauguration balls, engaging with President Trump and Vice President JD Vance, underscores the significant influence and recognition of XRP. Notably, representatives from other major cryptocurrencies like Ethereum, Cardano, and Solana were absent, highlighting XRP's unique standing.
Conclusion
In conclusion, the current landscape presents a prime opportunity to invest in XRP. The combination of strategic partnerships, global integration, regulatory developments, and innovative financial solutions positions XRP for substantial growth. However, the decision to invest ultimately rests with you. I encourage you to explore the insights shared on the Ripple Labs website and make an informed choice. Also, keep in mind that even with this recent pull-back XRP has still made a 25% gain since the first of the year. If you were to put your money with one of the large financial institutions, they would scoff at you if your told them that you were looking for an annualized 25% gain.

We warned you in the previous post about the crash, BitcoinDo you remember the last post where we warned you about the upcoming crash?
Today, reality has become even harsher.. Bitcoin has crashed below $100, and Tram Coin has plummeted into oblivion!
🔥 Unfortunately.. for those who didn’t read the previous post:
It was the golden opportunity to exit before the disaster..
Now.. regret and loss for those who ignored the warnings!
💡 If you want to know how low Bitcoin will go.. read the previous post!
And if you don’t want the market to crash on you.. hit follow so you don’t miss any important warnings or analysis!
💔 The fear of loss is worse than the loss itself..
Don’t let procrastination or neglect make you a victim..
Follow the analysis and always be prepared for any scenario!
📉 The market shows no mercy..
So, are you ready for the next move?
This is the post I warned you from.. If you were following me and read it, you wouldn’t have lost!
