Bitcoin to 140k - 170k (26MAY2025)On monthly timeframe we have few trendlines which show us, 140 to $170,000 is likely according to the 100% of Fibonacci Extension as well, but above that is unlikely IMO.
Cryptocurrencyanalysis

BITCOIN TO $140KAccording to this weekly chart I have, bitcoin has a very important trendline that no one pay attention to, which gives us a very strong resistance about $134k to $140k , depends when bitcoin touch that, and I expect a big rejection from that area.

XRP Can Potentially Target $2.50FenzoFx—Ripple found support at $2.12 and began a bullish move, currently trading near $2.197.
Technically, the next target is $2.355, provided the price holds above $2.120. A break above $2.355 could open the way to $2.500.
Bearish Scenario : If XRP/USD falls and stabilizes below $2.120, the next support is at $2.034. A drop below this level may trigger a decline toward $1.924.
***
>>> No Deposit Bonus
>>> %100 Deposit Bonus
>>> Forex Analysis Contest
All at FenzoFx Decentralized Forex Broker

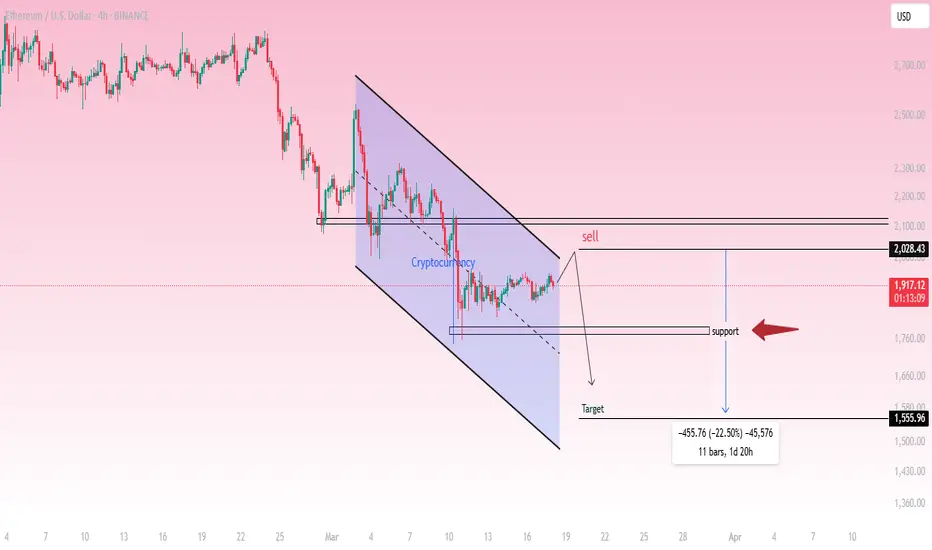
Ethereum (ETH/USD) - 4H Analysis & Trade Setup
Market Overview:
ETH/USD is in a downtrend, forming a descending channel.
Price is currently trading around $1,915.23, showing signs of consolidation near resistance.
Technical Analysis:
Trend: Bearish
Resistance Level: $2,028.43
Support Level: $1,760
Target: $1,555.96
Pattern: Descending Channel
Trade Idea (Short Setup):
🔴 Sell Zone: Around $2,028.43 (Resistance)
✅ Target: $1,555.96 (-22.50%)
⛔ Invalidation: A breakout above $2,028
Conclusion:
Ethereum is respecting the downward channel structure.
A rejection from resistance at $2,028 could confirm further downside.
Traders may consider short positions targeting $1,555.96, provided the trend remains bearish.
📉 Bearish bias remains intact unless price breaks above resistance.
XRP - A Quick Look at What's HappeningHave you noticed the parallel movements between Bitcoin (BTC) and XRP. It's a common phenomenon in the crypto market, while this is likely to be a short term move let's dive into why -
Given this strong correlation, here's how a drop in Bitcoin's price can influence XRP:
Direct Impact on Trading Pairs: XRP is often traded against BTC. So, if Bitcoin's value decreases, the value of XRP in relation to Bitcoin also tends to decrease.
Sentiment-Driven Selling: When Bitcoin's price drops, it can create a sense of fear and uncertainty among investors. This can lead to a widespread sell-off (herd mentality kicks in), with investors selling off their holdings of other cryptocurrencies, including XRP, to minimize potential losses OR to capitalize on profits made at the recent highs.
Algorithmic Trading: Many traders use automated trading systems that are programmed to react to Bitcoin's price movements. If Bitcoin's price drops below a certain threshold, these systems may automatically trigger sell orders for other cryptocurrencies, including XRP, which fuels the decline further,
Liquidity Cascades: Liquidity can dry up quickly, making it harder to find buyers for XRP. This means sellers might have to lower their prices to attract buyers, pushing the price down even further.
Chart Markup Explained:
While taking all these factors into consideration, we should also be mindful of the recent surge in price - this would have definitely attracted more investors and that allows us to start painting the technical picture at a more refined level. Supply and Demand dynamics are now more prevalent than ever.
Important Notes:
Just because BTC affects the way XRP moves doesn't mean that will always be the case. It's more like they're both reacting to the same underlying market forces. XRP has its own story, its own news, its own developments that can influence its price, regardless of what Bitcoin's doing. Sometimes, XRP even dances to its own tune (as explained in the previous published idea).
So, while Bitcoin's dips can definitely have a big impact on XRP, it's not the whole picture. Other factors are always at play, and it's important to look at the bigger context. Correlation doesn't equal causation, after all.

XRP - The Untapped Potential and Future PredictionsMost traders recognize XRP for its role in cross-border payments, but its real strength may lie in its expanding ecosystem. As the digital asset landscape evolves, XRP’s utility is quietly stretching into new frontiers. Let’s break down some under-the-radar use cases that could shape its future.
1. DeFi on the XRPL – A Sleeper in the Making?
While Ethereum dominates decentralized finance, the XRP Ledger (XRPL) has built-in support for decentralized exchanges (DEXs) and tokenized assets. This opens the door for lending, borrowing, and synthetic asset creation—all without relying on external smart contracts.
Why It Matters: XRP’s speed and near-zero fees could make it a serious alternative for developers looking beyond Ethereum’s congestion and high costs. The idea of XRP-backed stablecoins, lending markets, and NFTs thriving on the XRPL isn’t far-fetched.
2. Tokenization of Real-World Assets – Unlocking Liquidity
The ability to tokenize assets on the XRPL could revolutionize investment access. Real estate, commodities, and even intellectual property could be fractionalized into tradeable digital tokens.
Future Vision: Imagine holding fractional ownership in a luxury apartment in Dubai or investing in a startup’s future revenue, all via tokens on the XRPL. Tokenization has the potential to democratize investing and bring liquidity to traditionally illiquid markets.
3. CBDCs – The Missing Link in Global Settlements?
Central Bank Digital Currencies (CBDCs) are digital versions of fiat currencies issued and regulated by central banks. Unlike cryptocurrencies, CBDCs are government-backed and designed to modernize traditional financial systems by enabling faster, more efficient transactions.
Ripple has been actively working with central banks on CBDC pilot programs, and XRP could play a pivotal role in facilitating interoperability between different national digital currencies.
Why This Would Be Massive for XRP:
If CBDCs gain widespread adoption, there will be an urgent need for a neutral bridge asset that can instantly convert and transfer value between different digital currencies. XRP’s liquidity, speed, and low-cost transactions make it an ideal solution for settling cross-border payments between CBDCs, potentially positioning it as a key player in the future of global finance.
4. Micropayments & Content Monetization – A New Creator Economy
XRP’s low transaction fees make it an ideal vehicle for micropayments. From paying for online content to streaming services, small-value transactions could become seamless.
Imagine This: A decentralized platform where artists, writers, and content creators receive XRP micropayments directly from consumers, bypassing centralized intermediaries. This could redefine digital content monetization.
5. Supply Chain & Logistics – Transparency Through Blockchain
With its transparency and immutability, the XRPL is well-positioned for tracking goods across supply chains. Businesses could use XRP to authenticate products, verify sourcing, and automate payments at various checkpoints.
Real-World Impact: Tracking a product from manufacturer to consumer while automating payments at each stage could improve efficiency and eliminate counterfeiting in global trade.
Why This Matters for Market Sentiment
Increased Utility: More real-world use cases = higher demand for XRP.
Narrative Shift: XRP’s role expands beyond payments, strengthening its long-term investment appeal.
Network Effect: As adoption increases, XRPL’s ecosystem becomes more attractive to developers and institutions.
SIMULATED MARKET POTENTIAL
If we consider that XRP is to follow a similar trajectory as BTC based on the above points coming into fruition, this is what we would find in a simulated market –
BTC Growth
Early Days (2010-2011): Bitcoin's first major price surge saw it go from fractions of a penny to around $30, marking massive percentage gains (tens of thousands of percent). This was driven by early adopters and growing awareness of the technology.
First Bubble (2013): Bitcoin's price skyrocketed from around $30 to over $1,000, a gain of over 3,000%. This was fueled by increased media attention and speculation.
Second Bubble (2017): Bitcoin reached its then all-time high of nearly $20,000, a gain of roughly 2,000% from its previous peak. This was driven by a frenzy of retail investment and the rise of ICOs (Initial Coin Offerings).
Recent Bull Run (2020-2021): Bitcoin surged to almost $65,000, a gain of about 300% from its previous high. This was fueled by institutional adoption, increased mainstream acceptance, and the narrative of Bitcoin as a store of value.
Simulated XRP Growth
Total Crypto Market Growth: 25% per year (a reasonable assumption)
XRP Market Cap Share: Grows to 7% of the total market (a conservative view)
1 Year (Jan 31, 2026):
Total Crypto Market Cap: ~$4.6 Trillion
XRP Market Cap: ~$230 Billion
XRP Price: ~$4.00
Year 3 (Jan 31, 2028):
Total Crypto Market Cap: $7.21 Trillion
XRP Market Cap: $360.5 Billion
XRP Price: ~$6
Year 5 (Jan 31, 2030):
Total Crypto Market Cap: $11.26 Trillion
XRP Market Cap: $563 Billion
XRP Price: ~$10
Year 10 (Jan 31, 2035):
Total Crypto Market Cap: $34.38 Trillion
XRP Market Cap: $1.72 Trillion
XRP Price: ~$30
Final Thoughts
These use cases aren’t guaranteed to succeed, and adoption remains a challenge in the competitive crypto world. Yet, the potential is undeniable. If XRP carves out even a fraction of these markets, its role in the digital economy could be far more significant than many realize. There are also some wild projections which predict XRP going over the $200 mark and beyond and while I'd love to see that happen, the XRP market cap would need to be over 11 trillion for this to even be plausible.
However, this is the crypto landscape and we are still pioneering our way through it, so who knows...
What I do believe is that XRP is going to continue climbing in the near and distant future.
Hope this read was worth while for you!
Apex out!

Bitcoin in raising channelAs bitcoin is moving inside this raising channel , after it broke the middle trendline to the upside now its back testing that. more likely another leg to the upside coming soon..

Bitcoin is going to the Moon PART 2! [S #3 B]How nice, hit all 3 targets from the original post in not even 2 days...
NOW FOR PART TWO!
I have added a few more targets, TP4, TP5, and TP6.
We are currently going up high in altitude and going to be reaching our planet's atmosphere very soon! We should the reach the moon in no time!
Bitcoin may dip a bit from the current price but should still make a new ATH.
I will be going a bit into what I call my "special indicator" that successfully helped me make the last few recent signals.
I call it "MarketAnalyzer FX Alpha 1" and it honestly has been doing a splendid job.
It is pointing upwards for Bitcoin, hopefully it won't take too long to hit our next target.
Entry:
***USE LOW LEVERAGE IF ANY AT ALL***
$79,200-$80,000 (Original posts entry)
If you have not entered yet, new entry could be $86,000-$89,000
TP1: $82,742 ✅
TP2: $85,132 ✅
TP3: $82,742 ✅
TP4: $90,800
TP5: $98,200
TP6: $110,000
For those that have the good entry of $79k-$80k I would move SL to entry.
If entering the current entry point, $85,000.
----------------------------------------------------------------------------------------------
***ALL ANALYSIS, SIGNALS, AND ANY CONTENT IS FOR EDUCATIONAL PURPOSES
ONLY AND ARE NOT MEANT TO BE PROFITED OFF.***
----------------------------------------------------------------------------------------------

BTC broke out of rising wedge pattern! BTC broke out of rising wedge pattern ; In this technical analysis, Fibonacci retracements of price and time were used to compare the strength of buyers and sellers. As we can see, after an impulsive wave where BTC's price increased to 73,600 over 182 days, it corrected by only 50% over the next 182 days. This means that the market has given sellers as much time as it did buyers, but their strength was half of that of the buyers over the same period. With this description, we can expect the end of the corrective wave and the start of a new impulsive wave, but before that, the previous high of 73,600 must be broken to confidently enter a long trade. Also, the 70,000 level is an important area for BTC; if BTC can hold this area, the likelihood of its rise will increase significantly. This analysis will be updated in the coming days.

ETH/BTC Local work. Symmetric triangle.Logarithm. Time frame 3 days.
Secondary trend (part). Symmetrical triangle. Pivot zone.
The price is now 0.069 satosh per ETH.
Linear chart.
Main trend Time frame 1 week.

BTCUSDTDaily Time Frame Bitcoin Analysis
The daily time frame of Bitcoin is still bearish and you can enter the trade after seeing the confirmation.

ZILUSD Forecast: Bullish Momentum & Targets for Q4 2024, Q1 2025ZILUSD currently finds robust support at $0.0136, suggesting favorable conditions for a potential uptrend. The recent retesting and observed volume indicate a promising setup for a bounce. Concurrently, the ETHBTC pairing shows notable growth, poised to potentially flip the 0.6 level, signaling a likely rally in altcoins. Moreover, with ETH's ETF approval nearing, the market anticipates heightened volatility and upward movements in Q4 2024. Historically, such periods have exhibited significant price rises and increased market activity during bull runs. Notably, preparations for market exit around March or November 2025 are advisable as bull runs typically conclude during these times.
In historical contexts, ZILUSD has shown resilience and substantial targets during bull runs, with a minimum target projection of around $0.5 in Q4 2024. Breaking the $0.5 resistance could propel prices towards a maximum target of $1.5 by Q1 2025. Since its listing in January 2018 amidst a bear market, ZILUSD underwent significant downtrends until March 2020, followed by a notable uptrend till May 2021's bull run. Subsequently, a downturn from May 2021 to December 2022 led to a consolidation phase until March 2024, marked by recent upward movements.
Retesting support at $0.0135 suggests a potential for a substantial uptrend towards Q1 2025 amidst the approaching altcoin season, expecting similar market volatility. Monitoring resistance zones and patterns is essential to maintain active trading strategies. Consider exiting long positions around March or November 2025, aligning with historical market cycles.
For more detailed analysis and future trading ideas, follow us on TradingView. Share this idea with your friends and family to maximize profits. Please like, comment, and engage with our posts for more insights. Thanks!

Analyzing NMR Bullish Symmetrical Pattern: Breakout ForecastThe NMRUSD pair holds strong support at $11.80, presenting significant potential for a bullish move. If this support level holds, we can expect a notable gain. However, if this support breaks, the next strong support is at $10.66, where a bounce is anticipated due to the proximity of a bull run and the nearing approval of the ETH ETF. We can expect market bullishness in Q4 2024, accompanied by high volatility and substantial rises typical of bull runs.
Anticipated Bull Run Targets:
Based on historical data and calculations, NMRUSD's minimum target during the bull run is projected at $360. If it can flip the $360 resistance by February 2025, we might see a maximum target of $1000. NMRUSD, listed in 2017, has formed a symmetrical triangle pattern expected to break out during the 2025 bull run. Historically, prices have shown unexpected pumps during bull markets, and similar volatility is expected this time.
Strategic Long Position Management:
Considering the resistance zones and the potential pattern breakout, it is crucial to maintain active trades while monitoring these levels. Plan to exit long positions around March or November 2025, as the bull run is likely to end during this period.
For continuous updates and in-depth analysis, follow us on TradingView to stay ahead with our trading ideas and market insights.

Token name from you, Analysis with me(6/22/2024)Hi everyone, I hope you have a great weekend.
Last week, this type of post was well received; as I said, I will share a post for your Altcoin analysis request , where you write the Project name and Token symbol in the comment section, and I will then share the token analysis with you.
Please pay attention to the conditions.
For example , write Bitcoin(BTC) in the comment.
Project name : Bitcoin
Token symbol : BTC
A maximum of 20 tokens will be analyzed for you.
Each follower, please register only 1 analysis request in the comment section.
Your token analysis will be shared below your comment .
I hope you are always healthy first and then rich.
Please do not forget the ✅' like(More energy for me) '✅ button 🙏😊 & Share it with your friends; thanks, and Trade safe.

Doge Coing First Target After retracingDoge Coing First Target After retracing 50 - 61.8 zone, The doge is accumlating and building moment to break high and go to -27 for first target.

Negative Wolfe wave pattern, RSI, MFI using TF2H on CHZ/USDTUsing TF2H on CHZ/USDT chart, in this method we used a Wolfe wave negative pattern with negative divergence in RSI and MFI, you may check out the ETA and EPA of this analysis as well as the TPs and SL. please share your thoughts on my analysis, your criticism is crucial to developing me in analysis. Thanks!
⚠️Disclaimer: this is not for real-money use but only made for educational purposes⚠️

TOTAL2 Crypto Market Cap Bearish StophuntCurrently, there is a Bearish 12H and daily stophunt on the TOTAL2 market Cap, which is TOTAL minus BTC.
TOTAL2 is not showing a 3day Bearish stophunt like TOTAL is showing..
Stay tuned; likely to be a bloody weekend, but it may present us with some opportunities.

My Bitcoin Pull Back ScenarioI want to start by saying that I realize BTC is looking very bullish right now. But with all the difficulty it is having getting and staying above $38k, I feel that this could lead to a pullback. At a minimum, a short-term pullback and worst case a pullback lasting several weeks or more.
I could be wrong and BTC could just keep moving higher, but I want to keep an open mind, even to the worst-case scenarios. So this chart depicts what I see as potential bearish scenarios.
Looking at the chart you can see four different scenarios. Below is an explanation of each scenario.
1 = Short-term pullback, $35K level holds and BTC moves higher from there.
2 = $35K level fails and BTC drops down to retest the breakout level around $31,500 and bounces higher from there.
3 = $35K and FWB:31K levels fail and BTC drops back below $30k, possibly as low as $25k.
#3 would act as a secondary scare for a large number of crypto holders forcing many to panic sell, a wick down into the low $20k levels could be possible.
4 = BTC getting too bullish too fast going into the SEC decision on the ARK 21shares ETF. And the SEC rejects their application causing a severe sell-off.
I am very bullish on Bitcoin long-term so I would consider any of these scenarios as a great time to add to positions. In reality many people will panic sell when they should actually take advantage of lower prices and buy more.
In my last published chart, I showed how similar the last two market cycles were as far as elapsed time between events (Bottom to halving), (halving to peak), (peak to bottom), and even (Bottom to the date BTC hit a new all-time high).
Also, the overall length of the market cycles, Bear market bottom to the next bear market bottom were extremely close, 1431 to 1437 days.
My reason for mentioning this is because so far this market cycle seems to be following the same trend. Looking at the elapsed time from the bear market bottom to the halving, market cycle #2 (2015 to 2018) had an elapsed time of 542 days. market cycle #3 (2018 to 2022) had an elapsed time of 513 days.
For this current market cycle the halving is estimated to occur sometime between April 17th and the 23rd. That would give this market cycle an elapsed time of between 513 and 519 days. That is very similar to the last two cycles.
This leads me to believe that Bitcoin is still following the same 4-year cycle as the previous two market cycles. If this continues to be the case, it means that there is still plenty of time to build positions. It also means that any pullbacks should be looked at as buying opportunities.
If this market cycle does in fact mirror the last two as far as elapsed time, then that would mean that a bull market peak could be expected in late 2025. Obviously, the price of BTC won’t move straight up as there will be corrections along the way and some will most likely be severe, possibly 30% or more.
So, my strategy will continue to be the same as it has been for months. I will continue to DCA slowly into my positions and occasionally increase the size of my purchases during steep pullbacks.
In closing I just want to say that no one really knows how this current market cycle will play out. And just because the previous two cycles matched so closely it doesn’t guarantee that this cycle will as well. But, until I see clear evidence that BTC is deviating from the previous market cycles I will continue to believe that I have at least six to twelve more months to build positions.

TRBUSDT short-term ideaThis is a short-term view of the TRB coin that I realize .
The picture illustrates some important zones, and you can set an alarm or order.

LDOUSDT 16/10Pair : LDOUSDT
Description :
Bearish Channel in Short Time Frame and Breakout the Upper Trend Line and Completed the Retracement. Consolidation Phase as Correction in LTF if it Breaks Upper Trend Line then it will Reach its Daily Descending Trend Line
Entry Precautions :
Wait Until it Breaks or Rejects from Consolidation Phase

LDOUSDT 26/09 MovePair : LDOUSD ( Lido Dao / U.S Dollar )
Description :
Rising Wedge as an Corrective Pattern in Long Time Frame with the Breakout of the Lower Trend Line and Making its Retracement as an Corrective Pattern " Bearish Channel " If it Rejects from Previous Support then Long

$OG send it to the moon 🚀🚀What a fantastic time to buy/long $OG.
waiting for liquidity to come
Daily, Weekly seems good
See ya at $5 above

Super Risky Long on BTCHello Traders
BTC is soooo weak so don't expect too much from it.
Our technical view has been shown in the chart.
If you like it then Support us by Like, Following, and Sharing.
Thanks For Reading
Team Fortuna
-RC
(Disclaimer: Published ideas and other Contents on this page are for educational purposes and do not include a financial recommendation. Trading is Risky, so before any action do your research.)
