BTCUSDTThe price did not reach our entry point and moved towards our target. Now we can wait for it to reach our demand area and wait for the price reaction from there.
Cryptocurrencysignals

ETH/USD: Dodging the 4K Rejection and Riding the RollercoasterHey there, crypto warriors! Get ready to dive back into the ETH/USD battleground – it's time for another epic trading update that'll make your heart race faster than a DeFi token pump!
So, let's rewind to our last analysis. We talked harmonics patterns, support zones, and resistance levels – all the good stuff. But guess what? The plot thickens, my friends!
Fast forward to today: We're facing some serious drama on the weekly charts. That's right, we gave the infamous 4K level a good old-fashioned rejection, sending us on a downward spiral. But fear not, brave traders – we're not out of the game just yet!
Taking a closer look at the charts, we're hitting some key Fibonacci levels like a boss. The shadow of the candle landed right on the 61% fib, and we're currently hovering above the 31% – talk about walking the tightrope!
Now, here's the million-dollar question: Are we ready to make a move? Well, it all depends on those cheeky daily candles. If they keep confirming support like they're supposed to, we might just be in for some bullish action. But hey, if you're not feeling it, there's no shame in waiting for another drop to that sweet, sweet 61% fib or even our initial entry point.
But hey, remember the golden rule of crypto trading: Buy the dip, hodl the moon! And hey, if all else fails, just blame it on Elon Musk – works every time!
So, here's to the brave souls riding the ETH rollercoaster – may your trades be profitable and your memes be dank!
Keywords: ETH/USD, trading update, Ethereum analysis, Fibonacci levels, support zones, resistance levels, volatility, risk management, cryptocurrency news, rollercoaster ride, trading strategies, investing, dollar-cost averaging, Elon Musk memes.

BITCOIN May 2020 VS April 2022 Halving. Striking similarities.Bitcoin (BTCUSD) is only a few days before the new Halving event and is already below its 1D MA50 (blue trend-line) for the first time in 2 months, having broken the previous Ascending Triangle pattern.
This is a sequence that we have seen before during the previous Halving (May 11 2020). Of course the Halving took place at the start of the Ascending Triangle and not after it broke but we want to grasp the general picture and as you see the price action around this critically important fundamental event is very similar.
The goal now is for BTC to hold its 1D MA100 (green trend-line) intact as it did in June 2020 (also held it last time on January 23 2024, which delivered a remarkable rebound) and attract new long-term buyers. Notice also the similar 1D RSI Falling Wedge patterns.
The 2020 Triangle reached its 2.0 Fibonacci extension, so that is our next medium-term Target at $90000.
Do you think the 2020 fractal will be repeated? Feel free to let us know in the comments section below!
-------------------------------------------------------------------------------
** Please LIKE 👍, FOLLOW ✅, SHARE 🙌 and COMMENT ✍ if you enjoy this idea! Also share your ideas and charts in the comments section below! This is best way to keep it relevant, support us, keep the content here free and allow the idea to reach as many people as possible. **
-------------------------------------------------------------------------------
💸💸💸💸💸💸
👇 👇 👇 👇 👇 👇

COREUSDT Immediate target = $10.00Core DAO (COREUSDT) declined after a remarkable +735.93% rise buy found Support on the 1D MA50 (blue trend-line). Yesterday posted its 2nd strongest green 1D candle in history and when the 1D RSI breaks above its MA trend-line, we expect the new Bullish Leg to be confirmed. Our Target is $10.00, which represents another +735.93% rise from the bottom.
-------------------------------------------------------------------------------
** Please LIKE 👍, FOLLOW ✅, SHARE 🙌 and COMMENT ✍ if you enjoy this idea! Also share your ideas and charts in the comments section below! This is best way to keep it relevant, support us, keep the content here free and allow the idea to reach as many people as possible. **
-------------------------------------------------------------------------------
💸💸💸💸💸💸
👇 👇 👇 👇 👇 👇

BITCOIN Holding the ATH Zone! Is this like 2017?Bitcoin (BTCUSD) made a sharp decline on Saturday and is now in the process of recovering. The 1W candle wick dived as low as the low of almost 30 days back (March 20), extending the 1-month consolidation since March 13 High. This is of course directly related to the fundamental aspect of BTC's Halving, which is due at the end of the week and historically exerts high volatility onto the market.
Buy even from a technical point of view, those two sell-offs found Support and held the (red) All Time High (ATH) Zone, which is the range taken from the closings of the previous ATH candles. As we can see on the right chart, it was the exact case on the 2014/ 2017 Cycle, which is the Cycle that we first here most tightly correlated Bitcoin's current Cycle.
More specifically, the March 20 and April 10 2017 1W candles, were both contained at the bottom of the ATH Zone and sharply extended the rally right after. This means that the Halving event can be the ideal fundamental 'excuse' to kick-start the rest of the technical rally and fulfil the pattern.
But what do you think? Will history be repeated once more? Feel free to let us know in the comments section below!
-------------------------------------------------------------------------------
** Please LIKE 👍, FOLLOW ✅, SHARE 🙌 and COMMENT ✍ if you enjoy this idea! Also share your ideas and charts in the comments section below! This is best way to keep it relevant, support us, keep the content here free and allow the idea to reach as many people as possible. **
-------------------------------------------------------------------------------
💸💸💸💸💸💸
👇 👇 👇 👇 👇 👇

ONDOUSD Textbook Channel Up.Ondo Finance (ONDOUSD) has been on a Channel Up pattern since its first trading days, supported by the 1D MA50 (blue trend-line). Its last Higher Lows was priced on that exact level, so did the one before (March 19).
The last Higher High was been -11% shorter than the previous, so assuming this is a progressive pattern, we expect a new Higher High at 1.5000 (+ 157%, i.e. -11% lower than the previous).
-------------------------------------------------------------------------------
** Please LIKE 👍, FOLLOW ✅, SHARE 🙌 and COMMENT ✍ if you enjoy this idea! Also share your ideas and charts in the comments section below! This is best way to keep it relevant, support us, keep the content here free and allow the idea to reach as many people as possible. **
-------------------------------------------------------------------------------
💸💸💸💸💸💸
👇 👇 👇 👇 👇 👇

Big Time #BigTime $BigTime Big Time is a perfect example IMO of how people love to #Fomo into ideas while thinking and often even saying out loud how they just WISH they could have been earlier and or had opportunities to buy at lower prices but yet when those times come, they don't show up to buy. lol.
I personally remember thinking at one point many months ago that even if we did get a HUGE correction that I didn't think this would ever again go below the 4.28-$0.29 ranges again. It left and broke through the old all-time high at $0.29 with such force and vengeance and didn't even bother coming back to retest it that i thought it was possibly never coming back below it. If anything, maybe come back and test it for an immediate bounce. However, it came back so far and has crashed so hard IMO this is a GREAT place to begin buying especially for a longer-term hold, but even for a swing trade on this immediate cycle's current moves.
It was crazy how everyone wanted to HOPE they could catch dips below $0.40 ranges and would often even just eat up dips in the $0.48 ranges while talking about how it was going back above $1 and would soon be $3 before $5. Lol now at these prices no one wants to BUY it, lol!
I have begun buying and DCA with force during this dip and think that I will EASILY see 2x in the near future and with patience and still within this cycle 3-5x.
This is actually a working product unlike just pure speculation and vaporware that so many others currently are.
And yet it is below WAY below all major SMA's and EMA's IMO this is the times you buy the FEAR to later sell the Greed of others.
I've purposely given you the same chart and layout but on two different time frames to help newer traders coming into this cycle see how different things can look on a daily vs a weekly time frame.
I think that this can really help speed up learning for many and to open their minds to variables.
As you see the daily can easily in this case look much more instantly bullish and give you the greater feeling of FOMO #Fomo to jump in. Whereas the weekly can give you more of a tactical view and help with your approach being so.
Hopefully some of you find this chart helpful during this stressful pullback/flush that I'm aware has really beaten down and or killed many portfolios for traders.
I've fallen off on posting/sharing my charts these last few months while I was trading ALOT myself and on multiple platforms and various ideas. However, during these more stressful times I will try and stay more active with updating what community I have.
For my birthday without cause or warning X shutdown my larger account @RareBreedOG so I'm starting over fresh with almost no followers now for the algorithm. That being said I would greatly appreciate help with you hitting the like /Follow/share buttons as much as possible if you find these charts helpful at all or even just want to help me rebuild my following after getting Fu**ed by X. For this reason, I don't plan to pay for a checkmark this time around either, but you can all help give me reason to keep sharing and not just leave to other platforms.
Everyone stay safe and trade wisely and be careful with leverage in these uncertain times.

MINA/USDT - Bearish Signs1: Break Daily 200 Moving average
2: Break VWAP
3: Break support at 0.9648 level
after double top price can't go up and start to pullback we waiting these levels
0.5603
0.3560
price maybe go up to retest support or even 200MA or go down fast without retest

GRT going to 1USD ?BINANCE:GRTUSDT on strong weekly support . after btc halving it will pump so hard.
start buying now. Dca if fallas farther .
HODL

Bella Protocol (BEL) completed a setup for upto 87% pumpHi dear friends, hope you are well and welcome to the new trade setup of Bella Protocol (BEL).
Previously we caught nice pump of BEL as below:
On a 4-hr time frame, BEL has completed a bullish Shark move for the next price reversal.
Note: Above idea is for educational purpose only. It is advised to diversify and strictly follow the stop loss, and don't get stuck with trade.

KASPA Still bullish and still strong above the 1D MA200.Back in November (Nov 21 2023) we made a case of why Kaspa (KASUSD) could be imitating Bitcoin's and Ethereum's trend and came up with a logarithmic curve for its growth:
As you can see, in 5 months since then, it has respected this trend-line to perfection. Zooming in on the 1D time-frame, we can see that a shorter term Channel Up pattern is involved. Every time the price broke below the 1D MA50 (blue trend-line) and kept the 1D MA200 (orange trend-line) intact, while the 1D RSI started rising (Bullish Divergence), the market accumulated.
Once it closed a 1D candle back above the 1D MA50, it was a bullish break-out signal. As a result, we are waiting for this break-out to buy and target 0.22500 (+105% rise from the Higher Low).
-------------------------------------------------------------------------------
** Please LIKE 👍, FOLLOW ✅, SHARE 🙌 and COMMENT ✍ if you enjoy this idea! Also share your ideas and charts in the comments section below! This is best way to keep it relevant, support us, keep the content here free and allow the idea to reach as many people as possible. **
-------------------------------------------------------------------------------
💸💸💸💸💸💸
👇 👇 👇 👇 👇 👇

Alikze »» UNI | Pullback to broken structureIn the daily and weekly time, a motivational wave has taken place after the break of the dynamic trigger, which has been extended to the area of the weekly supply of this wave after the pullback.
🔰 Currently, after the failure of the area, there is a correction that this correction form can be in the green box area, after completing it, it can retest the supply area, which in case of failure can continue until the next area of the supply area.
🔰 If the green box is broken, this correction can continue up to 0.50 fibo of the previous wave, which can touch it if the next area continues.
Therefore, according to the correction structure, this form can continue up to the green box area after an upward correction.
»»»«««»»»«««»»»«««
Please support this idea with a LIKE and COMMENT if you find it useful and Click "Follow" on our profile if you'd like these trade ideas delivered straight to your email in the future.
Thanks for your continued support.
Sincerely.❤️
»»»«««»»»«««»»»«««

BITCOIN The Mayer Multiple + Megaphone Roadmap.Bitcoin (BTCUSD) is approaching the top (Higher Highs trend-line) of the Cyclical Megaphone pattern and the current consolidation comes as a natural consequence of the Resistance pressure in close proximity.
Technically, BTC has formed almost the exact same pattern during the previous 2 Cycles. The Megaphone starts when BTC breaks and re-tests the orange Mayer Multiple (2nd std from top) and extends towards the green MM (bottom std).
As the price hits the yellow MM (3rd std from top), it consolidates, even has a short-term technical pull-back, which respects the 1W MA50 (it never breaks until the Cycle Top). Once the top of the Megaphone breaks, Bitcoin starts the final and most aggressive phase of the Bull Cycle towards at least the orange MM.
As a result, we expect a similar behavior once Bitcoin breaks above the Megaphone. A fair estimate for a Target Zone would be 150k - 200k.
Do you think that's realistic? Feel free to let us know in the comments section below!
-------------------------------------------------------------------------------
** Please LIKE 👍, FOLLOW ✅, SHARE 🙌 and COMMENT ✍ if you enjoy this idea! Also share your ideas and charts in the comments section below! This is best way to keep it relevant, support us, keep the content here free and allow the idea to reach as many people as possible. **
-------------------------------------------------------------------------------
💸💸💸💸💸💸
👇 👇 👇 👇 👇 👇

NULS a setup for up to 20.50% pumpHi dear friends, hope you are well, and welcome to the new trade setup of NULS with US Dollar pair.
Recently we caught almost 16% pump of NULS as below:
Now on a 2-hr time frame, NULS has almost completed a Gartley move for the next price reversal.
Note: Above idea is for educational purpose only. It is advised to diversify and strictly follow the stop loss, and don't get stuck with trade.

Aevo completed a setup for upto 60% pumpHi dear friends, hope you are well and welcome to the new trade setup of Aevo with US Dollar pair.
Recently we caught a nice trade of AEVO as below:
Now on a daily time frame, AEVO has formed a bullish Gartley move for the next price reversal.
Note: Above idea is for educational purpose only. It is advised to diversify and strictly follow the stop loss, and don't get stuck with trade.

Frontier (FRONT) a setup for upto 19.50% pumpHi dear friends, hope you are well, and welcome to the new update on Frontier (FRONT) token.
Previously we caught almost 19% pump of FRONT as below:
Now on a daily time frame, FRONT with Bitcoin pair is about to complete a bullish Shark move for the next price reversal move.
Note: Above idea is for educational purpose only. It is advised to diversify and strictly follow the stop loss, and don't get stuck with trade.

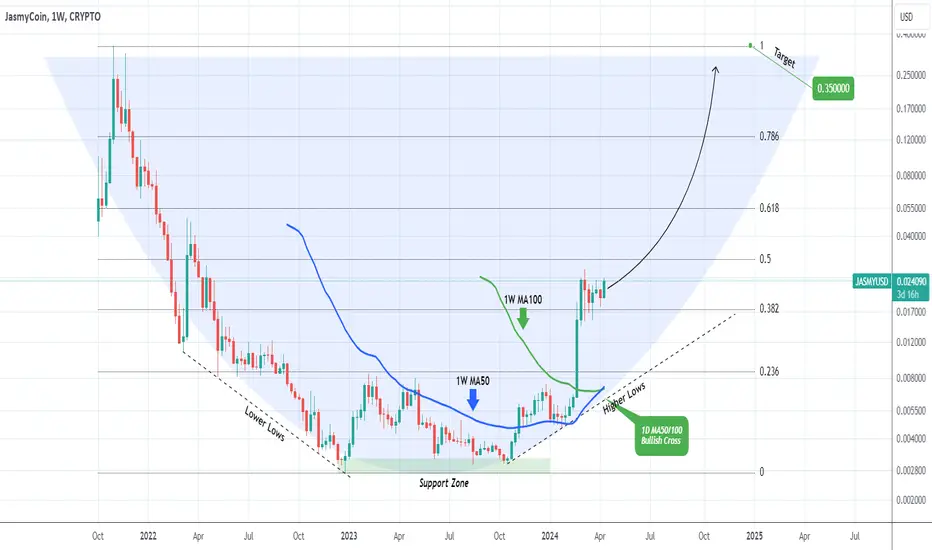
JASMYUSD Giant Cup leading straight to ATH.JasmyCoin (JASMYUSD) is picking up the pace again after 6 weeks of consolidation. The long-term pattern that is emerging is a Cup (potentially we may see a Handle at the top) and this sideways trading the new accumulation before the next Bullish Leg.
Technically it should continue filling up the Fibonacci levels as gaps, with the next being the 0.618 Fib (0.055) and the 0.786 (0.1200) all the way until the All Time High (ATH). As a result our long-term Target is 0.3500.
-------------------------------------------------------------------------------
** Please LIKE 👍, FOLLOW ✅, SHARE 🙌 and COMMENT ✍ if you enjoy this idea! Also share your ideas and charts in the comments section below! This is best way to keep it relevant, support us, keep the content here free and allow the idea to reach as many people as possible. **
-------------------------------------------------------------------------------
💸💸💸💸💸💸
👇 👇 👇 👇 👇 👇
MPCUSDT Cup and Handle formed! Strong BUY!!The MPCUSDT, Partisia Blockchain's token, eventually formed the Cup and Handle (C&H) pattern on the 4H time-frame that we described on our last analysis and today hit the 4H MA50 (blue trend-line) again for the first time in almost a week. Notice how the 4H MA100 (green trend-line) has been supporting the Handle ever since it emerged.
This created MPC's first 4H MA50/100 Bullish Cross and what's left to confirm a new rise is for the 4H MACD to form its first ever Bullish Cross above the 0.000 level. What is also interesting and we certainly want to see it materializing for the long-term, is for Partisia to close the current 1W candle in gains. A green 1W candle this week would be the 2nd one in a row. That would create the necessary conditions for a sustainable bullish reversal towards Resistance levels 1,2 and 3.
From a fundamental perspective, there is a lot of movement and news: the Parti Wallet (MPC Wallet Chrome Extension), partnership with TPC Ventures and many more that you can catch up on their Twitter updates.
Overall out short-term targets of 0.5750 and 0.6900 are intact. Long-term, the sky is the limit.
Stay tuned, this Gem is really an exciting one! We couldn't be more thrilled with its long-term potential!
-------------------------------------------------------------------------------
** Please LIKE 👍, FOLLOW ✅, SHARE 🙌 and COMMENT ✍ if you enjoy this idea! Also share your ideas and charts in the comments section below! This is best way to keep it relevant, support us, keep the content here free and allow the idea to reach as many people as possible. **
-------------------------------------------------------------------------------
💸💸💸💸💸💸
👇 👇 👇 👇 👇 👇

TAOUSDT Strong buy signal above the 1D MA50Bittensor (TAOUSDT) has been trading within a Channel Up pattern since November 20 2023. Both of its Higher Lows have been formed on the 1D MA100 (green trend-line) with the latest being on March 30.
Today the price broke above the 1D MA50 (blue trend-line) for the first time in 2 weeks (since March 26). If the candle closes above it, we expect that to be the start of the new Bullish Leg to a Higher High, similar to the January 24 break-out. Our target is 1800 (+295.98% from the Low, similar to the previous Bullish Leg).
-------------------------------------------------------------------------------
** Please LIKE 👍, FOLLOW ✅, SHARE 🙌 and COMMENT ✍ if you enjoy this idea! Also share your ideas and charts in the comments section below! This is best way to keep it relevant, support us, keep the content here free and allow the idea to reach as many people as possible. **
-------------------------------------------------------------------------------
💸💸💸💸💸💸
👇 👇 👇 👇 👇 👇

Ethereum to reach $4800 ATH?Hello Traders, Skyboxpips here!
Ethereum and Bitcoin had a strong bull run from feburary.
Ethereum experience a resistance level at the $4100 level which mean sellers are holding this level. There is an imbalance and anticipate Ethereum to reach that $4100 level in hopes of a breakout to the top-side so we can go test that $4,800 All time High

Bitcoin (BTC) is back near $69kHello Traders,
We all experience the bitcoin bull run for the previous months. Bitcoin reached the all-time high at SWB:69K before facing a resistance level
Bitcoin is consolidating at SWB:69K level.
We may experience bitcoin continue to the buy-side breaking and closing above the $70k level.
On the weekly timeframe, there is a lot of wicks indicating that sellers are at the $70k level
Do you think Bitcoin will overcome the sell pressure and break in the $70k price range or will this be the roof of the bull run? Share your thoughts

Bitcoin ETF Cash Flow UpdateBitcoin ETF Cash Flow Update: Based on cash flow data, BTC peaked at 73k8 but cash flow was only approximately 1/10 of the previous day
Large funds like Grayscale continuously sell BTC (Today sold 348 million USD)
Besides, technical analysis shows a short-term BTC downtrend. If the important support level in the 58-60k price range does not hold, it will continue to fall to the 50-52k range.

BITCOIN consolidating around ATH = Mega BUY!Quick comparison of Bitcoin's (BTCUSD) current Cycle to the one in 2014 - 2017, which is the one that has been most tightly correlated to and as you can see by the charts below, we have spotted since January 2023, right at the market bottom:
The current consolidation around the previous All Time High (ATH) region is a clear buy signal, in fact based on the 2014/17 Cycle, it is the last we might get before the Parabolic Rally (green) phase starts.
As you can see both Cycle's started with a Falling Wedge leading to the bottom, then the Accumulation Phase as soon as the price broke above the 1W MA50, leading to the 1st take-off Phase to test the ATH.
The 1W RSI will mostly stay overbought from now on until the top of the Cycle, which is not the essence of the current idea, but we expect it to be at least at 200k. The 1W MA50 (blue trend-line) should continue to support until the Cycle Top.
But what do you think? Do you expect BTC to start the parabolic rally phase shortly after the Halving which is around a week's time? Feel free to let us know in the comments section below!
-------------------------------------------------------------------------------
** Please LIKE 👍, FOLLOW ✅, SHARE 🙌 and COMMENT ✍ if you enjoy this idea! Also share your ideas and charts in the comments section below! This is best way to keep it relevant, support us, keep the content here free and allow the idea to reach as many people as possible. **
-------------------------------------------------------------------------------
💸💸💸💸💸💸
👇 👇 👇 👇 👇 👇
