$XRP vs $USDT$XRP vs $USDT. Key area of confluence between horizontal support and EMA 200. Daily chart
Cryptocurrrency

$QTUM support$QTUM vs $USDT could find support at that confluence zone between VPOC (Volume Point of Control) and EMA 200. Daily chart.

$QTUM Support$QTUM vs $BTC could find support in this area of confluence between the VPOC (volume Point of control) and the uptrend line. Daily chart


Crypto Total Market Cap is Bullish Are you?The above chart is very bullish, the downtrend line is broken and the market sees a good reversal. The daily 50 MA is crossing the daily 200 MA in upward direction which is known as the Golden Cross (one of the most bullish events).
The last Golden cross happened in April 2019 and the total market cap gained more than 150% in the next 3 months. The bitcoin price touched the $14,000 during that bull run. We may see the same results in the next 6 months.
Bitcoin will hit $13,000-$15,000 before halving. Long the best assets of the decade. This is a lifetime opportunity.


Possible inverse H&SIf we look at the 4H chart we can see we have flipped resistance to support.
A potential inverse H&S might be forming with the first shoulder and head already printed.

bitcoin last deep, to moonThis is the area where I will enter with great force, only from the technical perspective we have not yet corrected until 0.78 fibonnacci which would be the most relevant area.
We must add that in the monthly graph we are close to ema 55 which I firmly believe will be tested again before a stronger momentum.
There are two options with this bullish count:
1- This would be an ABC of a corrective wave (4) which would lead us to a fifth wave (5).
2- Or this structure is simply a C ending the correction to start a new upward wave cycle
The price may never correct that area and continue from where it is.
Esta es la zona en la que entrare con mucha fuerza, solo desde la perspectiva tecnica todavia no hemos corregido hasta el 0.78 fibonnacci que seria la zona mas relevante.
Debemos agregar que en la grafica mensual estamos cerca de la ema 55 la cual creo con firmeza que sera probada nuevamente antes de un impulso mas fuerte.
Hay dos opciones con este conteo alcista:
1- Esto parece ser una onda (2) corrigiendo para una onda (3) cual nos llevaria a la zona marcada.
2- O esta estructura es simplemente un ABC terminando la correccion para empezar un nuevo ciclo de ondas al alza
Puede que el precio nunca llegue a corregir a esa zona y continue desde donde esta.

Probably an EASY 22% or more on RVNUSDTI think the chart speaks for itself?
Looking super bullish right now.
Consolidating under key resistance.
Strong rejections of dumps.
Very bottomey.

ADAUSDT 100%+No-one seems to be paying attention to ADA but it seems to have bottomed nicely.
I'm expecting a nice healthy 100%+ pump and it could do even more than that.
I haven't added explicit entries, stops, or targets.
If you trade this idea please suit it to your own trading style.
Look at the absolute state of it.

XLM should take back his place soon! bullish flagGuys please watch my suggestions about XLM and UVU . Firstly Stellar should handle the support and getting power to move higher as I see bullish flag . I think XLM should swap Cardano , Monero and Tron very soon and back on top10 position.
BUY : www.hotbit.io
CHECK :https://coinpaprika.com/coin/uvu-ccuniverse/
SITE : ccuniverse.org
I am suggesting to invest in altcoin like : UVU which is new coin but with great perspective. Why UVU ? Because their unique vision based on crypto atm and recharge stations for electric cars . This european project got first successes behind them like listing on big Hotbit Exchange - You can trade there without K-Y-C so registration is easy and fast - brilliant model for less experienced users.
Look into it:
www.hotbit.io
Moreover the price is still cheap it means BIG space to grow. Team predicted that price for 1 UVU should be a round 0.2 USD in March and now its just 0.0028 USD !
Also the cirrculation supply isnt big so it also work for future profit because many coins could be in Yours hand for less payment .
Think serious about investition like this !
Also You will help to grow whole market because their mission to assimilate devices like Crypto Atm to local society .
coinpaprika.com
Check the chart :

Bitcoin possible scenarios! (Great Risk/Reward!)Let me know what you guys think, and what your targets are!

ETH Bull Flag Still in Play: The Bullish ScenarioHere is my take on how ETH bullish scenario will play out... It is still in a bull flag pattern... There are many naysayers out there who are putting articles out there asking for ridiculous prices... Mostly trolls and perma bears who hate the crypto idea, do not understand it nor care to read the white paper of legitimate projects... Of course they totally ignore the positive fundamentals stating that fundamentals have no effect on BTC and ETH, however when negative news comes out they jump on it and make everything doom and gloom... Not saying price crash cannot happen, nothing is 100%, however, price crashes happen for a reason, the last reason was cause the ICO projects holding ETH watched as BTC price was going down and dragging all crypto prices with it including ETH and quickly started converting their ETH holdings from the ICOs into cash to sustain their projects (there was a reason the crash hit ETH so hard!! not just out of the blue!!)
It is interesting that negative articles are usually timed to be released when prices are testing major support levels... Manipulation 101 = Price Manipulation + Social Media Trolls Negativity + Negative Articles
This is just my opinion, noone can say they know what is gonna happen 100%... everything is a risk... charts are not the only thing that decide where prices will go... key fundamentals do still play an important role in influencing prices...
All the best and only trade what you can afford to lose!

BTC Bulls are HODLing $8,700 and the 50 DayThe HODLing Bulls are protecting $8,700 (if not we'll have a bear drop to $8k or $7,700) and have again defended the 50-day. Current pop could see another few tests of $8,700 but I foresee another bounce up to the 200 day.

XRP WEEKLY CANDLE speculative, but at some point we could start seeing weekly candles of the same size as DEC 2017.


bitcoin, nice spot for a longIt looks like BTC took the more bullish pattern. It just tapped on resistance, CCI about to roll up, nice spot for a long today.
If you like my calls, you can see more of them, all my sweet entries, and learn more about trading at my discord Verbatim Crypto Calls discord.gg just click the invite link or message me @VErbadoo#0847
Or if you wanna sponsor me use my ref code for Primexbt primexbt.com Great liquidity, great fees and doesn't overload like bitmex

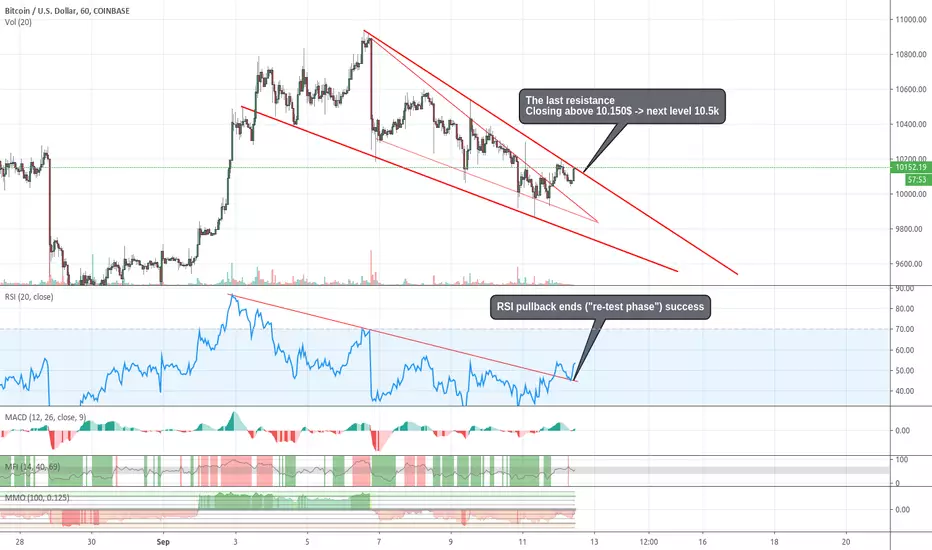
BITCOIN breakout - job done?The last wick support breaks?
RSI already pulled back and retested the prev. falling wedge.
This is an indicator of a strong uptrend.
BTC/USD - LONG swing trade signal - inverted H&SCALL: Long Swing
ENTRY - $10,050 - $9,700
STOP LOSS - $9,252
TAKE PROFIT - $11,800 - $13,100
LEVERAGE : 3-5X
Will post more updates in my group

Bitcoin A Perfect Call!? What Next?We had a great trade. Entered at the 8900-ish support and our target was 9370-ish to 9400-ish for the short term. Price respected all our minor resistances. Waited until 9200 broke up and now if you are a day trader you could sell some around 9370-ish to 9400-ish. Our support is now around 9220 usd, there is minor trendline and 20 MA on the 1hour chart. We have many support lines from the different timeframes between 9200 and 9160 usd. If that doesn't hold we have the trendline currently around 9040-9060 usd. Our next targets could be 9520-ish. Next the blue trendline. Next one is 9730-ish. And 9890-9930-ish. I will update changes. If you like my trades and updates please hit the like button!

Matic goes 10X in a week!this is only the beginning folks! I see this coin going a total of 100-1000X as it is a unique and amazing project worthy of a top 10 market cap! Long for 1$ per coin extrapolates to 35X gains from here!

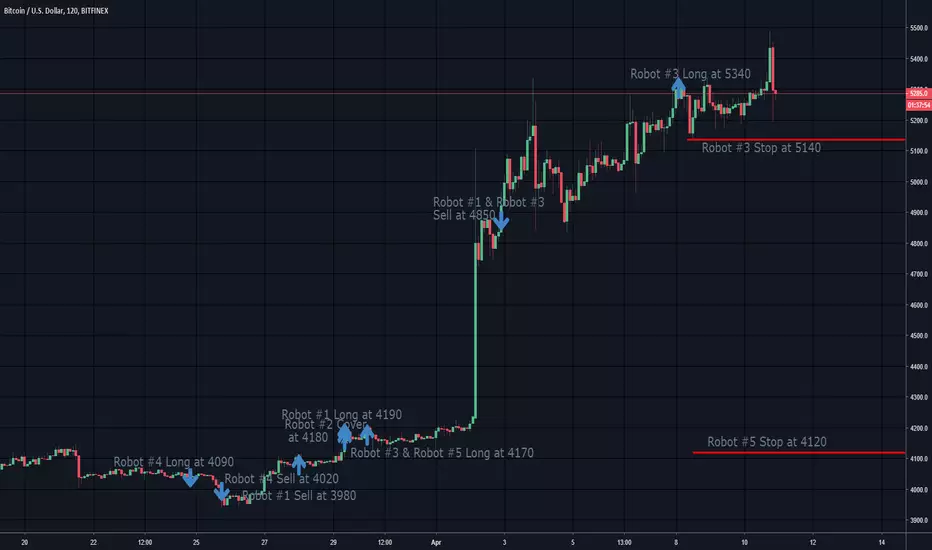
BTCMiddle term direction - up.
Opened positions:
Robot #4 Long at 4090
Robot #5 Long at 4170
Robot #3 Long at 5340
ETH Daily TF Chart Update Already up 4.5% in the current session, ETH is already looking to continue to the next upside resistance in confluence with the prior analysis on the rest of the market.
Breaking out of the $170 weekly resistance region it does appear we could see the $180 monthly resistance in the next day or 2. A breakout of the month resistance leads us to the $200 key level and from there the $220 major resistance region.
For an added confluence by applying the Fibonacci tool to the A wave on the daily. We can see the upside .27 , .618, and 100% extensions align with precision on the upside levels.
I am currently more bullish on ETH in comparison to BTC because it is lagging behind relatively.
*This is not financial advise, and intended for educational purposes only*
