XRP: Range Trading Or...XRP - Range Trading Or...
Ripple is holding very strong despite the market decline from FTX.
As we can see, the price has not yet reached the previous low yet and this is a good sign.
It seems that all XRP fans are still holding Ripple very strongly and mostly at the moment when they are making great strides with the SEC lawsuit.
The price has a higher chance than it already found the bottom and may rise again.
However, we must be careful because we can never know the end of FTX and its impact on it the entire crypto industry.
A price break below the structure can push it lower...so be careful.
Thanks and Good Luck!
Cryptoforecast

ETH Daily TA BearishETHUSD daily guidance is cautiously bearish. Recommended ratio: 5% ETH, 95% CASH.
Happy Veterans Day to those who served.
* MASS CRYPTO DELEVERAGING WATCH. The FTX/Alameda meltdown isn't over yet, and keeps getting crazier with speculation that the troubles at Alameda Research started to amplify after the LUNA death spiral caused SBF to funnel funds from FTX to Alameda and to "altruistically" acquire the insolvent exchanges and lending firms that were overly exposed in order to protect Alameda's own FTT-collateralized loans. The fact that Alameda was essentially comprised of 9 drug-fueled lovers living in the Bahamas is astonishing enough, but even weirder is that both of SBF's parents are "regulatory compliance experts". One thing about this that perhaps changed how it all could've gone down was CZ's (Binance) involvement. I'm under the impression that the crypto crash wouldn't have been so sudden and widespread if CZ wouldn't have tweeted about FTX's struggles, how he was looking to rescue them and then labeling them beyond rescue all within the span of two days. I totally get that CZ likely did it for brand posturing and marketing but he may have also benefited from the massive price increase to BNB after the initial tweet offering to acquire FTX. Fair game though. It's a bit too early to try to predict the end of this mass deleveraging that is currently taking place throughout the Crypto industry and more industry players may go down from this in the coming days, so it's suggested to stay in cash until there's some kind of light at the end of the tunnel. The UofM November Consumer Sentiment Index is 54.7, down from 59.9 in October and likely reflective of the political shift from the Midterm elections.
Key Upcoming Dates: Fourth GDPNow Q4 GDP estimate 11/16; Russia/Ukraine Grain Deal Expiration on 11/19; 2nd Estimate of US Q3 GDP at 830am (EST) 11/30; October PCE Index at 830am EST 12/01 ; Last FOMC Rate Hike Announcement of 2022 at 2pm EST 12/14 . *
Price is currently testing $1270 minor resistance for the third consecutive session after breaking below the 50MA and the uptrend line from June 2022. Volume finished yesterday's session High (moderate) and is currently on track to favor sellers for a second consecutive session if it closes today's session in the red; Price is currently testing the second largest VP supply/demand zone on the chart. Parabolic SAR flips bullish at $1600, this margin is bullish at the moment. RSI is currently trending down at 40 after forming a peak at 43 and will likely aim to test the uptrend line from November 2018 at 37 support in the coming sessions. Stochastic remains bullish and is currently trending up at 33 with no signs of peak formation, it's still technically testing 23 resistance. MACD remains bearish and is currently trending down at -25 as it approaches -46 minor support with no signs of trough formation. ADX is currently trending up slightly at 32 as Price continues to see selling pressure, this is bearish at the moment.
If Price is able to breakout above $1270 minor resistance then it will likely aim to formally retest the 50MA at ~$1395 as resistance . However, if Price is rejected here, it will likely formally retest $1k minor support before potentially falling lower to $776 minor support. Mental Stop Loss: (two consecutive closes above) $1300.

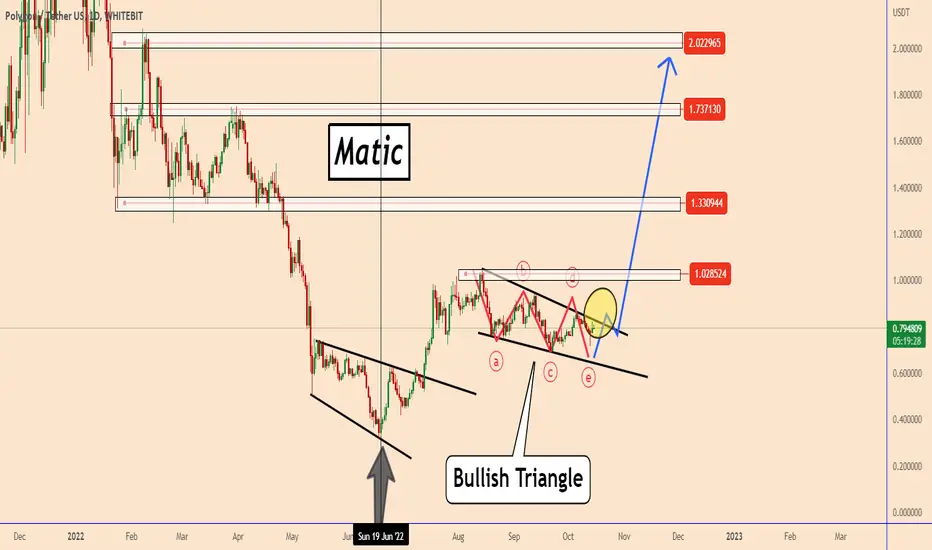
📣MATIC: ABCDE Correction Is Almost Completed📣MATIC: ABCDE Correction Is Almost Complete
Since the mid of June price is trying to develop a bullish
wave.
During the last two months we can see a very nice bullish triangle pattern
that looks almost completed.
If the price will manage to breakout above the pattern it will keep
rising further.
Targets on the chart!
Thank you and Good Luck!
Luna 2.0 : Price May Retest $6.8 Again Luna 2.0 : Price May Retest $6.8 Again
As of June 2022, Luna is trading within an Accumulation Zone located between 1.5475 - 2.6610. After the price broke out of this area on September 09, ,2022 we saw the price rising by approximately +280%
Later, the price moved back down to the middle of the zone after the first sell-off and no it is trying to bounce back up.
The price could make another strong upward move considering the strong speculative moves associated with LUNA.
Targets I'm looking at:
3.4668
3.8090
4.5848
6.8217
Thank you and Good Luck!

BTC Daily TA Cautiously BearishBTCUSD daily guidance is cautiously bearish. Recommended ratio: 35% BTC, 65% Cash.
* BULL TRAP WATCH . The FOMC Minutes confirmed what every investor should be aware of and that is that the Federal Reserve will remain committed to raising the federal funds rate to restrictive levels until a meaningfully sustained decrease in inflation is observed. FOMC members noted that despite a slowdown in the labor market, the economy is still in good enough shape to withstand more rate hikes. Cryptos, Equities, Commodities, VIX, GBPUSD, EURUSD and CNYUSD are flat or down while DXY, US Treasuries, JPYUSD and Equity Futures are up. CPI reports tomorrow and will likely send markets lower if it doesn't show signs of slowing. Key Upcoming Dates: September US CPI at 830am EST 10/13 ; September US Retails Sales at 830am EST 10/14; 18th GDPNow US Q3 GDP Estimate 10/14; UofM October Consumer Sentiment Index at 10am EST 10/15.*
Price is currently trending down at ~$19100 and is risking losing $19417 minor support. Volume broke a two day streak of seller dominance and finished today's session High (low), it's currently on track to favor sellers if it closes tomorrow's session in the red. Parabolic SAR flips bearish at $18500, this margin is bearish. RSI is currently trending down slightly at 43.75 as it approaches a retest of 42.41 support. Stochastic remains bearish and is currently completing a trough as it approaches a bullish crossover at 6.50. MACD is currently beginning to trend bearish at -232.42 minor support after 3 consecutive sessions of trending sideways at this level. ADX is currently beginning to form a trough at 13.50 as Price is beginning to trend lower and risk losing $19417 minor support.
If Price is able to bounce here, be leery of a potential bull trap as it approaches a retest of the 50 MA at ~$19700 as resistance which should also coincide with the descending trendline from November 2021 (as resistance). However, if Price breaks down here and loses $19417 minor support, it will likely retest the uptrend line from March 2020 at ~$15k as support for the first time since September 2020. Mental Stop Loss: (two consecutive closes above) $20k.

Fundamental BTCUSDT Pair Analysis of 2022 Last Quarter phaseOur market analysis shows that we have reached end of the BTC-DEAD cycle period for BTCUSDT pair .
Green line indicates strong oversold consonant with blue line which indicates demand for SHORT positions in the market is reducing proportionaly.
The symmetry alights over weekly period for Price Action of the Asset hence indicating strong market reversal is imminent
We expect sharp rise to 20,500 mark within couple of days, then slight retraction to 19,300 level and next pull towards 25,000 whereby new support levels will be established for long term bull market.
We also expect altcoins to follow similar pattern as mentioned and gold commodities to take inverse pattern as usual.

BTCUSDBTCUSD
The market is losing activity, the price has been falling for almost a year without a normal rebound, we can say that there is no one to shave. The price has approached the descending trend line, breakdown and consolidation above the descending trend line, a good rebound is possible, which will attract new money to the market. If there is a good bounce, it does not mean that the bearish trend is over.
If you like the idea, don't forget to subscribe and rate like👍

BTCUSD: Ascending triangleBTCUSD: Ascending triangle
Bitcoin has drawn an ascending triangle + 4 touches of a descending trend line. If you look at the book, then almost 100% the price will increase.
There are also many other ideas, mostly expected to enter the market, working against the majority.
I would rate 50/50 where the price would go. If you buy bitcoin, then for a small% of the deposit.
If you like the idea, don't forget to subscribe and rate like👍

XLM | Stellar Has Been Accumulating Volume Since MayXLM | Stellar Has Been Accumulating Volume Since May
Price is testing the bottom of the pattern for the third time
and thereby creating a potential megaphone pattern.
During the last days, the price increased by about 17%.
A good part of the movement was supported by XRP.
XRP is showing positive developments regarding the lawsuit they have.
This is one of my favorite projects and it should grow further.
Targets:
🎯 0.15072
🎯 0.17021
🎯 0.23681
Thanks and Good Luck!

ETH Daily TA Neutral BullishETHUSD daily guidance is neutral with a bullish bias. Recommended ratio: 60% ETH, 40% Cash.
* Cleveland Fed President Mester said today that she expects to see an uptick in Unemployment but that the Fed remains "singularly focused on fighting inflation" . In the same regard, she mentioned that she doesn't see any rate cuts in 2023. Key Upcoming Dates: September US Employment Situation at 830am EST 10/07; FOMC Members Kashkari, Waller and Williams speak on 10/07; FOMC Minutes at 2pm EST 10/12; September US CPI at 830am EST 10/13; September US Retails Sales at 830am EST 10/14; UofM October Consumer Sentiment Index at 10am EST 10/15.*
Price is continuing to trend sideways at ~$1350 for a fourth consecutive session. Volume has been High (moderate) and favored sellers for the past two sessions, if it closes today's session in the green it will likely imply that more choppy trading is to be expected in the near term. Parabolic SAR flips bearish at $1229, this margin is neutral at the moment. RSI is currently trending up slightly at 46, the next resistance is the descending trendline from February 2020 at ~52. Stochastic remains bullish as it defies a bearish crossover at 96, the next resistance is at max top. MACD remains bullish and is currently continuing to form a soft peak as it tests -46.46 resistance. ADX is currently trending down at 30 as Price continues to trend sideways and attempts to move higher, this is neutral at the moment.
If Price is able to break out to the upside then it will likely retest $1427 resistance . However, if Price breaks down here, it will likely retest $1270 minor support . Mental Stop Loss: (two consecutive closes below) $1270.

BTC Daily TA Neutral BullishBTCUSD daily guidance is neutral bullish. Recommended ratio: 60% BTC, 40% Cash.
*Cryptos, Equities, EURUSD and GBPUSD are all down while Equity Futures, Commodities, DXY, US Treasuries and VIX are all up. OPEC+ and the USA continue their ongoing battle as OPEC+ defied USA requests to not cut output . Key Upcoming Dates: FOMC Member Loretta Mester speaks twice on 10/06; September US Employment Situation at 830am EST 10/07; FOMC Members Kashkari, Waller and Williams speak on 10/07; FOMC Minutes at 2pm EST 10/12; September US CPI at 830am EST 10/13; September US Retails Sales at 830am EST 10/14; UofM October Consumer Sentiment Index at 10am EST 10/15.*
Price is currently testing the 50 MA as resistance at ~$20100 after bouncing off of $19417 support. Volume is High (moderate) and on track to break a two day streak of buyer dominance if it can close today's session in the red. Parabolic SAR flips bearish at $18627, this margin is neutral at the moment. RSI is currently trending down at 54 after forming a peak just below 57.34 resistance, the next support is the descending trendline from January 2021 at 42.41. Stochastic remains bullish for a second consecutive session and is currently trending up at 96 as it approaches a test of max top with signs of a soft peak formation beginning to show. MACD remains bullish and is currently trending up slightly at ~-100 as it continues to technically test -232.42 minor resistance with signs of a soft peak formation beginning to show. ADX is currently trending down slightly at 18 as Price attempts to push higher, this is mildly bearish at the moment.
If Price is able to break out above the 50 MA at ~$20100 then it will likely retest the descending trendline from November 2021 at ~$22200 as resistance . However, if Price is rejected here, it will likely retest $19417 support before potentially falling lower to retest the uptrend line from March 2017 at ~$15k as support . Mental Stop Loss: (two consecutive closes below) $19417.

WBT| WhiteBIT Token| The Next +10X Trade Is Moving🔥WBT| WhiteBIT Token| The Next +10X Trade Is Moving🔥
From the previous analysis, we can see that the price increased
approximately +57%.
When I posted the previous analysis the price was $3.8 and now it is $5.93.
This is showing that the bullish volume is increased a lot.
The expansion that WhiteBIT is doing to create easier trading opportunities also
in other brokers for its token WBT is helping the token e lot to increase its value.
The chances are very high that we can see any exponential price growth during
this month above the targets that I have placed on the chart.
As you can see $10 looks like a very realistic target as long as it was reached once:)
My expectations are that the price should increase more than those targets.
Thank you and Good Luck!
Previous Analysis:

XRP | Ripple Rose +17% On New SEC Lawsuit Developments -NEXT?XRP | Ripple Rose +17% On New SEC Lawsuit Developments -NEXT?
Ripple Labs scores a big victory as Judge Torres orders the SEC to turn over documents
from a 2018 speech given by William Hinman, then SEC Director of the SEC’s Corporate Finance Division
This decision comes after a long battle that could decide the fate of many cryptocurrencies. - (source cryptosnewss)
Technical analysis:
After the price created a new high near 0.5590 the price pulled back by
correcting approximately 50% of the bullish movement that began September 6, 2022.
This deep correction was stoped from the support area and also a very strong structure near 0.4100.
As we can see the bounce was very strong by showing also that the buyers were well positioned to add
on their long positioned at near that zone
On the 4-hour chart, that price completed a very beautiful bullish triangle pattern and the news related to
SEC is supporting this crypto double this time.
Targets are still the same:
🎯 0.59567
🎯 0.70017
🎯 0.88119
Thank you and Good Luck!
Previous Analysis:

ETH Daily TA Neutral BullishETHUSD daily guidance is neutral with a bullish bias. Recommended ratio: 51% ETH, 49% Cash.
* BOUNCE WATCH. Cryptos, Equities, Futures, DXY, US Treasuries, Gold and Natural Gas are down while VIX, GBPUSD, EURUSD, Oil, and Agriculture are up. The final US Q2 GDP revision came in at -0.6% compared to -1.6% in Q1 , this is largely due to to a boost in exports and returning consumer spending in the service industry (travel being the leader). Key Upcoming Dates: August US PCE price index at 830am EST 09/30; S&P US September Manufacturing PMI at 945am EST 10/03; September Employment Situation at 830am EST 10/07.*
Price is currently continuing to trade sideways at ~$1300 as it aims to defend $1270 minor support for the fifth consecutive session, the next resistance is at ~$1427. Volume is currently Moderate (high) and on track to favor sellers in today's session; it has been alternating between buyer and seller dominance for the past five sessions which is indicative of a critical supply/demand zone (VP) and/or consolidation. Parabolic SAR flips bullish at $1403, this margin is mildly bullish at the moment. RSI is currently trending down at 40 as it approaches a test of the uptrend line from November 2018 at 38 as support and 36.91 support below that. Stochastic is currently bullish and trending up at 77 as it approaches 80.69 resistance. MACD remains bearish and is currently on the verge of crossing over bullish at -73, if it can push to -72 then it would confirm a bullish crossover. ADX is currently slightly trending up at 33 and is beginning to form a soft peak as Price attempts to hold $1270 minor support.
If Price is able to keep pushing higher then it will likely retest $1427 resistance . However, if Price breaks down here, it will likely retest $1270 minor support before potentially retesting $1k psychological support. Mental Stop Loss: (one close below) $1270.

BTC Daily TA Neutral BearishBTCUSD daily guidance is neutral with a bearish bias. Recommended ratio: 40% BTC, 60% Cash.
*Technically, BTC and many other Cryptos look relatively good right now compared to Equities which have continued to get sold off in favor of DXY and US Treasuries; some may view this is as a decoupling moment, others as a market lag, and me as a technical correction ("everything is bearish, so it's bullish"). Fed Chair Jerome Powell reiterated the need for crypto regulation , and also mentioned that it would take years of additional research for a 'Fedcoin', at a French central bank event today. September US Consumer Confidence rose to 108 compared to 103.6 in August . In the same optimistic light, US New Home Sales went up 28.8% from 532k in July to 685k in August . The 14th GDPNow Q3 GDP estimate remained the same as on 09/20 at 0.3% . Key Upcoming Dates: Final US Q2 GDP revision at 830am EST 09/29; August US PCE price index at 830am EST 09/30; S&P US September Manufacturing PMI at 945am EST 10/03; September Employment Situation at 830am EST 10/07.*
Price is currently retesting $19417 support for what is now 26 out of the past 30 sessions after briefly touching $20.4k. Volume is currently High (high) and on track to favor sellers for what would be four out of the past five sessions if it closes today's session in the red. Parabolic SAR flips bullish at $20474, this margin is bullish. RSI is currently trending down at 43 after getting rejected by the descending trendline from January 2021 at ~44, the next support is at 42.41. Stochastic remains bullish and is currently testing 55.55 resistance with no signs of peak formation. MACD remains bearish and is currently on the verge of crossing over bullish at -453, if it can stay above -453 this would be a bullish crossover; the next resistance (minor) is at -232.42. ADX is currently trending down at 25 as Price attempts to get back above $19417 support, this is mildly bearish.
If Price is able to close above $19417 support for two consecutive sessions, it will likely retest the 50 MA at ~$21k as resistance before potentially retesting the descending trendline from November 2021 at ~$22k. However, if Price continues to break down here then it will likely retest the uptrend line from March 2017 at ~$15k as support . Mental Stop Loss: (two consecutive closes above) $19417.

BITCOIN | Next Targets 22.5K and 25KBITCOIN | A Short Term Bullish Scenario
Following my base idea that I published two days ago we can see
that the price is moving very well.
If you joined this trade earlier you should be near +8% in profit.
Actually, the price is above the support area of 19900.
The price breakout looks very solid and it is showing that BTC may increase more
in the coming days.
The support area near 18.2K showed to be very strong.
Neither the NFP, CPI nor FOMC didn't push it lower than the previous low.
So it has a higher chance to increase again as shown on the chart!
Thank you and Good Luck!
Previous Idea:

ETH Daily TA Cautiously BearishETHUSD Daily guidance is cautiously bearish. Recommended ratio: 10% ETH, 90% Cash.
* SUNDAY SCARIES WATCH . This is one of those rare occasions where FA alone can essentially tell you that Equities and Cryptos are both going to continue seeing selling pressure as long as DXY keeps raging higher. As long as the Fed keeps raising rates and Russia keeps raising reinforcements, this shouldn't be too difficult. DXY looks poised to retest $120 for the first time since 2000-2002 (Dot-Com bubble peaked in 2000). Key Upcoming Dates: September US Consumer Confidence Index at 10am EST 09/27; August US New-Home Sales at 10am EST 09/27; Final US Q2 GDP revision at 830am EST 09/29; August US PCE price index at 830am EST 09/30.*
Price is currently attempting to continue trending up after bouncing off of $1270 minor support, the next resistance is at $1427. Volume is currently Moderate (low) and on track to favor buyers for a third consecutive session. Parabolic SAR flips bullish at $1485, this margin is neutral at the moment. RSI is currently trending up slightly at 39 as it attempts to reclaim support of the uptrend line from November 2018 at 38 after bouncing from the uptrend line from January 2022 at ~32 as support; if it can stay above 38 it would imply that Price may have found a near-term bottom. Stochastic remains bullish and is currently testing 17.81 resistance with no signs of peak formation. MACD remains bearish and is currently testing -46.46 support as it continues to form a trough. ADX is currently trending up at 29 as Price continues to fall, this is bearish.
If Price is able to continue going up here then it will likely retest $1427 resistance . However, if Price breaks down here it will likely retest $1270 minor support before potentially falling to retest $1k psychological support . Mental Stop Loss: (two consecutive closes above) $1427.

BTC Daily TA Cautiously BearishBTCUSD Daily guidance is cautiously bearish. Recommended ratio: 10% BTC, 90% Cash.
* US August Consumer Confidence rose for the first time after three consecutive months of decline and is now 103.2 , up from 95.3 in July. Meanwhile, Russia is furthering the WW3 narrative and the Federal Reserve is pushing the US into a recession... very 2022. Though Cryptos are mixed in price action today they are fairing better than Equities which have continued to plummet. Commodities, Equity Futures, EURUSD and Gold are all down while VIX, US Treasuries and DXY continue to go higher with DXY reaching a 22 year high of $112 in today's session. As long as DXY keeps going up, which it likely will if FFR keeps going up, it's going to suck liquidity from just about every other asset. Russia and China are currently wildcards that can either exacerbate or mitigate a financial migration to DXY as a safe haven asset. Key Upcoming Dates: September US Consumer Confidence Index at 10am EST 09/27; August US New-Home Sales at 10am EST 09/27; Final US Q2 GDP revision at 830am EST 09/29; August US PCE price index at 830am EST 09/30.*
Price is currently trending down at ~$18700 after being rejected by $19417 resistance for the third consecutive session. Volume is currently Moderate (high) and on track to favor sellers for three of the past four sessions if it closes today's session in the red. Parabolic SAR flips bullish at the 50 MA ($21.3k), this margin is neutral at the moment. RSI is currently trending down at 40 after being rejected by the descending trendline from January 2021 at 45 and breaking below 42.41 support. Stochastic remains bearish and is currently trending sideways at 15 as it attempts to crossover bullish. MACD remains bearish and is currently trending down at -571 with no signs of trough formation as it approaches -869 minor support. ADX is currently trending up at 24.34 as Price continues to fall, this is bearish.
If Price is able to bounce here then it will have to flip $19417 resistance to support if it is to test the descending trendline from November 2021 at $21k. However, if Price continues to break down here, it will likely retest the uptrend line from March 2017 at ~$15k as support . Mental Stop Loss: (two b2b closes above) $19417.

ETH Daily TA Cautiously BearishETHUSD Daily guidance is cautiously bearish. Recommended ratio: 20% ETH, 80% Cash.
* The Fed announced a 75bps FFR hike today, and so starting tomorrow the FFR target range will be 3%-3.25% . Cryptos initially rallied on the announcement and are now down while Stocks continued to plummet. Equity Futures and EURUSD are down while VIX and DXY are up; Commodities and US Treasuries remain mixed. Interestingly, looking at the Fed dot plot, twelve of nineteen Fed Presidents and Governors think that FFR should be between 4.5% and 5% at some point in 2023 . Meanwhile, today Putin announced a 'partial mobilization' of 300k Russian military reservists in an escalation of Russia's attack on Ukraine . Key Upcoming Dates: S&P US September Manufacturing PMI at 945am EST 09/23; September Consumer Confidence Index at 10am EST 09/27; August US New-Home Sales at 10am EST 09/27; Final US Q2 GDP revision at 830am EST 09/29; August PCE price index at 830am EST 09/30.*
Price is currently trending down at ~$1250 as it breaks away from any hope of hanging on to $1427 support. Volume is High (moderate) and on track to favor sellers for a second consecutive session. Parabolic SAR flips bullish at $1620, this margin is bullish at the moment. RSI is currently trending down at 33 as it quickly approaches a retest of the uptrend line from 01/22/22 at ~31 as support. Stochastic is currently neutral trending sideways at 5 for the fourth consecutive session, the next support is max bottom. MACD remains bearish at -79 as it approaches a test of -46 support for the first time since May 2022. ADX is currently trending up at 24 with no signs of peak formation as Price continues to fall, this is bearish.
If Price is able to bounce here then it will likely retest $1427 resistance . However, if Price continues to fall here then it will likely retest $1k psychological support before potentially testing $776 support for the first time since January 2021. Mental Stop Loss: (two consecutive closes above) $1427.

BTC Daily TA Cautiously BearishBTCUSD Daily guidance is cautiously bearish. Recommended ratio: 25% BTC, 75% Cash.
* FOMC WATCH/BOUNCE WATCH . August US Housing Starts came in 12.2% higher than in July and Building Permits came in 10% lower . So more people were buying homes than in the month prior as if the economic situation was improving, or maybe they were trying to lock in a rate they won't see until 2025 or 2026. And less people were building, which is more in line with what one might expect as the world is on the brink of a deep recession. Today's residential construction data should force the Federal Reserve to go with a 100bps FFR hike tomorrow but the odds are still in favor of it being a 75bps hike. Cryptos, Equities, Futures, Gold, EURUSD and Energy are all down while DXY, US Treasuries and VIX are up once again. It's only logical to assume that the DXY will continue its correlative relationship with rising FFR hikes; not to mention the added boost that an official announcement of global economic recession would give to USD. The 13th GDPNow US Q3 GDP estimate came in at 0.3% compared to 0.5% on 09/15 . Key Upcoming Dates: FOMC meeting 09/20-09/21 (Statement Released at 2pm EST on 09/21); S&P US September Manufacturing PMI at 945am EST 09/23.*
Price is currently trending down at $19k and is still technically testing $19417 major support for a third consecutive session. Volume is Moderate (high) and has been fairly balanced between buyers and sellers in the past few sessions, indicative of speculation before an upcoming major event. Parabolic SAR flips bullish at $22100, this margin is mildly bullish at the moment. RSI is currently trending down at 39 after being rejected by 42.41 resistance, the next support is the uptrend line from 01/22 at ~30-32. Stochastic remains bearish after a rejected crossover attempt and is currently testing 29.70 support. MACD is bearish for the third consecutive session and is currently trending down at -452, the next support is at -869. ADX is currently trending up slightly at 21 as Price continues trend lower, this is mildly bearish at the moment.
If Price is able to bounce here (and defend $19417 support) then it will likely retest the 50 MA + the uptrend line from 06/18/22 at ~$21.4k as resistance . However, if Price continues to break down here, it will likely retest the uptrend line from March 2017 at ~$15k as support for the first time since September 2020. Mental Stop Loss: (two consecutive closes above) $20k.

XRP | The Price May Rise Further After The BreakoutXRP | The Price May Rise Further After The Breakout
On the lower part of the structure XRP testested
the old and the strongest support area again by creating in this way a bullish triangle.
The price is actually above the pattern by increasing the chances
for the next bullish movement.
It looks like it will not stay for a longer time period in the zone were it is right now.
Targets:
🎯 0.44491
🎯 0.58862
Thank you and Good Luck!

XTZUSD: long termXTZUSD: long term
The price is fixed below large volumes.
Perhaps the price will look for a new bottom before the end of the bear market.
If you like the idea, don't forget to subscribe and rate like👍

BTCUSDBTCUSD
Breakout of the bottom of the current trend line
Targets in the area 20379-20748
If you like the idea, don't forget to subscribe and rate like👍
