CIX wide range trading is not over yet❗️💎One of our expected CIX scenarios came true, and we already witnessed a 17.43% correction. What is important is that CIX has approached the 61.8% Fibonacci retracement level along with the simple uptrend trendline. Therefore, the 242.000 area can become strong support, but we need ...
Cryptoindex

Crypto Index correction could be over❗️💎The expected pullback is now taking place on CIX. Our scenario suggested ............

BAT or CRAB?harmonic pattern:
AB=0.38 XA
BC=0.88 AB
0.61 XA=$52220
*1.6 BC=$55154
0.78 XA=$59137
2 BC=$61702
0.88 XA=$63682 *bat*
2.24 BC=$66208
*2.6 BC=$73981 *final target of bat*
1.13 XA=$76290
1.27 XA=$84748
1.41 XA=$93865
*3.6 BC=$99236
*1.6 XA=$109492 *final target of crab*
4.23 BC=$118985

CRYPTO INDEX - We will see a pullback before the rally ⁉️💎The Crypto Index is starting to look bullish as higher lows and higher highs pattern is already in place on lower timeframes. At the same time, we can see the break above the 225,500 resistance area, which has now become the demand zone.
💎The upside breakout should invite buyers, although ..............

Crypto 30 index: huge resistance lineExpected rebound to 19,000 but there was an important bearish move on the long-term resistance level. If the price doesn't go beyond 19,000 there will be a huge correction on cryptos again. This index tracks the top 30 cryptos based on market cap. It's getting more and more popular as a breath indicator of the crypto market. We don't own cryptos right now expecting a new bearish move, that is waiting for a good buy-and-hold opportunity, so far incoming inflation and intervention by the Fed pose a tremendous risk on cryptos as well as stocks. March could be another volatile month for cryptos.

CIX (CRYPTO INDEX) BUYCIX (CRYPTO INDEX) BUY, It gets better with time. You begin to foresee the future, this is one of those very big opportunities to choose from.


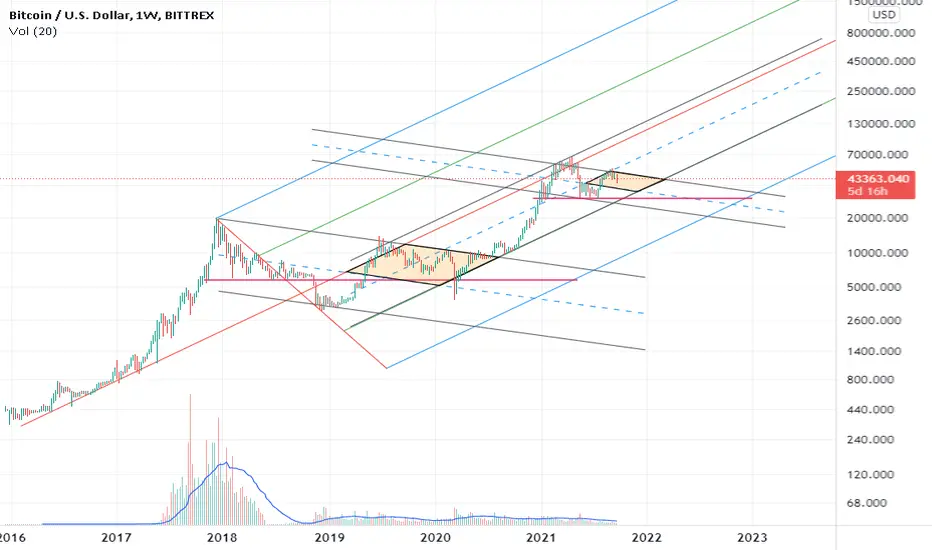
a simple trend analysisBitcoin isn't in the sky, it's on the ground! do you see the buying opportunity?

the most valid Fibo levels of BITCOINcrab harmonic pattern:
X=$43768
AB=0.38 XA
BC=0.88 AB
*1.6 BC=$3998
2 BC=$8522
0.78 XA=$12506
2.24 BC=$13711
0.88 XA=$22456
*2.6 BC=$28997
1.13 XA=$93681
*3.6 BC=$210322
1.41 XA=$482478
4.23 BC=$715630
*1.6 XA=$1630279

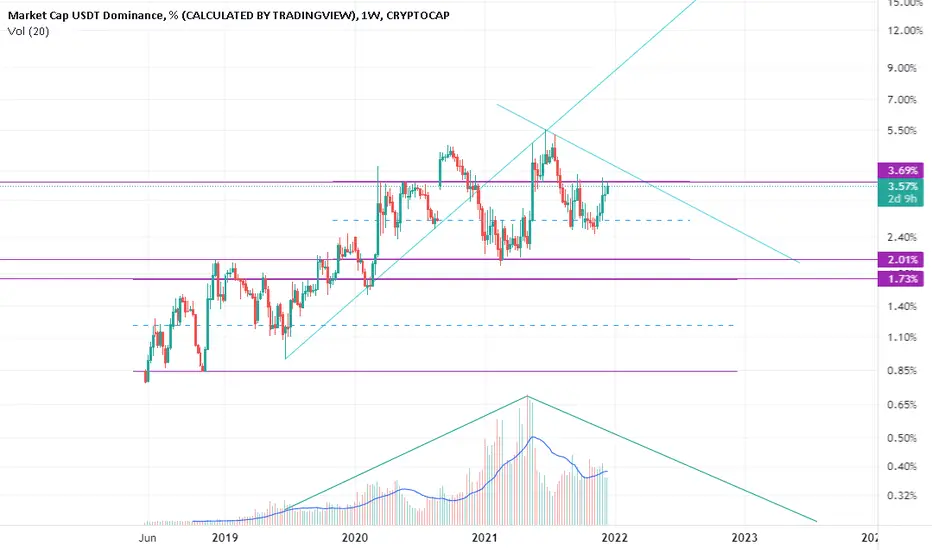
Crypto IndexTotal crypto market cap analysis is very useful four major cryptocurrencies and real scenario of future in the crypto world so look it carefully, it have measured trendlines and measure support and resistance levels I have no money to do trades but I have something to give people which is my learnings.

don't hold USDT. FED is printing dollorthis bloody market is buying opportunity. find the best projects and invest in it. future is for cryptocurrency.
Fibo levels of BITCOINbutterfly harmonic pattern:
AB=0.78 XA
BC=0.88 AB
1.41 BC=$22693
1.13 XA=$24140
*1.6 BC=$29559
*1.27 XA=$31172
1.41 XA=$39965
2 BC=$48030
1.6 XA=$58119
*2.24 BC=$65158 *final target of butterfly*
2.6 BC=$105338
2 XA=$115615
2.24 XA=$178104
2.6 XA=$351756
3.6 BC=$375383
4.23 BC=$823272

NCI SituationSimply Trend break is seen in Whole Crypto Index. For now fibonacci 0.5 level seems to be the support of NCI. If it rebounds from 0.5 level then Ethereum and Bitcoin make new ATH.

end of E wave is near to start the 3rd waverising channel seems a bearish pattern with $24K target but since it is in the bottom of the big pattern it could be bullish. the 3rd wave could start from these prices and reverse at $420 with crab harmonic pattern.
Fibo levels:
1.6 BC=$31146
2 BC=$51178
1.6 XA=$62000
2.24 BC=$69917
2.6 BC=$114287
2 XA=$125288
2.24 XA=$194848
2.6 XA=$390000
3.6 BC=$420000

Crypto break before ATHCAPITALCOM:CIX So we did get a double top, and a swift in the momentum, to the upside.
If we take a look at the ATR for each day, we can clearly see that the last 3 days (red dots) we did close red, but also the ATR, did increase, and that kinda intresstring...
What we also can see, is that we got a swing to the upside for 28,63 %, if we look at the (swing number one) that was an 28,28% swing, after that we got a downswing for 21,95 %, and after that 12 days consolidation, before going even lower.
Will we find support at the green box, consolidate for some days, and get a new swing low, before moving up to ATH?

What is happening on BITCOIN?after the breakout of 65K, the greed increased in the market with new ATH. 65K was 1.6 XA and an important Fibo level. but why the momentum of BITCOIN didn't increase and rejected from 69K. it was because of the 2.24 BC Fibo level. Since Bitcoin is a butterfly, 69K could be a massive resistance and could crash to 25K. but the situation of the pitchforks makes hope that BITCOIN transform into a crab and surges to 2.6 and maybe 3.6 FIBO levels.

Cryptoindex.com (CIX100) is in more than 100 days consolidationLooks like Cryptoindex.com 100 (CIX100) is ready for trend reversal. I am expecting 300% return after CIX100 gives breakout from more than 100 days long consolidation. It may move side ways for couple of weeks before breakout, be patient.

bullish double or triple combinationafter the breakout of $59500, I believe bitcoin could breakdown $65000 and make a new ATH at $72000 with a bullish double combination but still have a chance of the triple combination.

NASDAQ CRYPTO INDEX AnalysisThe NASDAQ Crypto Index has broken its neckline resistance on higher time frames (1D) and is currently holding above it with more than decent strength.
The cup and handle pattern that could be starting to form after this breakout is probably the most significant indicator of what we can expect from the market in the next 3-4 months.
If we see successful neckline support (previously resistance), the market would be sending the confirmation institutional investors are waiting for before entering significant long positions for BTC, ETH, and other large-cap alts, which would be the cause for a definite ATH break.
--------------------------------------------
Best Regards, iSmashProfit™

double combination or triple combinationBitcoin could break out the 45.2K with a double combination or retest 39K with a triple combination. the market could be extremely bloody for the short term and slide to 34.8K or 31K and even 24K after bitcoin touches 48K or 54K. I'm extremely bullish on Bitcoin after this scenario happened.

Bitcoin in the diamond, descending channel or triangleeveryone knows the long term of Bitcoin is bullish but the short term of it is unpredictable to position on the altcoins.
consolidation between 43K and 48KBTC needs consolidation between 43K and 48K with an abcde triangle pattern to prepare for 54K and 59K.

in the middle of August the crypto market will explodein the middle of August, the crypto market will explode. Monday market will be bloody and Temporarily you can open a short position.
