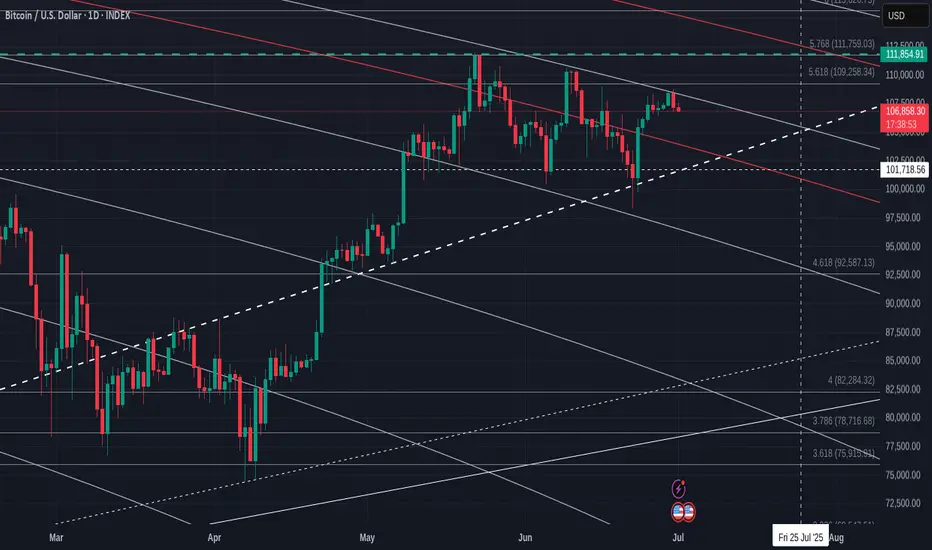
Bitcoin Daily in a large pennant with apex end of July
Bitcoin is once again getting rejected off the Fib circle just above.
This is also just under a 618 Fib extension and so a combined rejection zone.
Beneath this, we have support on that Bold dashed line. This is a Local line of supprt but has strength.
And so, we find outselves in apennant again and that apex is around 22 July.
PA tracts before the apex.
As will be explained in the monthly chart I iwll post later, this all points towards a Calm July, possibly RED month.
PA does however, have the ability and strength to push higher if the Bulls decide to make a move.
The MACD
The Daily MACD is just above Neutral and has enough room to move.
So, if we drop, support is arouns 103K
If we loose that then 100K and then we land on that red 236 Fib circle that will offer a sliding line of support.
But I do not think we will get there just yet
Enjoy
Cryptolevels
Xrp - The expected rally of +50%!Xrp - CRYPTO:XRPUSD - is still clearly bullish:
(click chart above to see the in depth analysis👆🏻)
Ever since Xrp rallied more than +550% in the end of 2024, we have been witnessing a quite expected consolidation. However Xrp still remains rather bullish and can easily retest the previous all time highs again. Maybe, we will even see another parabolic triangle breakout.
Levels to watch: $3.0, $10.0
Keep your long term vision!
Philip (BasicTrading)

Bitcoin Mid Term Game Plan - BTC PLANBitcoin just broke a key resistance level with strength.
I expect a new all-time high soon, likely the summer top.
Summer markets are usually weak for risk assets and strong for gold. Seasonality matters, keep that in mind.
I expect risk markets to sell off until mid-July to early August. I’ll start buying once we break structure again.
The plan:
Wait for BTC to hit $110K
Look for a reversal from that level
Start aggressively shorting alts, beginning with ETH and memecoins
Hold shorts until late July / early August
Close positions and shift back to buying

BTC.D ANALYSIS BTC.D – Daily Chart Analysis 🧠
Bitcoin dominance is forming a rising wedge pattern – a typically bearish structure.
We’re now at the upper resistance; a rejection here could trigger a strong move down, opening the path toward 56–57% levels.
If confirmed, altcoins might get temporary relief.
Watch for a break of the lower trendline for confirmation.
Not financial advice – DYOR

SatochiTrader Expecting a huge BTC CRASH AFTER This..BTC Market Update by SatochiTrader
EVERY CRASH DID START WITH A FALSE INCREASE TREND.
Depending on the market sentiment and price action, BTC is currently showing strength with a positive trend. However, based on deeper data and insights held by myself and a small group of early-cycle followers, this current movement may be a deceptive signal — potentially foreshadowing a major crash.
This is not trading advice. Those who are confident in the long position should continue, and those on the other side should stay prepared as well.
We have previously explained that the current cycle appears to have ended. Since 2013, BTC has consistently respected its macro cycle targets. The end of such a cycle typically leads to significant corrections.
A cycle ending implies not just a retracement, but the potential for a major crash. Hedge funds and real BTC whales understand the underlying indicators and risks at play. Our expectation remains clear: BTC may soon fall below the 100K level, with $85K identified as a critical support and target zone.
Stay sharp. Stay informed. The market may look bullish — until it isn't.
The best way to follow BTC is not the news.. but the cycle overview.
This update is an education update, which means the high expectations of the upcoming correction for BTC.
Compared to last quarter, miners are now less severely underpaid, though profitability remains low

Bitcoin Bounce Alert: Holding the $100K Fortress! 📉 Market Context & Technical Levels
Key support at ~$100K: As the chart shows and multiple analysts confirm, this level continues to act as a strong defence zone. Cointelegraph noted bulls have been “defending the $100K key support level strongly,” triggering bounces during dips
Descending channel overhead: Bitcoin has retraced into a downward channel. A clean breakout above ~107K–109K (past recent peaks) is needed to signal a bullish shift .
Liquidity target at ~106K: Plenty of orders await in that region—flipping it to support may pave the way for another push higher .
📊 Indicators & Momentum
RSI dip near 25 during the latest drop indicates oversold conditions—often a precursor to rebounds
.
Volume surge on rebounds suggests absorbing sell pressure and strong accumulation interest at lower levels.
🚩 Key Price Zones to Watch
Level Significance
$100K Crucial support; losing it risks a slide toward $95K–97K or even $92K
.
$105K–106K Liquidity zone; flipping here as support could confirm upward momentum .
$107K–109K Resistance from channel tops and prior highs; a successful break is key to next leg up .
$112K–$112K+ If breakout occurs, upside targets extend toward prior ATH near $112K and beyond .
🎯 Chart Analysis Summary
Your chart shows three distinct bounces from the $100K–100.7K supply zone (highlighted in blue) and the latest one includes a sharp wick and rebound. This aligns with broader market dynamics emphasizing support at $100K and building liquidity at $106K. The arrow projection signals a probable retest of ~106K, with room to challenge ~107–109K after consolidation.
🧭 Trade Outlook
Bullish scenario: Hold above $100K → reclaim $106K → trendline breakout → potential rally to $112K+.
Bearish risk: Fails support at $100K → breakdown toward $95K–92K region.
📌 Bottom Line
Support $100K is alive and well. Bounces have been crisp and volume-backed.
Next test lies at $105–106K. That’s the battleground—flip it, and we may see bitcoin reclaim recent highs.
Watch the channel overhead (~107K–109K). A breakout could open the door to fresh records.
✅ Conclusion: BTC is defending its psychological base firmly. If this zone holds once more, the path to $106K and beyond is in focus. Breaking above demands conviction, but it’s the pivot to watch.

Ethereum Price Reversal ? $2100 Support & Altcoin Season OutlookAfter an extended period of consolidation, Ethereum (ETH) has finally retested the critical support level of $2,100, which aligns closely with the 0.5 Fibonacci retracement level of the bullish trend that began in April. This confluence of technical factors strengthens the validity of this level as a strong demand zone.
The price action suggests that ETH may be gearing up for a bullish reversal, as it respects both horizontal support and key Fibonacci structure. Historically, the 0.5–0.618 retracement zone acts as a high-probability reversal area in trending markets, particularly when accompanied by volume stabilization and long-tailed candles on the daily chart.
Trade Plan: Spot and Futures Positions
Given the current structure, this presents a favorable opportunity to accumulate ETH on spot for the anticipated altcoin season. In addition, leveraged long positions in futures can be considered with clearly defined risk parameters.
Entry Zone: Around \$2,100
Stop Loss: \$2,000 (below key support)
Target Levels:
Primary Target: $2,500 (previous resistance / psychological level)
Secondary Target: $2,600 (major structure high)
The risk-to-reward ratio remains attractive, particularly if the broader crypto market continues its uptrend and Bitcoin maintains stability.
Market Context
Broader macro sentiment and the dominance cycle suggest capital rotation into altcoins could be near. With Ethereum leading major Layer 1s, a recovery from this level could catalyze a wider altcoin rally**, making this an important zone to watch for both intraday traders and swing investors.
⚠️ Note: Due to ongoing geopolitical tensions between Israel, Iran, and the United States, global financial markets—including crypto—may experience heightened volatility. Traders are advised to manage risk carefully and avoid overleveraging during uncertain macro conditions.

BTCUSDT - major support, Cut n Reverse Area??#BTCUSDT... market just r ached at his one of the most expensive area of the week and month
Keep close 101200
That is our ultimate supporting area.
Note: below 101200 we will cut n reverse on confirmation.
Good luck
Trade wisely

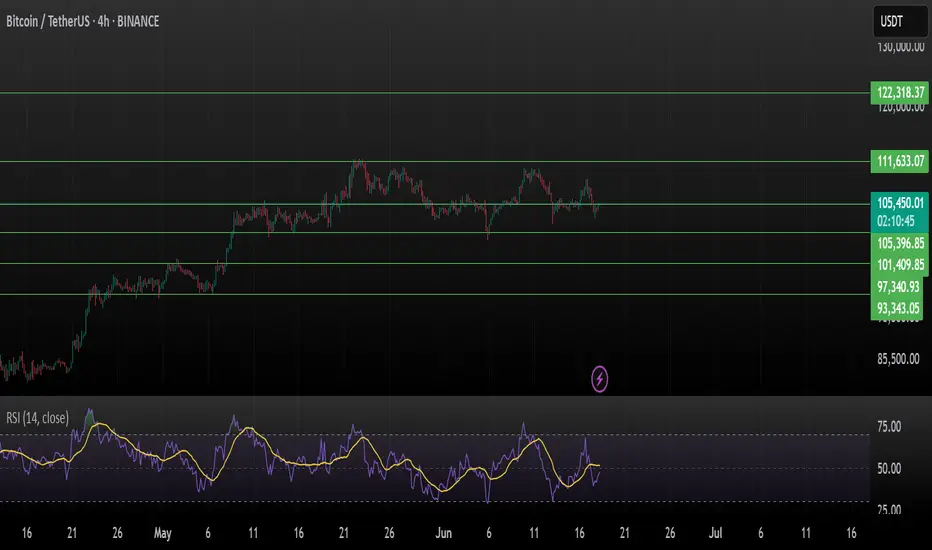
Bitcoin (BTCUSDT) 4H AnalysisBitcoin is currently consolidating around $105,523 after a strong rally and forming a short-term sideways structure. It is still unable to break the immediate resistance of $ 111 K.
Key Technical Observations:
BTC has been ranging between $101,409 and $105,523
RSI at ~51.38 indicates a neutral zone, signaling indecision in momentum
Support holding at $105,396, but price action is flat
Bulls need to reclaim $111,633 to regain momentum
Major Levels to Watch:
Resistance: $111,633 → $122,318
Support: $105,396 → $101,409 → $97,340 → $93,343
A break above $111,633 could trigger bullish continuation, while a fall below $101,409 might open the path to deeper support zones.
Patience is key — wait for breakout confirmation before making moves.
This is not financial advice. Always DYOR and manage risk.
Like, share & comment if you find this analysis helpful!
#Bitcoin #BTC #BTCUSDT
$BTC 4hr - The Calm Before Bitcoin’s Next Move💡 In bull markets, triangles break UP more often than down.
But volume + macro + ETF flows > patterns.
Set alerts, manage risk, stay nimble.
#BTC #CryptoAlpha #RiskManagement
🎯 Key Levels Analysis:
✅ Resistance: 106.3K
→ This level matches the upper bound of the symmetrical triangle and is reinforced by multiple recent rejections. Also aligns with previous highs.
✅ Support: 103.7K
→ Mid-range horizontal support. Price reacted here multiple times. It's also near the triangle base.
✅ Support: 99.6K
→ Clean psychological + technical level. A previous consolidation zone. Would likely trigger a strong reaction.
✅ Last Line of Bull Defense: 95.2K
→ Major horizontal support from the April/May breakout structure. Losing this would likely invalidate the bullish structure.

Bitcoin Bounce & Breakout PlayChart Analysis:
🔹 Support Holding Strong:
BTC is respecting a key support area (~$105,600), which previously acted as resistance (marked by recent ATH).
🔹 EMA 70 (Blue Line):
Price is hovering above the EMA, adding bullish confirmation.
🔹 Bullish Projection Path:
The chart shows a projected bullish move toward the sell zone near $113,200 – $113,300, representing a potential 4.4% gain from the breakout.
🔹 Key Zones:
Support Zone: $105,600
Supply Zone: $100,500
Sell Zone (TP Zone): $113,200+
📌 Outlook:
If BTC breaks and holds above the resistance (~$107,000), a strong upward rally could follow. Entry near support or on breakout, with tight risk management, offers a favorable risk/reward.
✅ Entry Options:
Breakout Entry:
Trigger: Break and close above $107,200
Confirmation: Retest and hold above the breakout zone
Entry: $107,300 – $107,500
Support Bounce Entry:
Trigger: Pullback to support zone (~$105,600) with bullish reversal candle
Entry: $105,600 – $105,800
🎯 Target Zones (TP):
TP1: $110,400 (minor resistance)
TP2: $113,200 – $113,300 (major sell zone)
TP3 (aggressive): $114,000+
🔻 Stop Loss (SL):
For breakout entry: SL below $106,200
For bounce entry: SL below $105,200 or $104,800 (structure break)
📈 Risk–Reward Ratio:
Approx. 1:2.5 to 1:3+ depending on entry and target
🧠 Trade Management:
Move SL to breakeven after hitting TP1
Partial profit booking at TP1
Trail remaining with manual or dynamic SL (e.g., below EMA or recent low)
⚠️ Risk Notes:
Avoid chasing price without breakout confirmation
Watch for fakeouts and heavy selling near TP zones
Adjust position size based on your risk tolerance

BTC/USDT Bullish Reversal Zone AnalysisSupport Zone:
The horizontal purple box (~104,000 USDT area) has acted as a strong support/resistance flip zone multiple times.
Falling Wedge Breakout:
The price action broke out of a falling wedge pattern earlier, confirming bullish momentum.
Flag Formation (Current):
A smaller bullish flag/pennant appears to be forming, and a breakout above could trigger a strong upward move.
Projected Move:
The black arrow indicates a potential bounce from this support zone, with the price targeting the 111,000–112,000 USDT zone (highlighted in the top purple box).
Volume Spike:
Notable volume spike near the bottom supports the idea of accumulation and possible reversal.
📈 Conclusion:
If the support zone holds and price breaks above the minor flag, a bullish continuation is likely toward the 111,000–112,000 resistance area. Traders should watch for confirmation of a breakout and volume increase for validation.

XRP/USDT Reversal Play: Bounce from Strong Demand Zone🔍 Chart Analysis:
🟫 Strong Supply Zone: The price has bounced perfectly off a strong demand zone (labeled "strong supply zone" in the chart, but likely intended to be demand), showing buyer interest near the $2.05–$2.12 range.
📉 Recent Downtrend: XRP recently experienced a sharp decline, but the price has now touched this critical zone, suggesting a potential bullish reversal.
🔁 Potential U-Shaped Recovery: A rounded reversal pattern is indicated with the red curve, aiming for a U-shaped recovery targeting higher resistance levels.
📊 EMA 70 (2.2932): Current price is trading below the EMA, which acts as a short-term resistance. A break above it would be bullish confirmation.
📌 1st Resistance: Around $2.2932, which aligns with the EMA. This is the first challenge for bulls.
📌 2nd Resistance: Near $2.40–$2.47, a critical barrier before long-term targets.
🎯 Long-Term Target: Set near $2.63, the peak from the previous rally, aligning with major resistance.
🕯 Volume: Decent volume spike at the bounce, confirming interest from buyers.
🧠 Trade Setup: Reversal from Strong Demand Zone
📍 Entry Zone:
🔹 Enter between $2.12 – $2.15 (ideal after confirming a bounce or bullish candle above the zone)
🛡️ Stop-Loss (SL):
🔻 Place below the demand zone — $2.05
(Protects from deeper downside if support breaks)
🎯 Take Profit (TP) Targets:
TP1 – $2.29 (🟦 1st Resistance / EMA 70)
🔸 Partial profit booking here; break-even SL for the rest
TP2 – $2.40 (🟦 2nd Resistance)
🔸 Major resistance zone; expect a reaction
TP3 – $2.63 (🔴 Long-term Target / Previous High)
🔸 Full target for position holders
📊 Risk/Reward Ratio:
Approximately 1:2.5 to 1:3.5, depending on entry
🔔 Extra Notes:
📈 Watch for bullish engulfing or hammer candle confirmation before entering.
🔄 If price fails to reclaim EMA 70, re-evaluate trade.
🧠 Manage position size properly — avoid over-leverage.
🔮 Summary:
XRP is attempting a bullish reversal from a key demand zone with potential to target $2.47 and even $2.63 long term, provided it clears resistance at $2.29 and $2.40. The setup favors swing traders and position holders looking for a recovery play.
💡 Strategy Tagline:
"Buy the bounce, trail the breakout, ride the reversal!" 🚀📈💹
support my idea and comment down your thoughts thanks .

Ethereum (ETH/USDT) Breakout Watch ! Hello traders here is KingPro's analysis on Ethereum
📈ETH is at the critical resistance level strong closing above it could tiger a bullish move.
Current Price: $2,628
EMA 70 Support: Price is holding above the 70-period EMA ($2,577), showing bullish structure.
Support Zone: The area around $2,320–$2,400 is acting as a strong historical support, confirmed multiple times.
Supply Zone: Consolidation occurred near $2,570–$2,620, but price has broken above it — indicating accumulation.
Critical Resistance Area: Around $2,780–$2,800. This is a key level — a breakout above could lead to strong bullish continuation.
Next Target: $2,782.93 – price may retest this resistance as indicated by the projection arrow.
📊 Trade Idea:
If ETH sustains above $2,620 and breaks the short-term channel resistance, a move toward $2,782+ is likely.
🔒 Risk: A breakdown below the EMA or the supply zone (~$2,570) could invalidate the setup.

$ETH - Top DownBYBIT:ETHUSDT.P Top Down (10/06/25)
V-Levels Bias
Weekly = Bullish
Daily - Bullish
10-Hour = Bullish
1-Hour = Bullish
V-Levels Momentum
Weekly = Bearish FA
Daily = Neutral
10-Hour = Neutral
1-Hour = IB Range (Neutral)
DeCode Market Breakdown
Macro Context
Weekly Chart
Strong bullish MS, printing clean HHs and HLs.
Price has rejected from the same V-Level multiple times.
Rejections are paired with high relative volume and aggressive selling footprints → indicates strong passive interest above.
This area is not ideal for aggressive long entries.
Daily Chart
Still in bullish structure, holding above key POCs and range lows.
The Failed Auction at IB lows has added fuel for upside momentum.
However, we’re trading right into a potential liquidity pocket just below resistance.
Context calls for a wait-and-see approach: either clear breakout or rejection confirmation.
Intraday Picture (10H & 1H)
10H Chart
Still within an Inside Bar (IB) range.
FA at range lows suggests momentum continues upward — but we are at the top of the range.
Key risk: trap above range highs → ideal area for shorts if we get absorption and selling imbalance.
1H Chart
Market is rotating inside the current IB range.
No breakout confirmed yet.
Best short setup: Rejection from IB Highs + Absorption on CVD / Footprint charts.
Breakdown scenario: Short on range low breakdown with volume confirmation.
Longs: Only valid if HTFs confirm breakout → then look for bullish retest or mid-retest entries.
⸻
Summary & Trade Plan
Big Picture: Still bullish, but this isn’t the area to long blindly.
Short Setup 1: Rejection from IB Highs with clear absorption + imbalance.
Short Setup 2: Breakdown below IB Range Lows with volume follow-through.
Long Setup: Wait for HTF confirmation of breakout. If confirmed → retest of prior resistance as support.
Final Notes
This is where traders get chopped. HTF resistance meets LTF momentum.
Let price prove itself. Let volume confirm the move.
No breakout = no long. No trap = no short.

DUSK - LONG SET-UP 2x Target.BINANCE:DUSKUSDT
𝐃𝐔𝐒𝐊/𝐔𝐒𝐃𝐓
Dusk is breaking out of a long-term downtrend on the weekly chart. A potential move of +103.77% is projected, signaling a bullish reversal if the breakout holds

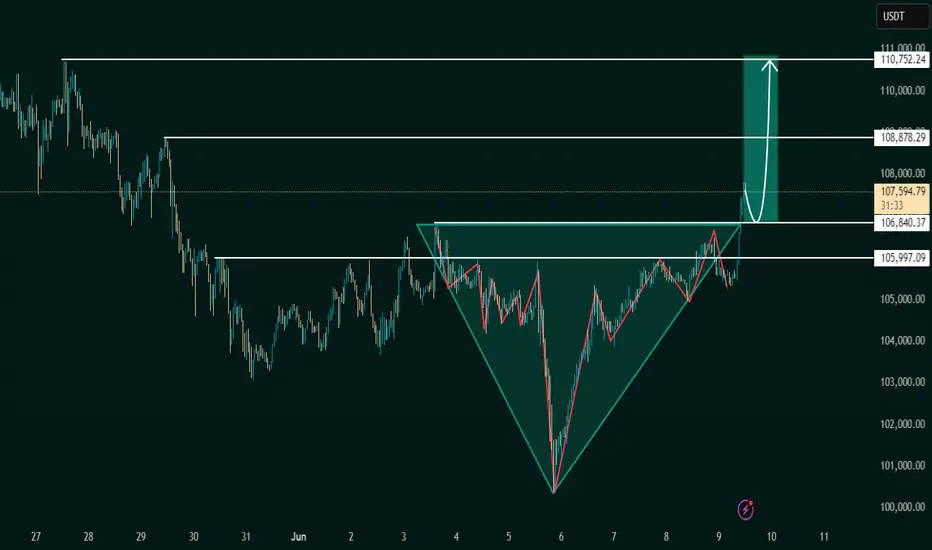
Inverse Head and Shoulders Breakout Signals BullishThe chart under review presents a classic Inverse Head and Shoulders pattern, a reliable and widely recognized bullish reversal formation in technical analysis. This structure typically forms after a downtrend, indicating a potential shift in market sentiment from bearish to bullish.
The pattern is composed of:
Left Shoulder: A modest price decline followed by a temporary upward correction.
Head: A deeper price decline forming the lowest point in the pattern.
Right Shoulder: A higher low that mirrors the left shoulder, followed by another upward movement.
The neckline, which acts as a critical resistance level, is clearly illustrated at approximately 106,840.37 USDT. A confirmed breakout above this neckline suggests the completion of the reversal pattern and validates the potential for a sustained bullish movement.
2. Breakout Confirmation
The current price action confirms a successful breakout above the neckline, with the market currently trading around 107,586.58 USDT. This breakout is a key signal for bullish continuation, provided it is supported by increased volume and follow-through price action.
From a technical standpoint, the breakout is reinforced by:
A clean violation of neckline resistance
Price consolidation near breakout zone before a strong upward thrust
Higher lows preceding the breakout, indicative of growing buying pressure
This confluence of technical signals strengthens the case for an upward price trajectory in the near term.
3. Projected Price Targets
Upon confirmation of the Inverse Head and Shoulders breakout, target levels can be derived using the measured move technique. This involves projecting the vertical distance from the head to the neckline upward from the breakout point.
Target 1 (Initial Resistance):
108,878.29 USDT – This level represents a potential short-term resistance where price may consolidate or retrace slightly before continuing.
Target 2 (Measured Move Completion):
110,752.24 USDT – This is the ultimate price target derived from the height of the head-to-neckline structure. Reaching this level would represent the full realization of the reversal pattern.
4. Key Support and Risk Levels
Risk management is a critical component of any trading strategy. The following support levels should be closely monitored:
106,840.37 USDT (Neckline Support):
Former resistance turned support. Holding above this level post-breakout is essential for sustaining bullish momentum.
105,997.09 USDT:
Acts as a secondary support level and potential stop-loss region for conservative traders.
If price fails to hold above the neckline and falls back below these levels, the breakout could be classified as a false breakout, warranting caution.
5. Strategic Implications for Traders
This setup provides a favorable risk-to-reward ratio for long entries, particularly for traders seeking to capitalize on momentum-based patterns. An optimal trading approach could involve:
Entry: Near the neckline breakout or on a minor retest of 106,840.37 USDT
Stop-Loss: Below 105,997.09 USDT or under the right shoulder to account for volatility
Take-Profit Zones: Partial profits near 108,878.29 USDT, with final target at 110,752.24 USDT
6. Final Remarks
This chart illustrates a textbook example of a bullish reversal pattern in play. While the technical outlook is favorable, traders should remain cautious of potential invalidation scenarios, especially in highly volatile or news-driven markets. Confirmation through volume analysis and supportive macro/fundamental conditions can further enhance confidence in the bullish thesis.
Overall, the current setup indicates a well-structured opportunity for upward price movement, with a clearly defined entry, risk, and reward framework.
Let me know if you'd like this tailored for a trading journal, client report, or automated strategy setup
Doge Meme Coin daily demand level is playing out wellThe strong daily demand imbalance mentioned in a previous update is still in control and trying to play out as expected. Any long positions on this meme coin should be managed.

TRBUSDT - Bottom out here? What's next??#TRBUSDT ... market just near to his bottom and looking bottom out here
Keep close and if market holds his current mentioned area than we can expect a bounce from here.
Good luck
Trade wisely

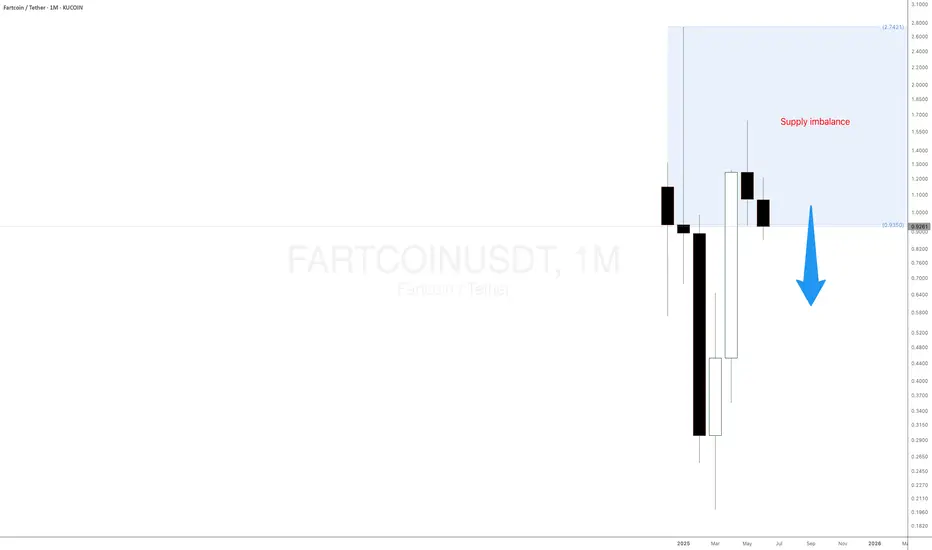
Is Fartcoin Meme Coin About to Crash Hard?In the ever-evolving world of crypto investment, memecoins continue to attract waves of speculative interest, even as their real-world use remains effectively nonexistent. One such meme coin token that’s recently caught the attention of traders and meme enthusiasts alike is Fartcoin—a cryptocurrency as ridiculous as its name implies. While Fartcoin may not be suitable for serious applications, it presents a fascinating case study in how to trade memecoins based purely on supply and demand imbalances.
The Origins of Fartcoin
Fartcoin emerged, predictably, as a joke. Like most memecoins, it was born not out of innovation but out of internet culture. Designed with no technical edge, no roadmap, and no ecosystem, its primary function is virality—riding the waves of social media hype and influencer shills. Fartcoin’s creators never intended it to disrupt finance or decentralize the web; they just wanted to make people laugh (and perhaps get rich in the process).
Yet, despite the lack of fundamentals, Fartcoin gained traction, thanks to Twitter and X memes, Reddit threads, and YouTube influencers who thrive on ironic tokens with humorous names. This is the bizarre paradox of memecoins and crypto investment: irrational exuberance often beats utility.
Why Fartcoin (Like All Memecoins) Can’t Be Used in Real Life
Let’s be clear—memecoins like Fartcoin offer no practical use. Unlike Bitcoin (store of value) or Ethereum (smart contract infrastructure), Fartcoin can’t pay for goods or services, nor does it solve any technological or economic problem. It exists solely for speculation.
Most real-world businesses won’t touch it. It lacks a stable price mechanism, a credible development team, and a long-term value proposition. In other words, Fartcoin is entirely unfit for real-life utility, making it a textbook example of a speculative asset detached from fundamentals.
Technical Analysis: Supply Level Suggests a Dump Is Imminent
While Fartcoin may lack intrinsic value, it offers opportunities for active traders who understand market psychology and how to trade cryptos. Currently, the price action reveals a notable supply imbalance around the $0.8982 level—a monthly supply zone that has acted as a key area of institutional selling pressure.
This level is currently “in control,” meaning buyers have consistently failed to push through this resistance. Price is now hovering close to this supply level, suggesting a high probability of rejection. For traders familiar with trading memecoins, this presents a prime opportunity to take short positions using futures contracts available on select cryptocurrency exchanges, such as Kucoin, Binance, and ByBit.
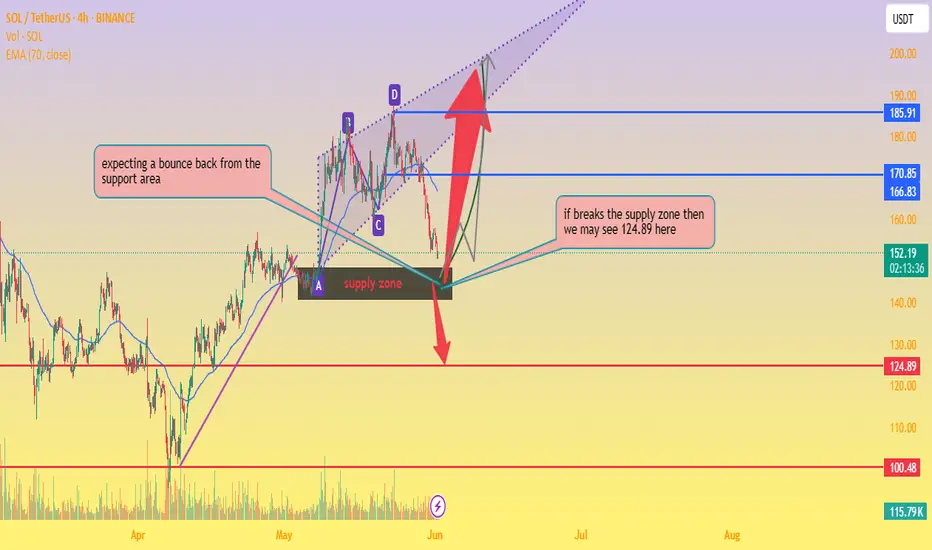
SOL/USDT Key Reversal Zone – Bounce or Breakdown?📊 Chart Analysis:
Current Price: $151.91
EMA 70 (Dynamic Resistance): $166.82
Support Area: Around $150, overlapping with a key supply zone.
Chart Pattern: Harmonic/ABCD structure completing near support.
🧠 Observations:
Price is testing a strong support/supply zone.
📦 If bounce occurs, potential targets:
🎯 First Target: $170.85
🎯 Second Target: $185.91
📉 If support breaks, then:
⚠️ Target: $124.89
📉 Next Major Support: $100.48
🧭 Trade Plan:
🔹 Long Entry (on bullish confirmation):
Entry: $152–$155
SL: Below $149
TP1: $170.85 🎯
TP2: $200 🚀
🔹 Short Entry (on breakdown confirmation):
Entry: Below $148
SL: Above $153
TP: $124.89 🧨
support and drop down your thoughts about it thanks
BTCUSD Wave Count: Bitcoin Unfolding Wave ((5)) ?Hello Friends,
Welcome to RK_Chaarts,
Let's analyze the Bitcoin chart today using Elliott Wave theory. As we can see, Bitcoin recently made a high around $112,000 on 23rd May 2025. We've marked this as the completion of Primary Degree Black Wave ((3)). After that, it dropped to complete Wave ((4)) on 31st May 2025. Now, it's moving up, possibly unfolding Wave ((5)). According to Elliott Wave principles, Wave 2 cannot retrace more than 100% of Wave 1. So, our nearest invalidation level is the 31st May's low at $103000. If the price sustains above this level, we can expect it to move towards $115,000 as a Projected Target of wave ((5)). However, if it breaks below the invalidation level, we'll need to re-analyze the wave counts. We've also drawn some trend lines, marked in black dotted lines, which act as support and resistance. This is a 1-hour time frame chart. The red line marking the nearest invalidation level is crucial. If it breaks, we'll need to adjust our wave counts. If it holds, we can expect the price to move up towards $115,000. Let's see how the market unfolds. Please note that this is an educational analysis and not a trading tip or advice.
Analysis Summary
- Analyzing Bitcoin chart using Elliott Wave theory to understand market trends and potential price movements.
- Recent high around $112,000 on 23rd May 2025, & Recent Low around $103,000 on 31st May 2025 indicates a significant turning point in the market.
Wave Count
- Completed Primary Degree Black Wave ((3)) suggests a major uptrend has concluded.
- Completed Wave ((4)) on 31st May 2025 indicates a correction phase has ended.
- Possibly unfolding Wave ((5)) implies a new uptrend may be emerging.
Key Levels
- Nearest invalidation level: 31st May's low at $103,000 serves as a crucial support level.
- Projected Target: $115,000 represents a potential upside target based on Elliott Wave principles.
Elliott Wave Principles
- Wave 2 cannot retrace more than 100% of Wave 1: a key rule governing wave relationships.
- Wave ((5)) projection based on Fibonacci ratios and wave extensions.
Chart Details
- 1-hour time frame chart provides a detailed view of recent price action.
- Trend lines marked in black dotted lines highlight key support and resistance levels.
- Red line marking nearest invalidation level is crucial for validating the wave count.
Important Notes
- Breaking below the invalidation level would require re-evaluation of the wave count.
- Sustaining above the invalidation level increases confidence in the projected target.
I am not Sebi registered analyst.
My studies are for educational purpose only.
Please Consult your financial advisor before trading or investing.
I am not responsible for any kinds of your profits and your losses.
Most investors treat trading as a hobby because they have a full-time job doing something else.
However, If you treat trading like a business, it will pay you like a business.
If you treat like a hobby, hobbies don't pay, they cost you...!
Hope this post is helpful to community
Thanks
RK💕
Disclaimer and Risk Warning.
The analysis and discussion provided on in.tradingview.com is intended for educational purposes only and should not be relied upon for trading decisions. RK_Chaarts is not an investment adviser and the information provided here should not be taken as professional investment advice. Before buying or selling any investments, securities, or precious metals, it is recommended that you conduct your own due diligence. RK_Chaarts does not share in your profits and will not take responsibility for any losses you may incur. So Please Consult your financial advisor before trading or investing.

