DOGE Looks ☀️; Upside Potential in the Next 24 Hours? Mixed trading conditions hover over the global crypto market 🌐 in the next 24 hours, with a bullish sun ☀️ shining over Bitcoin and Dogecoin. However, bearish clouds ☁️ will exert pressure on the rest, including Ether, Ripple’s XRP, and Binance Coin.
Over a one-week horizon, the sun is forecasted to break through 🌥️, casting rays of positivity on Ether, Litecoin, and Binance Coin. Bitcoins are expected to bask in this upside trend ☀️, according to ATTMO. Nevertheless, bearish clouds are predicted to persist over XRP, Avalanche, and Polkadot. ☁️
Follow us for more crypto weather reports!
Cryptolevels

BTC Sees Sun in the Next 24 Hours ☀️; Rebound Ahead! Mixed trading conditions hover over the global crypto market 🌐 in the next 24 hours, with a bullish sun ☀️ shining over Bitcoin and Dogecoin. However, bearish clouds ☁️ will exert pressure on the rest, including Ether, Ripple’s XRP, and Binance Coin.
Over a one-week horizon, the sun is forecasted to break through 🌥️, casting rays of positivity on Ether, Litecoin, and Binance Coin. Bitcoins are expected to bask in this upside trend ☀️, according to ATTMO. Nevertheless, bearish clouds are predicted to persist over XRP, Avalanche, and Polkadot. ☁️
Follow us for more crypto weather reports!

BITCOIN WEEKLY UPATE AND POSITIONAL SIGNAL ON HARMONY ONECheckout the latest Bitcoin Weekly Update. We hope you will like our update and you will follow us for future updates also

ETH/ USD a small down trend to a key level.At the psychological level of 2100, price does not show signs of breaking it and trending upwards. We notice this and can confirm it on the daily as clear as day. on the 4H we can see clear rejection towards the downside. At the same time we can see a trendline forming.I can see it clear as day that price will go down to 2000 easily before bouncing off the trendline.we also notice a bearish divergence already formed on the daily TF. We can see itclear as day. we need to focus on what's there and what the marketis saying to us. cool.Thanks.

TRBUSDT short-term ideaThis is a short-term view of the TRB coin that I realize .
The picture illustrates some important zones, and you can set an alarm or order.

TRUU READY FOR THE HISTORY WHALE INCREASE TRUU seems on a very interesting level for the next high break.
Showing high incoming volume.
Soon more.
For the day trading manage always risk.
Trading with not SL means not trading.

$AVAX Update - Strong Support Zone - Potential for breakdownA few updated price levels on AVAX, Incredible asset but has the potential for a breakdown below current levels, if it maintains (Which I think it will), we should see a rise to the outlined $28 region.
Refer to my previous CRYPTOCAP:AVAX post for more information.

Next Halving timingSo,
- Next Halving ~ May '24
- Next Bear ~ Mar '26
- Next Capitulation May '27
Why not? Let's go!

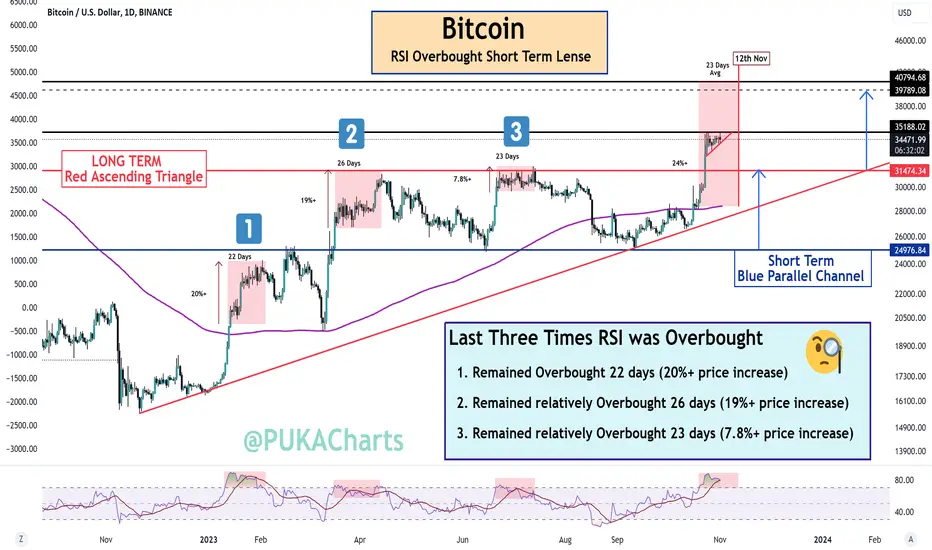
Is Bitcoin Overbought on the RSI a sell signal? Bitcoin - CRYPTOCAP:BTC
Short term BTC Chart that's not really my style but I thought it was interesting.
We are on day 13 of being overbought on the RSI. In the 3 examples below, recent history suggests we can remain overbought in the RSI for 23-26 days on average (12th - 14th Nov)
Please recognize that in past bull markets the RSI remained oversold for much MUCH longer and I am long term very bullish with a long term spot position.
This is just something I observed. We are against stiff resistance here at $35.2k and we have more at $39-40k. Now we are aware that we can have another 10 more days of potential price upside regardless of RSI being oversold, however trades on shorter timeframes might look at the latter end of the 10 days window as a taking profit /de-risking opportunity.
Just something i noticed and thought i would share because an oversold RSI would put anyone off, but with BTC it can stay there a lot longer than you might think.
PUKA
$ALGB token primed for a once in a century pumpWriting this from my phone, will update the chart in the morning and give a more through analysis.
I recommend having at least a small bit in your portfolio, it is a relatively high risk asset so don’t bet the hoist but I do believe we will see a ridiculous increase in price over the next month. I’ve been holding for a few months without seeing any positive movement, nice to see it finally getting some gains

AVAX GROWTH - CHART - Supports and ResistancesThis is just a supporting chart for the Video I put out Earlier.
Currently touching the bottom of the channel I mentioned.
With the recent announcement by JP Morgan's ONYX regarding their stake in AVAX I thought this would be the perfect time to cover this Incredible asset.
In short ONYX is predicting that subnets ( individual blockchains that have been specifically designed to suit the needs of institutions. That means extra consideration has been given to network privacy, gas, ETC) will be extremely valuable to institutions in the near future and are betting big, since this announcement we have already seen over a 20% increase in price, but how much more can we actually run?
From a Technical side, we are at a huge inflection point, In the past when we have crossed the $18 region we have seen explosive growth, anywhere from 200% - 700%. Although it is highly dependent on bitcoin / ETF approval/ overall market, If we can maintain above this zone its only a matter of time before we fly to our first targets / Resistance points
Outlined here are a few important zones to watch
Resistance Point 1 .382 level: $24.00 ( Just rejected off this 12 hours ago)
Target 1 : - $ 26.60
Target 2 (Midterm Major Resistance/Support Zone): $61.86
Strong Resistance Zone : $93.50
Target 3/ Breakout Resistance Zone: $112.75

RLC NEW VOLUME INCREASEThank you for reading this update.
Depending on our study we see that RLC has a good chance of volume increase.
This updates depending on day trade, And the market should confirm with time the right market way.
#Nottradingadvice

ZRX Breakout the descending broadeningDescending Broadening Wedge Pattern Explained
A descending broadening wedge chart pattern is a bullish reversal pattern. This pattern is created by two declining and diverging trend lines .
A descending broadening wedge forms as price moves between the upper resistance and lower support trend lines multiple times as the trading range expands during the downtrend in price. Price should touch each line 2 or 3 times to be considered a valid pattern. This pattern looks like a megaphone pointing down and to the right.
A descending broadening wedge is looked at as a bullish pattern as it forms but it is not validated as a buy signal until the pattern starts to make short term higher lows and higher highs and the upper resistance trend line is broken and price begins to move to the upside and above the upper trend line. As the descending broadening wedge pattern is forming trading volumes become most meaningful as the pattern breaks out above the upper trend line, this should happen on increasing volume showing that the chart is starting to go into an accumulation cycle.

Crypto Forecast: ADA ☀️ 24 Hours; Correction in 1 WeekClouds lie ahead for the global crypto market, including Bitcoin and Ether in the next 24 hours, translating to a slightly bearish trend. ☁️ Altcoins Cardano, Dogecoin, Polygon, and Chainlink, however, enjoy bullish sunshine.
Over a one-week horizon, the ☀️ bullish sun will return for both Bitcoin and Ether. Yet, cloudier bearish trading conditions will prevail over Ripple’s XRP, Cardano, Binance Coin, and Polkadot. ☁️
Follow us for more crypto weather reports!

WILL BTC BE ABLE TO CONTINUE THIS BULLISH RALLY?
In the higher timeframe, Bitcoin (BTC) is currently encountering two significant resistance levels that it must surpass for a more bullish movement to materialize.
Why is it so strong? it's a 446-day resistance
In the daily time frame
"After each significant or sudden movement, Bitcoin has exhibited a tendency to consolidate sideways."
here we can see a bearish divergence in RSI also
So what do you expect?
LET'S HAVE A LOOK AT THE SHORTER TIME FRAME
In the shorter time frame, Bitcoin (BTC) has broken out of this bullish pennant pattern and is currently in the process of retesting it. According to the technical pattern analysis, we can anticipate a potential bounce of approximately 15% to 17% from the current level.
LET'S HOPE THIS IS NOT BEAR TRAP
This chart is likely to help you make better trade decisions if it does consider upvoting it.
I would also love to know your charts and views in the comment section.
Thank you

ETH trade setup for 15th Nov 2023My setup yesterday was bullish, I only caught a 1:2rr. I didn't see other factors telling me to go bearish.
I was bent on being bullish, so I know and believe, setups can change. So learning to be dynamic is key and not holding to one belief of how the trade should pane out. However, it was a good day.
Today being, 15th Nov 2023, I'll be expecting a bearish scenario as outline on the chart. So I'll be expecting price to enter into the areas highlighted above and also the rectangle above for a reason to go short at specific time.
This is not a trade advice, please dyor

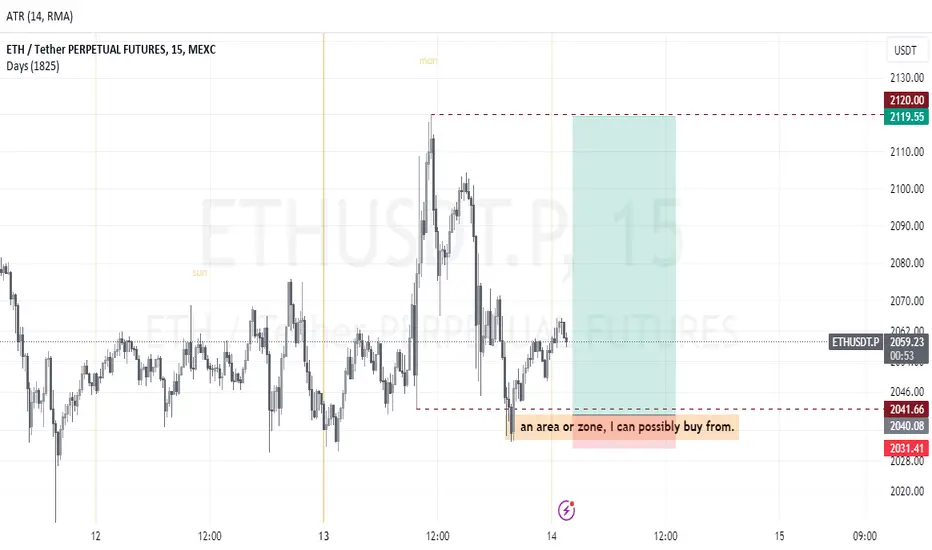
ETH Trade setup for 14th Nov 2023Eth has been bullish compared to BTC, so for me to trade this pair because it refused to make lower low but it also still took out some lows as an inducement to go short however, that's not the actually direction. It's direction is bullish to offset short traders. My possible scenario is for the market to trade into my zone at about 9:30am NY time today, then I can see what price is doing. If there be reasons to go long or short.
XRP Under the Weather: ☁️ Looming for the Next 24 Hrs, 🐻 TrendMixed trading conditions ahead on the global crypto market, with bullish sun shining on Bitcoin, Cardano, Avalanche, and Polkadot in the next 24 hours. 🌤️ Cloudier bearish trading conditions will prevail over Ether, Ripple’s XRP, Binance Coin, and Dogecoin, according to ATTMO. ☁️
Over a one-week horizon, the ☀️ sun will shine over cryptocurrencies such as Bitcoin, Ether, and Binance Coin. However, bearish clouds will linger over Litecoin, XRP, and Cardano.
Follow us for more crypto weather reports!

DAY TRADE 022BYBIT:10000STARLUSDT.P
Today we have 10000STARLUSDT! we hit the floor on this one and im trying to catch an order before this goes off if we need to come down lower on the price we will go again!
5:1
Thanks guys.

SOLUSDT NEW TIMES COMING? Thank you for reading this update.
Solona looks to have a new incoming volume
Will this bring this volume Solana to $100 with time?
This volume depends on day trade and has no guarantees for the long term.


FILE FAKEBREAKOUT PATTERNThe current area support is very suitable for continuation of the upward trend

