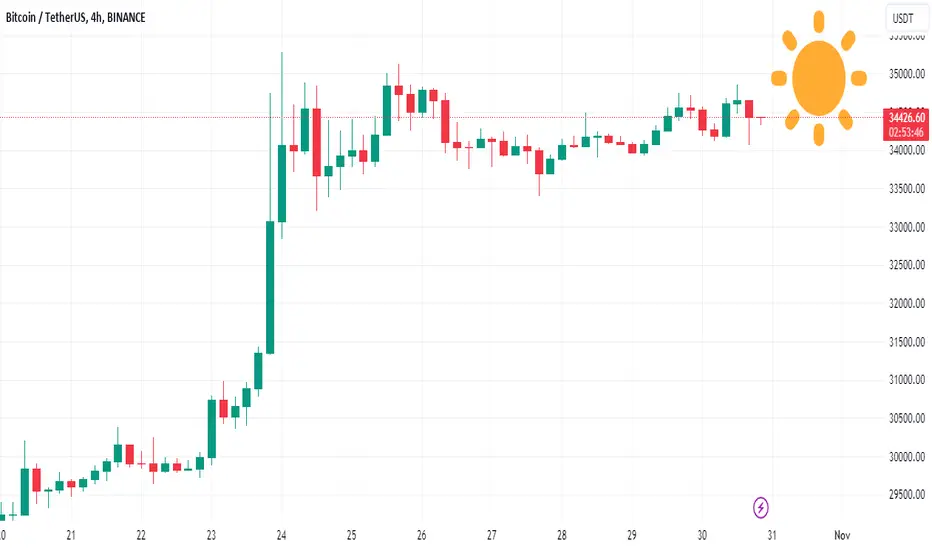
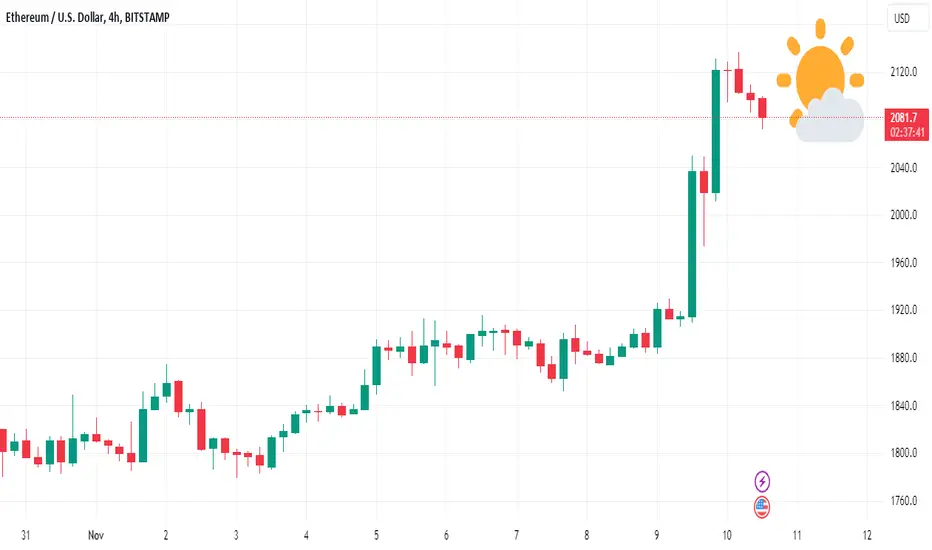
ETH : 🌞 Skies & Upside Potential in 24H, Correction in 1 Week? Mixed trading conditions ahead for the global crypto market in the next 24 hours. Bitcoin and Polygon face cloudy skies ☁️, translating into a slightly bearish market with downside risk. The sun 🌞, however, shines over the rest of the cryptosphere like Ether, Avalanche, and Ripple, hinting at upside potential, according to ATTMO.
Over a one-week horizon, Bitcoin and Avalanche are likely to also benefit from a bullish sunny sky. Ether will see tropical trading conditions with rain indicating that an imminent market correction is likely. ☔
Follow us for more crypto weather reports!
Cryptolevels
Solana’s target defined. Idea combines Dow, Wyckoff and Fibonacci
Market maker just drew Solanas range with a surgical rebound at the 0.382 level. Could go as low as 0.5 without being weird (45.13)
Expect some type of consolidation and will be looking like the top is in.
Will do its thing and then go to the target zone.
Wouldn’t expect to run this level, it then again anything could happen.
Just an idea, trying to figure out the market’s maker view.
Exiting price action!

How to buy a bull runCombining Dow, Wyckoff, Fibonacci.
This is a 18 min chart
From wick low to wick high.
Notice how the buying was done at the 0.236 level acknowledging it had already been bought at the 0.382
Price then stalls at the -0.382 (mirror image)

RAY INCREASE VOLUMEThank you for reading our update. Please remember that this is not advice for trading.
RAY Looks to have a new uptrend volume and can meet new volume in the coming hours.
This is day trade based.

Trying to jump into NEOIdeas combine Dow theory, Wyckoff and Fibonacci. No other indicator used.
Neo is currently moving down after a huge selloff.
After careful examination and looking for the equilibrium zone, it is found that highest probability zone for optimal buying sits between 11.87 - 11.58 area (between the 0.382 - 0.05 levels)
A candle-close below 11.58 will invalidate the idea.
Looking at a 36 min chart here.

CRONOS - KEYLEVELS - DailyThese are my keylevels for CRO.
Now its testing the resistance line after the breakout of the descendent trend.

☁️ ADA 24-Hr Outlook: Bearish Trend Ahead, Downside Risk? Mixed trading conditions on the global crypto market in the next 24 hours. 🌦️ Cloudy bearish trading conditions ☁️ lie ahead for Bitcoin, Ripple’s XRP, Cardano, and Binance Coin, while ☀️ sunny bullish conditions lie ahead for Ether, Litecoin, and Dogecoin.
Over a one-week horizon, the ☀️ sun will shine over the entire crypto sphere, indicating strong upside potential. Only Polkadot is set to face a ☁️ cloudy bearish trend, as ATTMO shows.
Follow us for more crypto weather reports!

XRP ☀️ 24-Hour & 1-Week Horizon; Bullish Trend Is On! Mixed trading conditions on the global crypto market in the next 24 hours, with Bitcoin, Avalanche, and Polkadot facing a ☁️ cloudy bearish trend while Ether, Litecoin, Ripple’s XRP, and Cardano bask in the ☀️ bullish sun with upside potential.
Over a one-week horizon, the ☀️ sun is forecasted to shine over most of the crypto universe, XRP included, indicating that a bullish trend is likely, according to ATTMO. However, Polkadot bucks this positive trend with a ☁️ cloudy forecast.
Follow us for more crypto weather insights!

Bitcoin - Major Resistance Zones to trade - CryptocurrencyMajor Levels To Watch
Support Zone : $31,500-$32,00
Major Resistance to break: $35,300
Resistance 2: $39,987
Target 1: $44,000
Resistance 3: $53,880
Currently trading at a large margin above the Ichimoku Cloud.
ETF news could Easily Drive this into the first resistance zone.
Right now we are seeing lower-than-expected volume for this range as many traders are still sidelined waiting for the official ETF launch.
Remember most of the crypto market is correlated to bitcoin in some manner. Pay attention to these levels if you are trading alt coins.

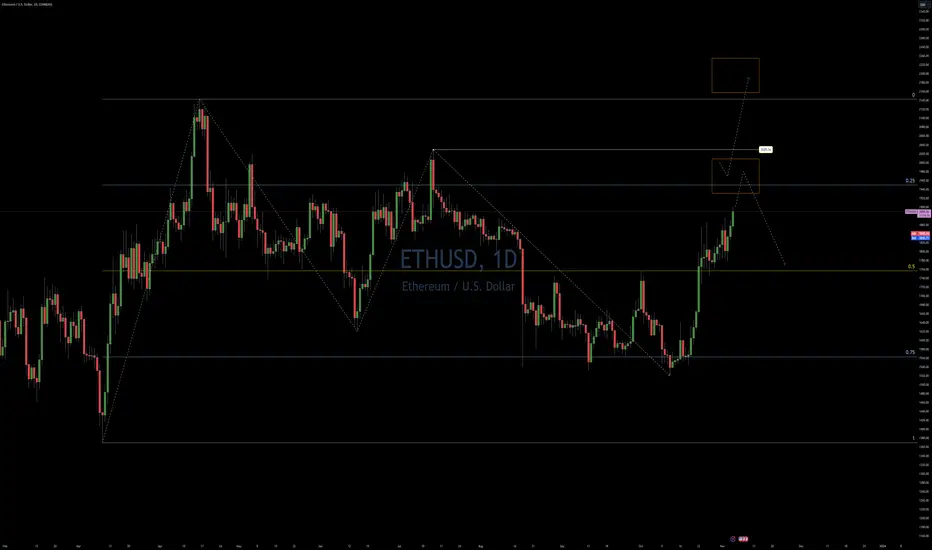
ETH USD IdeaHello, Crypto Warriors! Let's dive into the current Ethereum (ETH) chart. On the weekly chart, we're seeing a bullish range, but on the daily timeframe, there has been a bearish retracement. Given this context, the logical approach has been to consider going long at a 25% discount within the range area, with a stop positioned beneath the zero line.
It's important to acknowledge that the odds are somewhat stacked against you as a trader in these conditions, primarily due to the passage of time and the percentage of the range that has already been traversed. That being said, it doesn't mean we can't envision higher price levels.
What this chart represents is a case study centered around the strong resistance level at 2209. If this level is breached, we could be looking at two potential scenarios: either a liquidation run followed by a reversal or a continuation of the bullish trend.
While we maintain a bullish outlook on cryptocurrencies, it's essential to recognize that there are multiple support levels below, and market makers may not be inclined to leave them untested.
At the moment, our approach is to trade level to level, strategically assessing the market in this environment. If you find value in the levels we've mentioned, or if you'd like more detailed information, please don't hesitate to let us know.
As you embark on your trading journey, we wish you a fantastic weekend and encourage you to find balance between your screen time and the world beyond. Remember, trading is a marathon, not a sprint. Enjoy the weekend and take a breather now and then!
BAKE SHOWS FALL TRENDThanks for reading this update.
Bake shows on the TA side a fall trend, what does this mean exactly the next time frames should confirm it.

QTUM BACK TO OLD LEVELSThanks for reading the update.
Qtum has the possibility to return to old levels since the Asia hype increase volume.

ETHUSD SELL | Day Trading Analysis Hello Traders, here is the full analysis.
Watch strong action at the current levels for SELL . GOOD LUCK! Great SELL opportunity ETHUSD
I still did my best and this is the most likely count for me at the moment.
Support the idea with like and follow my profile TO SEE MORE.
Traders, if you liked this idea or if you have your own opinion about it, write in the comments. I will be glad 🤝
Patience is the If You Have Any Question, Feel Free To Ask 🤗
Just follow chart with idea and analysis and when you are ready come in THE GROVE | VIP GROUP, earn more and safe, wait for the signal at the right moment and make money with us💰

DODO VOLUME INCREASEThank you for reading our update. Please remember that this is not advice for trading.
DODO Looks to have a new uptrend volume
The volume increase can be also short-term.

BTCUSD Possible further upside!The electronics market is persistently declining, currently at approximately $34,400. Based on the 3-hour chart analysis, the trend line is seen as a strong support level that could drive prices upward in the near future. The immediate hurdle lies at $35,382, and surpassing this resistance is anticipated to bolster Bitcoin (BTC) for further valuation increases.
What are your opinions regarding this analysis? Do you concur?

CARDANO - Keylevels - WeeklyCardano had some better days and managed to recover some important price zones, but overall, we still have a downward trend, macro speaking.
I am a buyer from areas 0.27, 0.28, 0.29
I have no intention of selling any time soon.

PEPEUSDTPEPEUSDT is in strong bullish trend.
As the market is consistently printing new HHs and HLs.
currently the market is being respected by inclining trendline and has also formed bullish flag pattern which is also being supported by inclining trendline.
These two to gather putting strong bullish confluence for the pair.
What you guys think of this idea

AVAX Under ☁️ Skies: Is it Time to Sell? Bullish sun ☀️ shines over most of the global crypto market, indicating a continued upward trend in the coming 24 hours. Cloudier ☁️ bearish trading conditions linger over Ripple’s XRP, Avalanche, and Binance Coin, signaling a downward trend, ATTMO shows.
Over a one-week horizon, the bullish sun ☀️ will continue to dominate the crypto universe, though Litecoin and XRP may face cloudier 🌥️ conditions and a downward trend.
Follow us for more crypto weather reports!

END IN 2-LEVEL ZONE*-Technical Analysis 📈
in bullrun and need rest this trend
*Trade (Sell) 📊
0.3935$
*-Stop Loss 🔴
0.4154$
*-Take Profit 🎯
0.3382$
*-Risk Management 🚧
2%
👨🎓 Experience and Education: Our trading team has five years of experience in financial markets, especially cryptocurrencie

BTC & ADA Face a Threatening Cloudy Forecast ☁️ Time to Sell? 🌦️ The global crypto market still has upside potential according to ATTMO, which forecasts slightly bullish trading conditions in the next 24 hours. Binance Coin bucks this positive trend, facing cloudier ☁️ bearish trading conditions.
Over a one-week horizon, Bitcoin and Cardano, are set to face an imminent market correction. A bullish ☀️ sun will, however, continue to shine over Ethereum, Ripple’s XRP and Avalanche over this longer time horizon. Litecoin, Polygon and Uniswap are set to head lower, as they face slightly bearish ☁️ clouds.
Follow us for more crypto weather reports!

BTC Bitcoin updateWe don't yet have a SELL signal.
However, my custom tweaked indicators are showing we have a pivot point (buy PUTS from) and we have an overbought signal.
I would recommend not getting overly bullish here and or taking some profit's and banking them before you possibly lose them if you've had the right positions for this move UP.
Always best to secure some of these gains while waiting for better confirmation of next moves.
If your LT holder and don't plan on looking at it much over the next 6-18 months, then maybe less of an ordeal to ponder. But for those actually trading this, especially those trading with leverage, even if that means you're using something like OTC:GBTC or some other proxy stock with 1x leverage given by your broker. You should consider de-risking a bit here.
Just my $0.02
Preservation of capital should ALWAYS be on your mind.

SUSHI 1W bullish if breaks resistanceSUSHI testing resistance on the weekly timeframe. Breaking out of resistance trendline will be bullish. Targets : 1, 1.645.

XRP ☀️ Outlook; Bullish Trend On? Mixed trading conditions ahead on the global crypto market in the next 24 hours, with Bitcoin and Binance Coin facing slightly bearish clouds. ☁️ This implies a downside risk. The rest of the cryptosphere will see cloudy spells, indicating further upside potential. Ripple, which faces strong sunshine ☀️ , has the most upside potential, according to ATTMO.
Over a one-week horizon, Bitcoin faces tropical 🌦️ trading conditions, which signal that the drawn-out bull market is nearing its end, with an imminent market correction ahead. A bullish sun ☀️ will continue to shine over Ethereum, Ripple, and Cardano, indicating additional upside potential. Smaller coins such as Polygon and Uniswap face bearish clouds, signaling a downward risk ahead. ☁️
Follow us for more crypto weather reports!