Magic of statistical models and mathematics Hey everyone! 👋 I wanted to share some of the magic of statistical models and mathematics with you. ✨ Check out how price reacts to Fibonacci levels, those levels are determined by using the VAR statistical model. 📊
It's amazing how numbers and patterns can reveal hidden insights in the market! It's like watching a secret code unfold right before our eyes. 🤩 The way price respects those Fibonacci levels is truly fascinating. It's a testament to the power of these models and the beauty of mathematics. 🤓
Enjoy the show! 🍿
Cryptolevels

PEPE...Hello friends
Regarding the price drop, now that buyers are supporting the price, it was entered within the specified support ranges with capital and risk management.
*Trade safely with us*

BTCUSDT - it's breakout ? What's next??#BTCUSDT.. market just broke our resistance and going to close above that.
Keep close that because 85100 is now our supporting area and if market holds that then further bounce expected.
Note: keep in mind that below 85100 we will cut n reverse on confirmation .
Good luck
Trade wisely

Is ALT season coming ? There is a chance we are about to see it The OTHERS Market Cap chart - Showing the MArket Cap of the TOP 125 coins MINUS the top 10 by Dominance.
So, this will show us the Mid Cap ALT coins
And as the chart shows you, there is a chance we could repeat a pattern and if so, could bring some relief to many MANY Alt Coins holders who have had a nightmare time so far this cycle.
So, Left hand arrow shows you the Dip after the 2017 High. See the trend line that comes off that, rejected PA in 2018 and 2020
Now look at the Right Arrow. Very similar situation.
and not only that but PA is on the lower trend line, Support..But also that Dashed Long Term Support line.
This is make or break for ALTS and given the change of Heart in the Markets, about acceptance of Crypto, there is no reason this shold not go through the roof - Providing the Liquidity is there.
THAT IS THE CRUNCH
So, we wait to see but ina positive mind set.
Things can turn around Quickly.

$BTC quiet before the storm?Bitcoin looks bear flaggy / rising wedge. Trading range getting tighter which normally is followed by an explosive move. I'm guessing it will be to the downside with a target of appx. 74k. I could also see it overshooting and then retaking the key area.

BTC Looking Bullish | Trade view for 22-23 March 20251D/1H/15 minutes all show a bullish pattern in the BTC.
After Applying Fibonacci we find a strong Golden zone for support with good volumes. BTC is expected to move higher.
Entry, SL and TP are mentioned in the trade view.
Note: Due to weekend the markets will be slow. Make sure to enter with small quantities.
Happy Weekend with the trades.

A Litecoin Swing TradeMarkets have been understandably battered over the last weeks. Current conditions are why I've generally been cautious about trading, and not getting married to long positions. As I explained in my last Litecoin analysis, things are precarious. The good thing is, I got out of my trades with a little bit of profit and no losses. The bad thing is, entering long right now is a bit scary. We cannot predict economic conditions. Instead, we can use sentiment. Sentiment for altcoins is totally in the gutter right now. Based on this alone, a bounce makes sense.
On the weekly chart, Litecoin is (so far) holding the 50 and 100 moving averages, while it broke below the 200. To look bullish on bigger timeframes, price needs to at least stabilize here and begin slowly moving up to allow the MA structure to bullishly support price (a weekly golden cross would be a start).
This play is simple - buying at support here between $86-94 and selling at resistance, near $106-107 (conservatively). If price makes it back up there, I will observe conditions to determine whether an additional leg up seems likely. If price is rejected heavily up there, it could point to another leg down. I'm also watching whether Bitcoin can break back above its 50 and 100 day moving averages. Litecoin is unlikely to have any explosive ATH moves if Bitcoin cannot at least get back above $90K and stay there for a while, I think.
On the downside, taking out the $80 level would set up price to fall back towards $50-66, and it may take a long while to recover. I may stop myself out if that happens and aim to rebuy near $66.
Litecoin has experienced steady (though not explosive) growth. This seems somewhat attractive to me when it comes to crypto. While I wouldn't be surprised to see this entire market fade in the future and be forgotten as an investment, this one at least sees some steady user growth.
This post is to show that even though I remain largely bearish on crypto, I am open to trading opportunities that present themselves, even if they are narrow in scope and focus on one cryptocurrency.
This is not meant as financial advice, but for speculation and entertainment only!
Thanks for reading :)
-Victor Cobra

XRP/USD Skyrockets to the MoonXRP/USD Breakout Alert! After consolidating below key resistance around $2.107, XRP has surged to $7.25, hitting a target gain of 7.25x! The price has broken through multiple resistance levels, showing strong bullish momentum. Are we heading for new all-time highs? Let’s discuss!

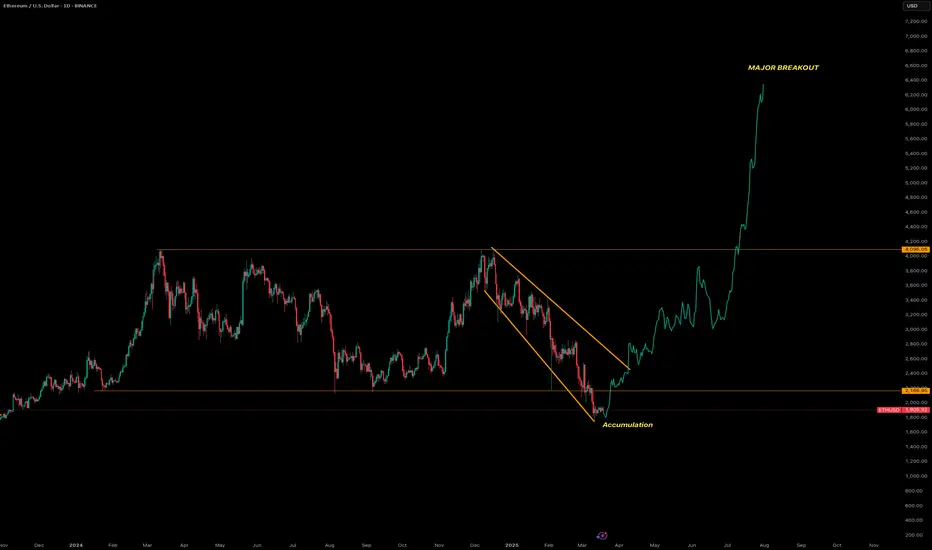
Ethereum will make a major Breakoutanalysis the chart
Let’s analyze the provided Ethereum (ETH/USD) chart on a daily timeframe from TradingView, focusing on the key technical elements and trends:
1. Overall Trend
The chart displays a significant bullish trend for Ethereum, with the price rising from around $2,200 in early 2024 to approximately $4,000 as of the latest data point (March 18, 2025).
The upward movement is marked by a sharp breakout, indicating a strong shift in momentum from consolidation to a rapid ascent.
2. Price Levels and Targets
Current Price: Approximately $4,000, with a previous support/resistance zone around $2,200.
The chart highlights a major breakout above the descending triangle pattern, suggesting potential for further upside, though no specific price target is explicitly labeled beyond the current level.
3. Technical Patterns
Descending Triangle: The chart features a descending triangle pattern, typically considered a bearish continuation pattern. However, the recent price action has broken out upward through the upper resistance line (around $2,200-$2,500), invalidating the bearish outlook and turning it into a bullish reversal signal.
Accumulation Phase: A clear accumulation zone is marked near the lower boundary of the triangle (around $2,200), where the price consolidated before the breakout. This suggests strong buying interest built up at this level, supporting the subsequent rally.
4. Support and Resistance
Support: The $2,200 level, which acted as the lower boundary of the triangle, now serves as a potential support zone if the price pulls back. This level could be retested as new support following the breakout.
Resistance: The next resistance is not explicitly marked, but the rapid upward move suggests the price may face selling pressure around previous highs (e.g., $4,500-$5,000) or psychological levels like $5,000, based on Ethereum’s historical behavior.
5. Volume and Momentum
Volume data isn’t shown, but the steep upward slope post-breakout indicates significant buying pressure and momentum. A breakout with high volume would further confirm the strength of this move.
6. Timeframe and Projection
The chart spans from late 2023 to mid-2025, with the major breakout occurring around early 2025. The sharp rise suggests this bullish momentum could continue in the short to medium term, potentially pushing Ethereum toward new all-time highs (above $4,800, its previous peak).
7. Key Observations
The upward breakout from the descending triangle is a powerful bullish signal, often indicating a reversal of prior bearish pressure and the start of a new uptrend.
The accumulation phase near $2,200 reflects a period where buyers absorbed selling pressure, setting the stage for the breakout.
Potential risks include a pullback to retest the broken resistance (now support) at $2,200-$2,500, or overextension if the rally lacks consolidation. Monitoring for overbought conditions (e.g., via RSI or other indicators) could be prudent.
Cronos will reach 0.50$1. Price Action and Trend Analysis
Historical Movement (Late 2023 to Early 2025):
The chart shows a significant upward movement starting around late 2023, where the price of CRO/USD spikes sharply from around $0.0600 to a peak near $0.1800 by early 2024. This indicates a strong bullish trend during this period, likely driven by market sentiment, adoption, or other fundamental factors related to Cronos.
After reaching this peak, the price experiences a sharp decline, dropping back to around $0.0728 by mid-2024. This suggests a correction or profit-taking phase following the rally.
From mid-2024 to late 2024, the price consolidates, fluctuating between $0.0600 and $0.0800, indicating a period of indecision or accumulation.
Recent Movement (Late 2024 to March 2025):
Starting around November 2024, the price breaks out again, surging to a new high of approximately $0.1600 by early 2025. This second rally mirrors the earlier one but doesn’t quite reach the previous peak of $0.1800.
Following this peak, the price begins to decline, forming a descending triangle pattern (more on this below). By March 11, 2025, the price is at $0.08138, as indicated on the right side of the chart.
2. Key Technical Patterns and Indicators
Descending Triangle:
The chart highlights a descending triangle pattern, which is typically a bearish continuation pattern. This pattern is characterized by a flat support line (around $0.0728) and a downward-sloping resistance line (the upper trendline of the triangle).
The price has recently broken below the support level of $0.0728, which is a bearish signal. This breakout suggests that sellers have taken control, and the price may continue to decline.
Support and Resistance Levels:
Support: The $0.0728 level acted as strong support during the consolidation phase and the base of the descending triangle. However, the recent break below this level indicates that this support has failed, and the next potential support might be around $0.0600 (a previous low from mid-2024).
Resistance: The upper trendline of the descending triangle (around $0.1000 at the time of the breakout) acted as resistance. Additionally, the $0.1600 level from the recent peak could serve as a future resistance if the price attempts to recover.
Projected Target (Yellow Arrow):
The chart includes a yellow arrow pointing downward, suggesting a projected price target following the breakout from the descending triangle. In technical analysis, the price target for a descending triangle breakout is often calculated by measuring the height of the triangle (from the highest point to the support) and projecting that distance downward from the breakout point.
The height of the triangle is roughly $0.0872 ($0.1600 - $0.0728). Subtracting this from the breakout point ($0.0728) gives a target of approximately $0.0728 - $0.0872 = -$0.0144. Since prices cannot go negative, this suggests the price could approach $0.0000, but in practical terms, it might find support at a previous low like $0.0600 or lower, depending on market conditions.
3. Volume and Momentum
While the chart doesn’t explicitly show volume bars, breakouts from patterns like the descending triangle are typically more reliable when accompanied by high volume. If the breakout below $0.0728 occurred with increased selling volume, it would reinforce the bearish outlook.
The momentum appears to have shifted from bullish (during the rally to $0.1600) to bearish, as evidenced by the descending triangle and the subsequent breakdown.

Bitcoin's epic journey to $160K1. Overall Trend
The chart shows a long-term bullish trend for Bitcoin, with the price rising significantly from around $50,000 in early 2023 to approximately $123,130 as of the latest data point (March 18, 2025).
The upward movement is characterized by a series of higher highs and higher lows, indicating strong bullish momentum.
2. Price Levels and Targets
The chart highlights a projected target of $160,000, labeled as "Reaching at 160K." This suggests the analyst anticipates a potential breakout or continuation of the current uptrend to this level.
Current price: Approximately $123,130, with previous support/resistance zones marked at $77,917 and $56,707. These levels likely represent significant historical support where accumulation occurred.
3. Technical Patterns
Ascending Triangle: The chart features an ascending triangle pattern, a bullish continuation pattern. The upper resistance line slopes downward slightly, while the lower support line slopes upward, converging toward a breakout point. The recent price action appears to have broken above this triangle, supporting the bullish outlook.
Accumulation Phases: Two distinct accumulation zones are marked:
The first accumulation phase is around the $56,707 - $77,917 range, where the price consolidated before the initial breakout.
The second accumulation phase is near the $100,000 - $120,000 range, followed by a sharp upward move toward the current price and the projected $160,000 target.
4. Support and Resistance
Support: The lower boundary of the ascending triangle and the accumulation zones (e.g., $77,917 and $56,707) act as potential support levels if the price pulls back.
Resistance: The next major resistance is implied at $160,000, where the price may face selling pressure or consolidation before potentially moving higher.
5. Volume and Momentum
While volume data isn’t explicitly shown, the sharp upward move after the breakout from the triangle suggests increasing buying pressure and momentum, typical of a strong bullish trend.
6. Timeframe and Projection
The chart spans from early 2023 to mid-2025, with the $160,000 target likely projected to be reached by mid-2025, aligning with the current trajectory and historical bullish cycles.

NOTCOINHello friends
As you can see, the price has been very strongly supported by buyers from the support area we have identified, causing a price pump.
Now, in the areas we have identified, you can buy in steps with capital management and move to the specified targets.
*Trade safely with us*

CAKE/USD: Ready for a Massive Breakout?Chart Analysis:
1. Timeframe and Price Context
Timeframe: Daily chart (each candlestick represents 1 day of trading).
Price Levels:
The current price is $15.486779, as indicated on the chart.
The price range on the chart spans from near $0 (early 2021) to a peak of approximately $47.862159 (late 2024), followed by a sharp correction to the current level.
Trend Overview:
2021-2023: CAKE starts near $0 and experiences a strong uptrend, likely driven by the growth of the Binance Smart Chain (BSC) and DeFi adoption, peaking around $40-$50 in 2021-2022, with some consolidation.
Late 2024: A significant rally pushes the price to $47.862159, followed by a sharp correction.
Early 2025: The price has stabilized around $15.486779, within the annotated "Buying Zone."
2. Key Patterns and Annotations
Post-Rally Correction:
After reaching a peak of $47.862159, CAKE experienced a steep decline (approximately 68% drop to $1.5486779), indicating a strong correction phase.
This correction likely reflects profit-taking or broader market pressure after the rally.
Buying Zone:
The chart labels a "Buying Zone" around the current price level of $15.486779, suggesting this is a perceived support area where accumulation by traders or whales might occur.
This zone aligns with a horizontal support level where the price has consolidated after the correction.
Breakout Prediction:
An upward arrow with the annotation "TG 4BS" suggests a bullish target, which I interpret as $48 (given the price scale and the prior peak of $47.862159). This would represent a ~210% increase from the current price of $1.5486779.
The target aligns with the prior all-time high, indicating a potential retest or breakout to new highs.
3. Support and Resistance Levels
Support:
The "Buying Zone" at $1.5486779 appears to be a strong support level, where the price has stabilized post-correction.
If this support breaks, the next significant level could be around $10-$12 (a psychological and historical support from 2023).
Resistance:
The immediate resistance is likely around $20-$25, a prior consolidation zone during the uptrend.
The $47.862159 level (recent high) is a major resistance, and the $48 target (as annotated) is the next key level to watch.
4. Volume and Momentum (Not Visible but Inferred)
Volume bars are not clearly visible, but typical behavior suggests:
Volume likely spiked during the rally to $47.862159 and decreased during the correction as selling pressure eased.
A breakout would require a volume surge to confirm, especially if the price moves toward $48.
Momentum indicators (e.g., RSI or MACD) could indicate whether CAKE is oversold or showing bullish divergence, supporting a reversal.
5. Potential Scenarios
Bullish Breakout:
If CAKE breaks above the $20-$25 resistance with strong volume, it could confirm a bullish trend, targeting the $48 level.
The "Buying Zone" at $1.5486779 suggests accumulation, which could fuel a rally if buying pressure increases. This would align with a ~210% move, consistent with prior bullish cycles in DeFi tokens.
Bearish Breakdown:
If the price fails to hold the $1.5486779 support and breaks below, it could signal further downside.
The next support at $10-$12 could be tested, potentially leading to a deeper correction.
Consolidation:
If the price remains within the "Buying Zone" (around $15-$18), it might continue to consolidate until a catalyst (e.g., BSC ecosystem growth, market rally) triggers a move.
6. Market Context
DeFi and BSC Influence: CAKE, as the governance token of PancakeSwap (a leading DEX on BSC), is influenced by DeFi adoption, BSC network activity, and broader crypto market trends (e.g., Bitcoin and Ethereum performance from your previous charts).
Whale Activity: The "Buying Zone" annotation suggests whales or smart money might be accumulating at this level, similar to your earlier analyses of Ethereum, UNISWAP, Bitcoin, and Dogecoin. This could set the stage for a breakout.
Timing: On a daily timeframe, a breakout could occur within weeks to months, depending on market conditions and catalysts.

BITCOIN 50 & 100 SMA Patterns since 2014 -UPDATE - ATH in Q4 ?This is a long post but please read it all, there are some Major things to take note of.
The Main item in this post is the day counts between 50 SMA ( RED ) and 100 SMA ( BLUE ) and the days between Cross overs of these.
The upper day counts on the chart, count from ATH to when 50 crosses below the 100.
Then from that point to when the 50 Crosses back Above the 100
And then, in Grey, the number of days from Cross over to ATH
From 2014 ATH to 50 dropping Below = 504 days
When the 50 returned Above the 100 = 406 days
And from that point to the 2017 ATH = 560 days
From 2017 ATH to 50 dropping Below = 448 days
When the 50 returned Above the 100 = 284 days
And from that point to the 2021 ATH = 686 days ( I am using the Nov 2921 ATH as it was the higher price )
From 2021 ATH to 50 dropping Below = 308 days
When the 50 returned Above the 100 = 441 days
And from that point to the 2025 ATH = The average of the 2 previous is 623 days and takes us to a possible ATH in August, though I feel this is too soon.
If we Look at the day count from ATH to 50 dropping below 100
From 2014 ATH to 50 dropping Below = 504 days
From 2017 ATH to 50 dropping Below = 448 days
From 2021 ATH to 50 dropping Below = 308 days
Could this point towards around 200 days after ATH in 2025?
( This reduction in day count is most likely due ti rapid Profit taking. )
What is interesting is how, on Both the 2014 - 2017 and 2017 - 2021 ATH it was approx 1005 days between the 50 rising above the 100 to when ot fell back below after an ATH. This is Despite a variation in the days count between SMA cross overs.
Using this day count and projecting forward, maybe we can expect the 50 to drop back below the 100 in August 2026, next year
Using the day count from ATH to when 50 Drops below, that was mentioned above, that is around 200 days after ATH and using that August date just mentioned, We are projecting a Cycle ATH in Feb 2026 !
This is NOT a realistic date if we are to remain in the patterns of ATH in late Q4, that we have had every previous cycle.
As I pointed out in a post yesterday, the traditional patterns of Bitcoin HAVE to change this year.
And to many extents, they already have begun.
Take a Look at the angle of ascent of the 50 and 100 SMA's since 2014. Each cycle has seen a reduction of Steepness of Rise.... A slowing down on trajectory and this is most likely caused by the increase of price of a Bitcoin.
The more expensive it gets, the heavier it is to move PA higher.
So far this cycle, PA has landed on the 50 SMA twice and we are SO Close to doing that again.
This has NEVER happened before.
In 2021, we did it once and bounced to the Nov 2021 ATH, so far this cycle, we have done that twice.
This ARE CHANGING and for this to continue, we do need to see PA Bounce again off the 50, when the Bulls are ready.
The ATH in Q4 is open to question as a result. It may happen anytime from Late Q3 to Late Q1 2026
And we are only going to find out when it happens.
But be aware f things changing.
Because they are and so using History may become unusable....a bit like Price discoveryIt will become Trend discovery
Enjoy

Bitcoin is ABSOLUTELY under Pressure - It MUST react before DECI have been looking at this in detail for some time and have decided to change how I calculate things and here is the result.
There are 2 things of Massive importance to see here.
First is that Curve that PA has been under since 2010
The Lower Dashed Line is the Trend line formed in 2011. It is Strong and it is Valid and PA is currently running along it.
Here is a closer image to show you where we are in relation to it right now. Directly below PA currently, we hit that line around 67K
The Apex of this "Triangle" is December THIS YEAR
PA Has to break Above that Arc, the same Arc that has Rejected PA EVERY TIME since 2011
BUT THIS TIME IS DIFFERENT - IT HAS TO BE and here is why
I am not going to explain the % increase each Cycle Low to ATH, it is in the chart but I do want to show you this,
The first real push of Bitcoin was a massive % rise that created the ATH that formed the 1st point of the Lower Trend line of the New channel. This is A on the chart
The Next push was to B. This push was 1.433% of the Original push A - smaller by a long way in % terms.
These 2 moves created the channel that PA has remained in ever since. ( see dashed upper trend line)
From this point on, we can see that each cycle push , while in channel, has been approx 20% of the previous rise. Or around 1/5 of the size in % terms
Or to put is another way, Each Rise has been a diminishing % rise from previous.
Look at that curve. It has pushed PA down each cycle ATH
This cycle, we are currently at 26.7% of the previous push ( to 2021 ATH ) and it has created a cycle ATH currently.
But is the cycle Over ? - Hopefully NOT
Because if it is NOT over, we need to break through that Curve of resistance by December.
The Much expected 200K ATH is way over that curve and would result in a 55% of previous push rise. That would break the "trend"
This is VERY Different. But Absolutely required.
So, the question that should be on Everyone's lips is "Which is stronger ? The line or the Arc ?"
My expectation is that we will break through. That Arc has been a Major part of the formative years of Bitcoin PA but now, it could prove detrimental. Because, if we do not break through it, It will push Peice DOWN, through that line of Long term support.
We do not want that
SO, Maybe THIS is why the Bulls are waiting for the Weekly MACD to reset to Neutral...PA Needs the strength to break through.
So, Go Buy your Local BULL a Beer ( or white wine lol ) and Lets get on.
Watch this Close. It really is more important that Trumps Reserve, Saylors Love nest or Bezos after burners.................

Bitcoin will reach $221,000The chart explicitly labels a "Breakout" point around December 15, 2024, where the price moves above the $80,000 resistance level of the ascending triangle. This breakout is a significant technical event, suggesting strong buying pressure and a continuation of the uptrend. Following the breakout, the chart notes a "Retracement" phase, where the price pulls back to test the breakout level (now acting as support at approximately $80,000). This behavior is common in technical analysis, as prices often retest previous resistance levels after a breakout to confirm support.
As of March 14, 2025, the current price of $80,228.30 is just above the $80,000 level, suggesting the price may be in the early stages of this retracement or has recently stabilized after testing the support. This positioning indicates potential buying opportunities for traders looking for entry points near this level, with expectations of further upward movement.
Projected Price Target: $221,000
One of the most notable annotations on the chart is the "TG $221,000" label, which stands for "Target Price" of $221,000. This target is projected based on the breakout from the ascending triangle, likely calculated by taking the height of the triangle (the difference between the resistance at $80,000 and the lowest support at $55,000, which is $25,000) and adding it to the breakout level ($80,000 + $25,000 = $105,000). However, the chart's projection to $221,000 suggests a more aggressive target, possibly involving a multiple of the height (e.g., 3x the height, $80,000 + $75,000 = $155,000, still not reaching $221,000) or a Fibonacci extension beyond standard calculations.
Given the significant gap between the current price ($80,228.30) and the target ($221,000), this projection is an unexpected detail, implying a potential multi-fold increase in Bitcoin's value. It aligns with the chart's bullish patterns but involves considerable uncertainty, as market conditions, macroeconomic factors, and adoption rates could influence actual price movements.
Additional Technical Observations
Beyond the ascending channel and triangle, the chart includes several other technical elements:
Support and Resistance Levels: The $80,000 level, initially a resistance during the triangle, becomes a key support level post-breakout. The lower trendline of the ascending channel also acts as dynamic support throughout the uptrend, providing a floor for price corrections.
Volume Indicator (Implied): While not explicitly shown, breakouts like the one labeled are often accompanied by increased volume, which would confirm the strength of the move. Without a visible volume histogram, this remains an inference.
Fibonacci Retracement (Potential): The retracement after the breakout could be analyzed using Fibonacci levels (e.g., 38.2%, 50%, 61.8%) to identify key support zones, though these are not drawn on the chart.
Momentum and Moving Averages (Implied): Although not visible, momentum indicators like RSI or MACD could provide additional insights. For instance, a strong breakout might correlate with overbought RSI, while the retracement could indicate a return to neutral levels. Moving averages (e.g., 50-day, 200-day) might have supported the uptrend earlier, with the price potentially approaching these for support during retracements.
Implications for Traders
The analysis suggests Bitcoin is in a robust bullish trend, supported by the ascending channel, triangle breakout, and projected target. Traders may consider the following strategies:
Buy on Pullbacks: Look for buying opportunities near the $80,000 support level, especially if volume and other indicators confirm buying pressure.
Target Setting: Use the projected target of $221,000 as a long-term goal, but be mindful of market volatility and external factors that could affect price.
Risk Management: Given the significant gap to the target, set stop-loss levels below key support (e.g., below $80,000) to manage risk.

Uniswap will reach 150$Technical Analysis of Uniswap Chart
Overall Trend and Structure:
The chart shows a multi-phase trend: an initial upward move in mid-2024, a consolidation phase with lower highs and lower lows forming a descending pattern, and a sharp bullish breakout in early 2025 (around March 2025).
The recent steep upward movement suggests strong buying pressure, potentially indicating a breakout from a corrective pattern (e.g., descending triangle or wedge).
Key Trendlines and Levels:
Descending Trendline: The orange descending trendline connects the lower highs during the consolidation phase, acting as resistance. The price breaking above this trendline in early 2025 is a bullish signal, suggesting the end of the corrective phase.
Horizontal Support/Resistance: The orange horizontal line near the middle of the chart likely served as support during consolidation (possibly around $10–$12 on an adjusted scale). The breakout above this level reinforces bullish momentum.
Recent Surge: The vertical orange line on the right indicates a rapid price increase, potentially pushing UNI from the $10–$12 range to $15–$20 (adjusted from the $16,000,000 mark on the y-axis, assuming a $0–$30 scale).
Candlestick Patterns and Momentum:
The candlesticks show volatility, with green candles dominating the recent surge, indicating strong bullish momentum. Red candles during consolidation suggest profit-taking or selling pressure that has now been overcome.
The steepness of the rise suggests high volume or a catalyst (e.g., news, DeFi adoption, or Ethereum ecosystem developments), though volume data isn’t visible.
Potential Technical Patterns:
The chart resembles a descending triangle or wedge breakout. A descending triangle typically signals a bearish continuation, but an upward breakout (as seen here) can indicate a reversal to a bullish trend, especially if supported by volume.
The breakout above the trendline suggests a potential target measured by the height of the triangle base (e.g., if the base is $5 wide, add $5 to the breakout point, targeting $20–$25).
Support and Resistance Levels:
Support: The broken trendline and horizontal line (now support) around $10–$12 are critical. A pullback to retest this level would be a common post-breakout behavior.
Resistance: The next resistance might be at the recent high (e.g., $20) or a psychological level like $25, based on historical UNI peaks (e.g., its all-time high of $44.97 in May 2021).
Overbought conditions could emerge if the rally continues unchecked, warranting caution.
Market Context and Sentiment:
Uniswap, as a leading DeFi protocol, benefits from Ethereum’s ecosystem growth, protocol upgrades (e.g., Uniswap v4 or Unichain), and increasing DeFi adoption. The recent surge might reflect such developments in early 2025.
Web-based price predictions for March 2025 vary widely: averages range from $6.30 to $12.69, with highs up to $13.58–$25.75, suggesting the chart’s surge aligns with an optimistic scenario. Posts on X indicate mixed sentiment, with some noting bearish pressure earlier in March (-30% reported) but others highlighting bullish potential if demand zones hold.
The chart’s bullish breakout contrasts with some bearish technical indicators (e.g., RSI oversold at 34.69 noted on X), suggesting a possible short-term correction after the rapid rise.
Interpretation and Outlook
Bullish Case: The breakout above the descending trendline and horizontal support signals a strong bullish reversal. If momentum continues, UNI could target $20–$25 in the near term, supported by DeFi growth and market sentiment. A retest of $10–$12 as support would confirm the breakout’s validity.

SEI will reach at 1.4$
Price Movement and Trend:
The chart shows a significant upward movement starting around mid-2024, peaking at a high (likely around $1.14-$1.20 based on the vertical scale), followed by a sharp decline.
After the peak, the price enters a consolidation phase with lower volatility, fluctuating around the "Accumulation zone" marked at approximately $0.196746.
A recent upward trend is suggested, with the price appearing to approach or break above the $1.143922 level (labeled as "Target 1.4$"), indicating potential bullish momentum.
Accumulation Zone:
The "Accumulation zone" is identified around $0.196746, which seems to act as a support level where the price has stabilized after the decline. This zone likely represents a range where buyers have been accumulating the asset, potentially preparing for the next upward move.
The prolonged consolidation in this range suggests a period of low selling pressure and possible buying interest.
Target 1.4$:
The chart highlights a target price of $1.4, with the current price nearing $1.143922. This suggests that the analyst or trader anticipates a potential rise to $1.4 if the current upward trend continues.
The upward arrow and the proximity to this target indicate a bullish outlook, possibly driven by a breakout from the accumulation phase.
Volume and Candlestick Patterns:
While the chart doesn’t explicitly show volume bars, the candlestick patterns (green for bullish, red for bearish) indicate periods of buying and selling pressure. The recent green candles suggest increasing buying interest.
The sharp drop after the peak and the subsequent consolidation could indicate profit-taking followed by a base-building phase.
Timeframe and Context:
The chart covers a period from mid-2024 to March 2025, with the current date being March 14, 2025. This long-term view suggests the analysis is focused on a medium-to-long-term trend rather than short-term fluctuations.
The upward trajectory toward $1.4$ might be based on technical analysis (e.g., resistance levels, Fibonacci extensions, or historical price action), though specific indicators are not visible.
Interpretation:
The chart suggests that SEI/USDT has undergone a significant rally, followed by a correction and consolidation in the accumulation zone around $0.19-$0.20. The recent upward movement toward $1.14 indicates a potential breakout or continuation of an uptrend.
The target of $1.4$ could represent a resistance level or a projected price based on the analyst’s strategy (e.g., a measured move from the accumulation range).
Traders might interpret this as a buying opportunity if the price holds above the accumulation zone, with a stop-loss potentially set below $0.19, aiming for the $1.4 target.

Bitcoin’s Wild Ride: Up or Down, I’m Watching!Hey there, trading family—just chilling and watching Bitcoin like it’s my buddy on a rollercoaster. It’s hanging out near that FWB:83K spot, and I’m like, “Dude, if you bust through, I can see you tearing up to $120K-$130K—time for a high-five and a snack!” But if you start slipping with those lower lows, no biggie. You might drop to $79,600, then maybe $78,700, $77,000, or even $73,500. I’m just kicking back, enjoying the show—up or down, it’s all good vibes! If you liked this, comment below, boost, or follow—let’s keep the trading love going!
Kris/ Mindbloome Exchange
Trade Smarter Live Better

XRP will explode in valuePrice Movement and Trends
Initial Consolidation (August 2024 - November 2024):
XRP starts the chart trading sideways around $0.50 to $0.60. This period shows low volatility with small candlesticks, indicating a lack of strong directional momentum. It suggests a consolidation phase where buyers and sellers were in balance.
Breakout and Uptrend (Late November 2024 - January 2025):
Around late November 2024, XRP breaks out of its consolidation with a sharp upward move. The price surges from $0.60 to a peak of around $4.00 by early January 2025, a massive increase of over 500% in a short period.
This rally is characterized by large green candlesticks, indicating strong buying pressure. The consistent higher highs and higher lows confirm a strong bullish trend.
Volume likely increased during this period (though volume bars aren’t visible), as such a significant price move typically requires high participation.
Peak and Correction (January 2025 - February 2025):
XRP reaches a high of approximately $4.00 in early January 2025, followed by a sharp correction. The price drops to around $2.50 by mid-February 2025, a decline of about 37.5% from the peak.
This correction is marked by large red candlesticks, showing strong selling pressure. The drop suggests profit-taking by traders who entered during the earlier rally, possibly triggered by overbought conditions (though no RSI or similar indicators are visible to confirm this).
Stabilization and Recovery Attempt (February 2025 - March 2025):
After the correction, XRP stabilizes between $2.50 and $3.00. The price shows smaller candlesticks and some consolidation, indicating a pause in the downtrend.
Toward early March 2025, XRP attempts a recovery, climbing back to $2.837 by March 13, 2025. The smaller green candlesticks in this phase suggest cautious buying, but the momentum isn’t as strong as the earlier rally.
Key Levels and Support/Resistance
Support: The $2.50 level acted as a support during the correction in February 2025. This level held multiple times, indicating buyers stepping in to defend it.
Resistance: The $4.00 level was a significant resistance, as it marked the peak of the rally before the correction. If XRP attempts another upward move, this level may act as a barrier.
Current Price: At $2.837, XRP is trading above the recent support but far below its January peak, suggesting it’s in a consolidation phase with potential for either direction.
Technical Observations
Volatility: The chart shows periods of both high and low volatility. The rally in November-December 2024 was highly volatile, while the consolidation phases (August-November 2024 and February-March 2025) show lower volatility.
Trend: The overall trend from November 2024 to March 2025 is bullish, despite the correction. The price is still significantly higher than its starting point in August 2024.
Candlestick Patterns: The large green candles during the rally and large red candles during the correction indicate strong momentum in both directions. The smaller candles in March 2025 suggest indecision in the market.
Potential Scenarios
Bullish Case:
If XRP breaks above $3.00 with strong volume, it could signal the start of another uptrend, potentially retesting the $4.00 resistance.
A move above $4.00 could open the door for new all-time highs, especially if market sentiment for cryptocurrencies remains positive.

BITCOIN GETTING READY FOR ANOTHER BIG RALLYBitcoin after huge fall again making TRIANGLE pattern also bearish FLAG
we can get 5000-10000 points strong rally on breakout side from this range
follow us for crypto free analysis calls daily

Dogecoin will reach 2$Chart Analysis:
1. Timeframe and Price Context
Timeframe: Daily chart (each candlestick represents 1 day of trading).
Price Levels:
The current price is $0.1798, as indicated on the chart.
The price range on the chart spans from approximately $0.0800 (early 2024) to a peak near $0.3000 (late 2024), followed by a correction to the current level.
Trend Overview:
Early 2024: Dogecoin starts around $0.0800 and experiences a gradual uptrend with volatility, eventually rallying sharply.
Late 2024: The price peaks near $0.3000 before correcting downward into a consolidation phase.
Early 2025: The price is consolidating within a symmetrical triangle, with the current price at $0.1798.
2. Key Patterns and Annotations
Symmetrical Triangle:
The chart shows a symmetrical triangle pattern, which is a neutral consolidation pattern that typically signals a continuation of the prior trend (in this case, an uptrend).
Upper Trendline: A descending trendline starting from the $0.3000 peak, acting as resistance.
Lower Trendline: An ascending trendline starting from the $0.0800 low, acting as support.
The price is near the apex of the triangle, indicating an impending breakout (upward or downward).
Breakout Prediction:
An upward arrow with the annotation "TG 1 $5" suggests a bullish breakout targeting $5.00—a highly ambitious target representing a ~2,680% increase from the current price of $0.1798.
"FATE LOVES IRONY":
The image and text "FATE LOVES IRONY" (featuring a Doge meme with a spiral sun and flames) likely reflect a playful or ironic sentiment often associated with Dogecoin’s community. It may imply that despite Dogecoin’s origins as a meme coin, it could defy expectations with a massive rally—an ironic twist.
3. Support and Resistance Levels
Support:
The lower trendline of the symmetrical triangle (around $0.1400-$0.1600) has acted as support during the consolidation phase.
If this support breaks, the next significant level could be around $0.0800-$0.1000 (a prior support zone from early 2024).
Resistance:
The upper trendline of the triangle (around $0.2000-$0.2200) is the immediate resistance.
Beyond that, $0.3000 (the recent high) is a major resistance level.
The $5.00 target is a long-term, speculative goal far beyond current levels.
4. Volume and Momentum (Not Visible but Inferred)
Volume bars are not clearly visible, but typical behavior suggests:
Volume likely increased during the rally to $0.3000 and decreased during the consolidation phase within the triangle.
A breakout would require a volume spike to confirm, especially if the price breaks above the upper trendline (around $0.2000-$0.2200).
Momentum indicators (e.g., RSI or MACD) could indicate whether Dogecoin is oversold or showing bullish divergence, supporting a breakout.
5. Potential Scenarios
Bullish Breakout:
If Dogecoin breaks above the upper trendline (around $0.2000-$0.2200) with strong volume, it could confirm a bullish breakout.
The first target would likely be the prior high of $0.3000 (a ~67% move from $0.1798). The $5.00 target, while ambitious, would require extraordinary momentum, likely driven by significant market catalysts (e.g., meme coin hype, endorsements, or broader market rallies).
Bearish Breakdown:
If the price fails to break the upper trendline and instead drops below the lower trendline (around $0.1400-$0.1600), it could signal a bearish breakdown.
The next support at $0.0800-$0.1000 could be tested, potentially leading to further downside.
Consolidation:
If the price remains within the triangle (between $0.1600 and $0.2200), it might continue to consolidate until a catalyst triggers a breakout.
6. Market Context
Meme Coin Dynamics: Dogecoin is heavily influenced by retail sentiment, social media hype, and endorsements (e.g., from figures like Elon Musk). The "FATE LOVES IRONY" annotation captures the speculative and ironic nature of Dogecoin’s potential for massive gains despite its meme origins.
Broader Market Trends: Dogecoin often correlates with Bitcoin and Ethereum (as seen in your previous charts). If BTC and ETH break out (e.g., BTC to $120,000, ETH to $4,000), it could create a bullish environment for altcoins and meme coins like DOGE.
Timing: The chart’s position near the triangle’s apex suggests a breakout could occur within days to weeks on a daily timeframe.

Uniswap will reach $135Timeframe : Weekly chart
Price Levels:
The current price is not explicitly labeled, but the chart shows a range from approximately $4 to $6.32 (based on the visible y-axis and the latest candlestick).
The price action spans from a low near $4 in late 2022 to a peak around $6.32 in early 2025, with a correction phase labeled.
Trend Overview:
2022-2023: The price starts around $4 and experiences a gradual uptrend with some volatility, consolidating between $4 and $5 for much of this period.
2024: A sharp upward move occurs, peaking near $6.32, followed by a correction phase.
Early 2025: The price is in a consolidation or correction phase, with the latest candlesticks showing a slight recovery.
2. Key Patterns and Annotations
Descending Triangle:
The chart features a descending triangle pattern, similar to the Ethereum chart you shared earlier.
Upper Resistance: A horizontal resistance line around $6.32 (the recent peak).
Lower Support: A descending trendline (sloping downward) that the price has been testing, currently near $4.50-$5.00.
The price is approaching the apex of the triangle, suggesting an impending breakout (upward or downward).
Correction Phase:
The chart labels a "Correction" phase after the peak at $6.32, where the price retraced to the $4.50-$5.00 range.
This correction likely reflects profit-taking or broader market pressure after the rally.
Breakout Prediction:
An upward arrow is drawn, indicating a potential breakout to the upside, possibly targeting the $6.32 resistance again or higher. This suggests optimism for a significant upward move.
3. Support and Resistance Levels
Support:
The $4.50-$5.00 level appears to be a strong support zone, as the price has bounced multiple times in this range during the correction.
If this support breaks, the next level could be around $4.00 (a psychological and historical support from 2022-2023).
Resistance:
The $6.32 level is a key resistance, marking the recent high. A break above this could signal a continuation of the prior uptrend.
Intermediate resistance might be around $5.50-$6.00, a prior consolidation zone.
4. Volume and Momentum (Not Visible but Inferred)
Volume bars are not clearly visible, but typical behavior suggests:
Volume likely increased during the rally to $6.32 and decreased during the correction as selling pressure eased.
A breakout would need a volume spike to confirm, especially if the price breaks above the descending trendline (around $5.50-$6.00).
Momentum indicators (e.g., RSI or MACD) could help determine if the price is oversold or showing bullish divergence, supporting a reversal.
5. Potential Scenarios
Bullish Breakout:
If UNISWAP breaks above the descending trendline (around $5.50-$6.00) with strong volume, it could confirm the breakout.
The target might be the $6.32 resistance, representing a ~20-25% move from the current $5.00 level, or potentially higher if momentum carries it past the prior peak.
This aligns with the upward arrow and suggests accumulation by larger players (e.g., whales) during the correction.
Bearish Breakdown:
If the price fails to hold the $4.50-$5.00 support and breaks below, it could signal a bearish continuation.
The next support at $4.00 could be tested, potentially leading to further downside.
Consolidation:
If the price remains within the triangle (between $4.50 and the descending trendline), it might continue to consolidate until a catalyst (e.g., market news, volume surge) triggers a move.
