TradeCityPro | Bitcoin Daily Analysis #142👋 Welcome to TradeCity Pro!
Let's get into the Bitcoin analysis. Yesterday, Bitcoin continued its correction and we need to see what is going to happen in the market today.
📅 Daily Timeframe
First, let’s take a look at the higher timeframe. On the daily chart, that curved upward trendline we had was broken by yesterday's candle, and the breakout candle had high volume.
✔️ For now, I don’t consider this trendline as broken and I’m waiting to get confirmation of the break.
🔍 Currently, the price is in a correction phase, and this correction is quite natural since the price had very low volatility for a long time and was stuck below the 120000 zone.
💥 But no trend reversal has occurred yet. In my opinion, as long as the price is above the 110000 zone, the trend is bullish, and I will consider the trend reversal confirmed only if a lower high and a lower low below 110000 are formed.
⏳ 4-Hour Timeframe
Yesterday, the corrective movement of the price continued, and after a pause at the 0.5 Fibonacci level, another bearish leg formed down to the 0.618 zone.
🔔 The RSI oscillator also entered the oversold area and then exited it again. I believe there’s a high possibility that until the end of the week, Bitcoin will range in these areas and the probability of a bullish or bearish move is much lower.
🔽 However, if the 0.618 Fibonacci level breaks, the price can move to lower areas like the 111000 zone. I think the likelihood of this happening in the future is high because that zone is a strong PRZ, and at the same time, it counts as a pullback to the 110000 zone.
📈 In the bullish scenario, if the price is supported from this area and starts to move upward, since we currently have no highs below the 116000 zone, we need to wait until the first bullish leg is formed and then enter on the second leg after the new high is broken.
⚡️ For now, I’m not opening any short or long positions. I prefer the price to form more structure so I can make a more comfortable decision.
❌ Disclaimer ❌
Trading futures is highly risky and dangerous. If you're not an expert, these triggers may not be suitable for you. You should first learn risk and capital management. You can also use the educational content from this channel.
Finally, these triggers reflect my personal opinions on price action, and the market may move completely against this analysis. So, do your own research before opening any position.
Cryptomarket

TradeCityPro | Bitcoin Daily Analysis #143👋 Welcome to TradeCity Pro!
Let’s dive into the Bitcoin analysis. Today, the weekly candle will close and the market will return to its normal condition starting tomorrow. It’s very important to have a solid analysis today so we can make profits in the upcoming week.
⏳ 4-Hour Timeframe
Yesterday, Bitcoin had another short drop and wicked down to around the 111747 zone, but then returned above the 0.618 Fibonacci level.
💥 Even from this timeframe, it’s clear that a long trigger has formed on lower timeframes, and it seems like a V-pattern is being formed, which we’ll analyze in the lower timeframes.
📊 If the market activates the long trigger today, I’ll try to enter so I don’t miss out in case a bullish move starts with the new weekly candle and I can have an open position.
✔️ The RSI oscillator also entered the oversold zone yesterday and exited it. Since Bitcoin is still above the 110000 zone, I still view the trend as bullish. So this double bottom that formed on the RSI is a very good sign for bullish momentum in the market.
⏳ 1-Hour Timeframe
In the 1-Hour timeframe, we had a short trigger at the 114560 zone in the previous analysis, which was activated and the price moved down. I had mentioned in that analysis that I wouldn’t open a short position with this trigger, and I didn’t.
🔽 Now the position of that trigger has shifted and moved to the 114028 zone. Today I’m watching the market closely, and if the price moves up toward this trigger with increasing volume, I’ll open a long position if 114028 breaks.
🔍 This is one of those positions where you can use either a small or large stop loss. If you go with a larger stop, you can ride the next bullish leg that may push the price back toward the 120000 zone. But if you go with a smaller stop, it becomes a short-term trade that will be closed with smaller risk-to-reward ratios.
📈 Personally, I prefer to go with a larger stop loss so that if Bitcoin starts another bullish leg, I can have a well-positioned entry. (Just make sure to practice proper risk management — I personally won’t risk more than 0.25% on this position since the main momentum hasn’t entered yet.)
💫 As for short positions, I won’t provide any triggers for now because I’m not opening shorts myself, and if you open one, I won’t be able to guide you on what to do with it.
❌ Disclaimer ❌
Trading futures is highly risky and dangerous. If you're not an expert, these triggers may not be suitable for you. You should first learn risk and capital management. You can also use the educational content from this channel.
Finally, these triggers reflect my personal opinions on price action, and the market may move completely against this analysis. So, do your own research before opening any position.

Winter is coming!This idea reflects the beggining of the bear market phase. Just wait patiently around 400 days to start scooping again like a maniac. Dont listen to the Maxis, instead use a plan like this one to remove emotions and buy more sats with less capital.

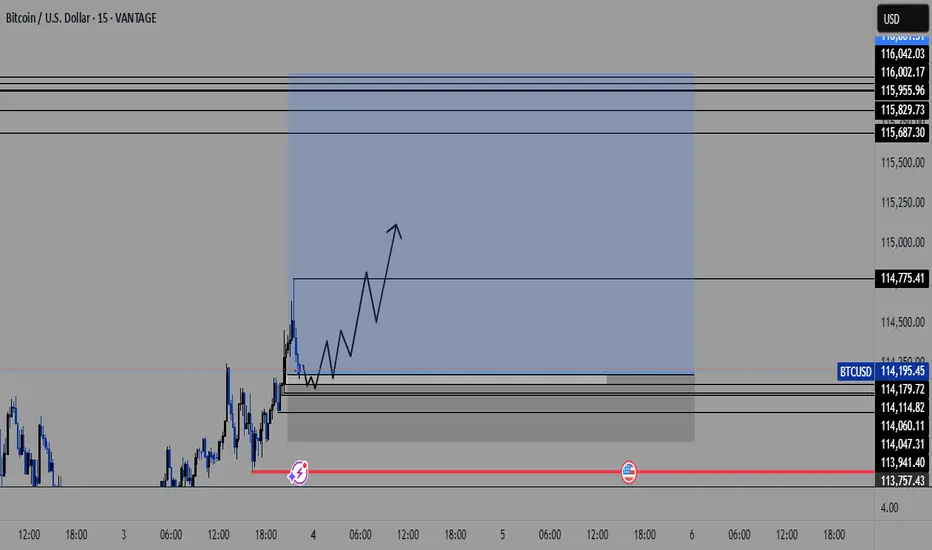
Bitcoin to $116K in a Week? Here's the Case Everyone's IgnoringI know it sounds wild — but hear me out.
BTC is primed for something massive, and the ingredients are all on the table:
✅ ETF inflows are quietly stacking
✅ Supply shock post-halving is still underestimated
✅ DXY weakening = flight to hard assets
✅ Global uncertainty = Bitcoin safety bid
✅ Technicals pointing to a breakout above ATH with no resistance until $100K+
We're seeing the early signs of parabolic structure forming — and if volume confirms, this could move fast. Everyone thinks a 2x in a week is impossible... until it isn't.
Not saying it’s guaranteed — but if you've been around long enough, you know BTC doesn’t move linearly.
👀 Watch the $72K breakout zone closely. If it flips with conviction and volume, $116K is not out of the question.
Drop your charts. Agree or disagree?
BTC Hits Premium Zone – Bearish Reversal Loading? BTC Hits Premium Zone – Bearish Reversal Loading?
🧠 Technical Breakdown:
🔹 1. Previous Market Structure & CHoCH
The chart shows a clear shift in structure (CHoCH) on the left, which marked the start of the bearish leg.
Break of Structure (BOS) confirms continuation of lower highs and lower lows until recent liquidity grab near the $112,551 zone.
Equal highs and liquidity above were taken out, making the move into the Premium Order Block zone highly significant.
🔹 2. Liquidity and Fair Value Gap (FVG) Zones
A major Liquidity + FVG zone was left unmitigated between $113,000–$112,000, and price is likely to revisit it.
This aligns with the target zone at $112,890, which is highlighted as a magnet for price to rebalance the inefficiency.
🔹 3. Order Block & Premium Supply Zone
A well-defined Order Block is marked just below the resistance zone near $115,166–$116,021.
Price is currently retracing into this zone, suggesting a potential reaction point for smart money to re-enter shorts.
Volume is expected to pick up here, and a reversal could initiate if price fails to break above this supply.
🔹 4. Volume Profile and Market Imbalance
Volume clusters are heaviest near the $114,000–$114,300 range, indicating high activity and previous accumulation/distribution.
Thin volume near the $112,551 zone further confirms price may drop quickly if rejection happens.
🔹 5. Support & Liquidity Sweep
Support zone around $112,551 is a previous liquidity pool and weak low that has not been fully cleared.
Price is likely to revisit this zone in the short term to clear liquidity and complete market rebalancing.
🔐 Institutional Narrative:
Smart money engineered a liquidity sweep to the downside, then caused a retracement into premium.
Now, BTC/USD is positioned in a high-risk zone where sell-side institutions may enter to push price lower.
If this order block holds, expect a rejection toward $112,890, followed by possible deeper continuation into the liquidity void below.
📌 Key Levels:
Level Price (USD)
Strong Resistance Zone 115,166 – 116,021
Order Block (Sell Area) 114,800 – 116,000 (approx.)
Immediate Support 113,000 – 112,551
Target (Liquidity Zone) 112,890
Weak Low (Final Sweep) 112,000
📉 Trade Outlook & Strategy:
🔺 If price reacts bearishly at Order Block:
Look for lower timeframe BOS/CHoCH confirmation.
Entry: Short on rejection at or near $115,000–$115,500
Target 1: $112,890
Target 2: $112,000 (extended liquidity sweep)
Stop-loss: Above $116,200 (invalidates bearish OB)
🔻 If price breaks and closes above $116,021 with momentum:
Structure flips bullish, and the OB is invalidated.
Look for long setups on retracement to $114,000 zone.
🧭 Conclusion:
BTC/USD is currently trading within a Premium Zone, testing a strong Order Block below key resistance. Price may face a bearish reaction, targeting the liquidity zone at $112,890. Smart money footprints suggest a potential trap for breakout buyers, and if momentum fades, we can expect a downside reversal to sweep remaining liquidity.

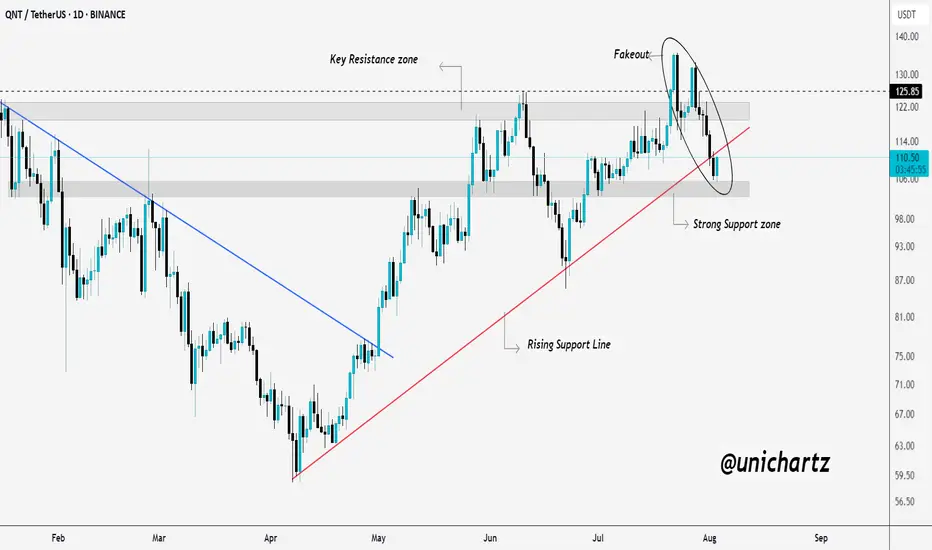
QNT Price Action Heating Up at Critical ZoneGETTEX:QNT attempted to break above its key resistance zone but ended up creating a fakeout, trapping late buyers at the top.
The sharp rejection dragged the price back down toward a strong support zone, which also aligns with the rising trendline.
This area is now a key decision point, if the price holds, a bullish reversal could follow. But if it breaks below, further downside is likely. This level will define QNT’s next major move.
DYOR, NFA
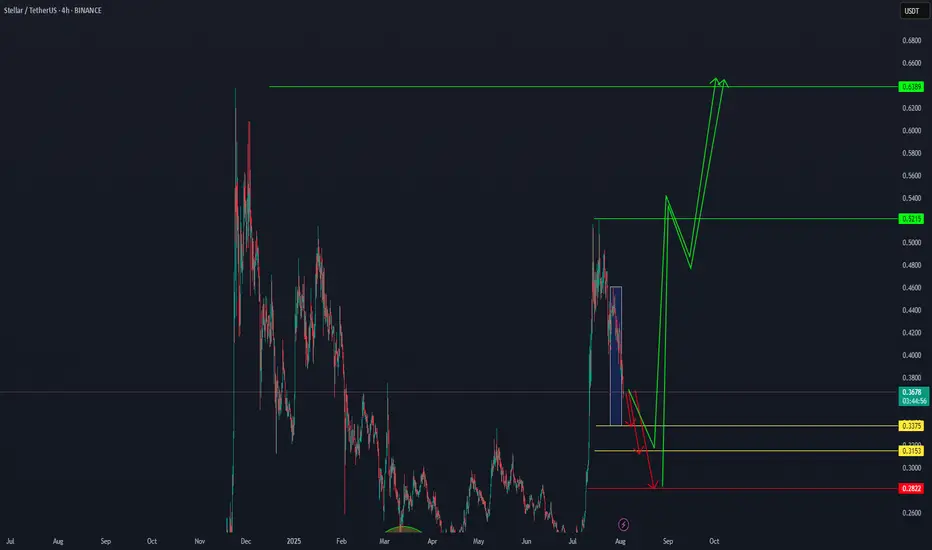
"Stellar XLM will definitely reach 0.6389."" Stellar (XLM) is expected to begin its upward move from the price zones of 0.3375, 0.3153, and 0.2822, heading toward the confirmed targets of 0.5215 and then 0.6389.
While the exact starting point may vary slightly, the targets at 0.5215 and 0.6389 are considered certain." BINANCE:XRPUSDT
BTC at Make-or-Break: Rejection or Liftoff to $130K?
Bias/Summary
BTC is at a critical zone between 109K–112K. Price is currently showing hesitation after initial rejection at the Yearly L3 (112K), and I’m leaning short unless we see a strong breakout and hold above that level. However, if bulls reclaim it, we could see a fast move to 130K before many can react.
Technical Context:
Yearly L3 sits around the $112K zone – a historically significant level.
Price faced rejection at $112K and is now hovering near $109K.
Lower timeframe showing indecision, possible bearish bias.
Watching for:
Rejection + lower high below $112K = short setup.
Clean breakout + retest of $112K = shift to long bias.
Trade Idea / Setup:
🟥 Scenario A – Short Bias (Current Leaning):
Entry: 110K–111.5K (if rejection confirms)
Stop Loss: Above 112.5K
Targets:
TP1: 104K
TP2: 99K
TP3: 94K
R:R: Up to 3.5:1 depending on entry and target
🟩 Scenario B – Breakout Long (Contingent Setup):
Entry: 113K+ (after breakout and solid retest)
Stop Loss: Below 111K
Targets:
TP1: 120K
TP2: 130K
R:R: ~3:1 or more if momentum confirms
Risk & Patience Reminder:
⚠️Let price lead. No breakout = no long. No clear rejection = no short. Wait for confirmation, and don’t force entries in the chop.
Patience > Prediction.
NFA. DYOR. Manage your risk.

From Euphoria to Exhaustion – BTC's Next Move?BTC Idea – Bearish Divergence + Key Level Watch ⚠️
Summary / Bias:
BTC has tapped 120K and is now showing early signs of weakness. A bearish divergence on the MACD Histogram (weekly) is flashing caution, while price has retraced back to the critical 112K zone. I'm leaning bearish short-term, expecting a move towards 100K, and possibly as low as 93K, if key confirmations unfold.
Technical Context:
Weekly MACD Histogram shows a clear bearish divergence, signaling potential exhaustion.
BTC rejected from 120K and has pulled back to 112K.
Price crossed below the Yearly Camarilla L#, but we need a weekly close below to confirm further downside.
112K remains the key pivot – failure to bounce strongly here could open the door for deeper retracement.
Scenarios to Watch:
🟥 Bearish Continuation (Primary Bias)
Breakdown and close below 112K
Downside targets:
TP1: 100K
TP2: 93K
🟨 Neutralizing Risk
Hold above 112K with strong bounce = neutral bias, reassess
Close back above 115K+ with strength = invalidate bearish lean
Caution & Patience:
Now is not the time for aggressive longs. Signs of exhaustion + major level retest call for defensive positioning and high-quality setups only. Let confirmation guide entries.
NFA. Risk management always.
Will update if structure shifts.
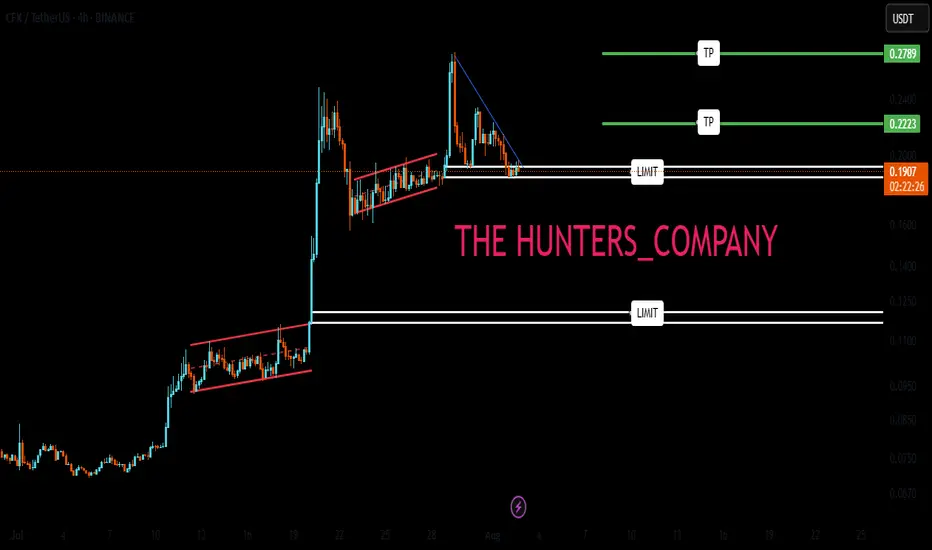
CFX : don't be afraidHello friends🙌
If you take risks, you will win. If you don't, you will regret it.
✅Given the good price growth, now that the price is in a correction phase, there is a good opportunity to buy with risk and capital management, of course, at the specified support levels and move with them to the set targets.
🔥Follow us for more signals🔥
*Trade safely with us*
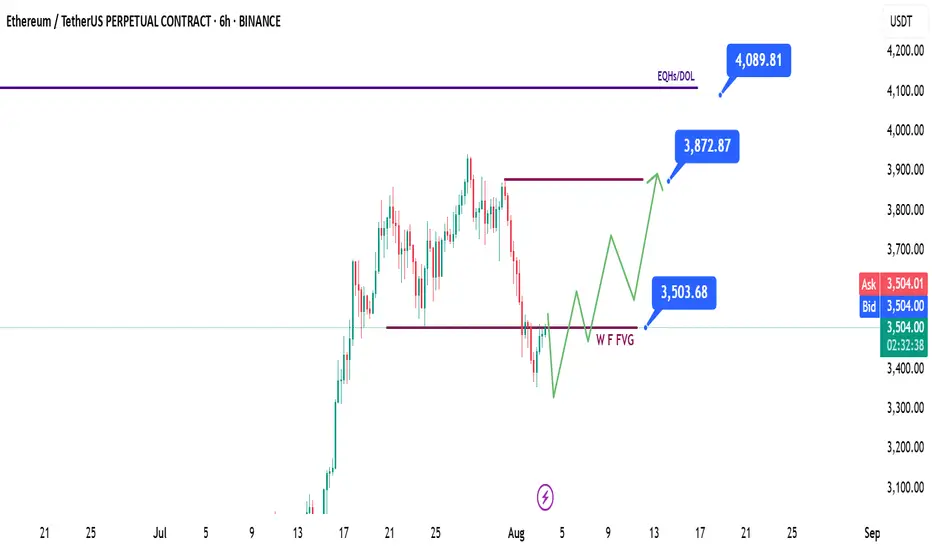
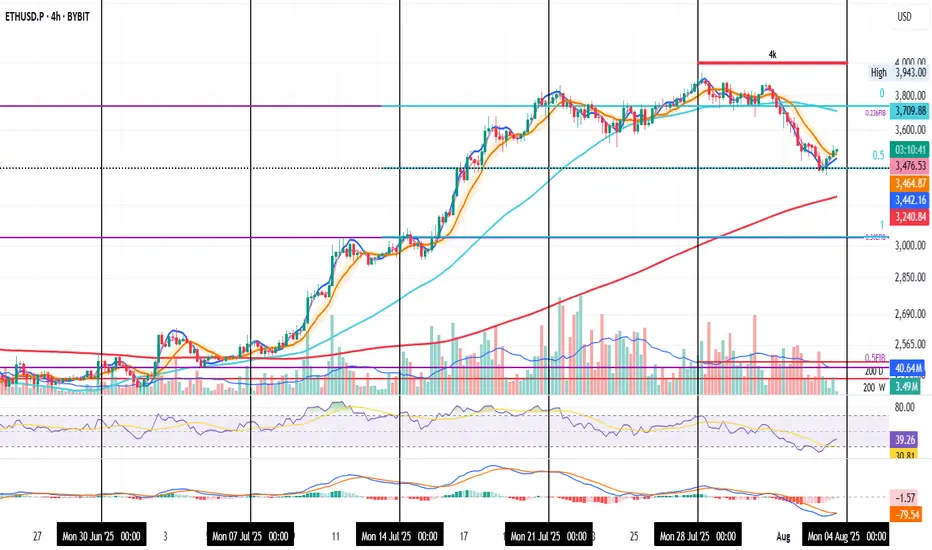
ETH | Ethereum - Weekly Recap & Gameplan - 03/08/25📈 Market Context:
Traders are currently anticipating a potential 0.25% rate cut at the September FOMC meeting, which continues to support the broader bullish outlook.
While the market pulled back following weaker-than-expected Non-Farm Payroll data, overall sentiment remains optimistic.
Greed has cooled off into a more neutral stance. Historically, August often brings some consolidation or pullbacks — but the structural bias for crypto market remains bullish.
🧾 Weekly Recap:
ETH started the retracement movement after building a bullish trend over the past couple of weeks.
It’s mainly being affected by Bitcoin's bearishness, so we’re closely following BTC’s price action.
ETH has tapped into the Weekly Fair Value Gap, which is a key level for me.
We may see a bounce from here.
📌 Technical Outlook & Game Plan:
I expect to see another low on ETH before we go up — as I’m also anticipating one more leg down on Bitcoin.
So I’ll wait for a final bearish expansion and a trap for late sellers before positioning for longs.
After that, I want to see price closing above the purple line at $3500.
🎯 Setup Trigger:
A candle close above the $3500 level will be my signal to look for long setups.
📋 Trade Management:
Stoploss: Below the swing low that breaks above $3500
Take Profit: Targeting $3870, but will trail and lock in aggressively in case of deeper downside expansion.
💬 Like, follow, and comment if this breakdown supports your trading! More setups and market insights coming soon — stay connected!
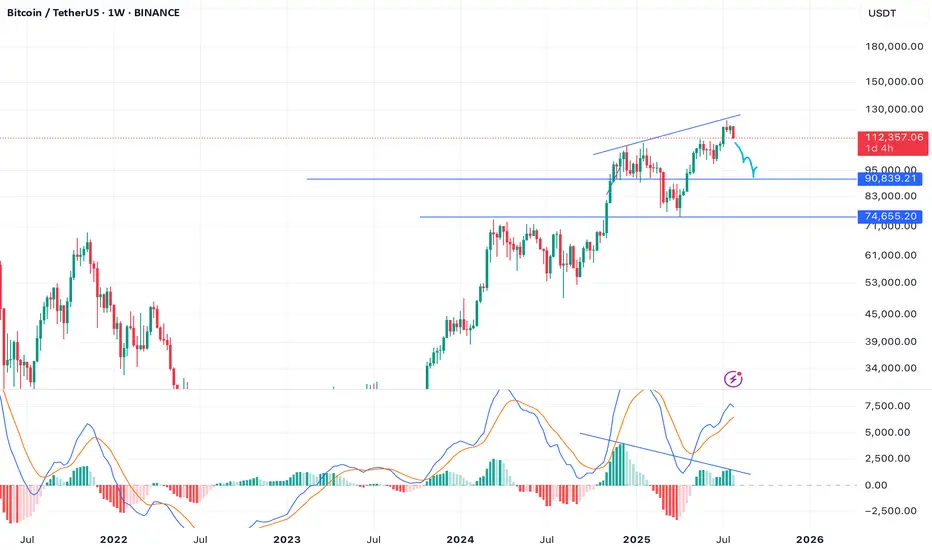
"When the sea retreats and whispers low through Gaussian"This time we are going to talk about the neck of the Bull Markets tops. "IF" I nailed it predicting the top ~ 123k we might start talking about the neck of the hill around the 0.236 Fib level. This could be the next target for Bitcoin in the coming months around 76K(yellow zone). Once the 1000 days of green above Gaussian ends we might see the biggest drops of the bear market bottoming around the 0.5 fib level in the lows 40k usd.

MAGIC : Magic is neededHello friends🙌
📈Given the good rise we had, the price is now in the ascending channel, now in the specified support areas, you can buy in steps with risk and capital management and move to the specified targets.
🔥Follow us for more signals🔥
*Trade safely with us*

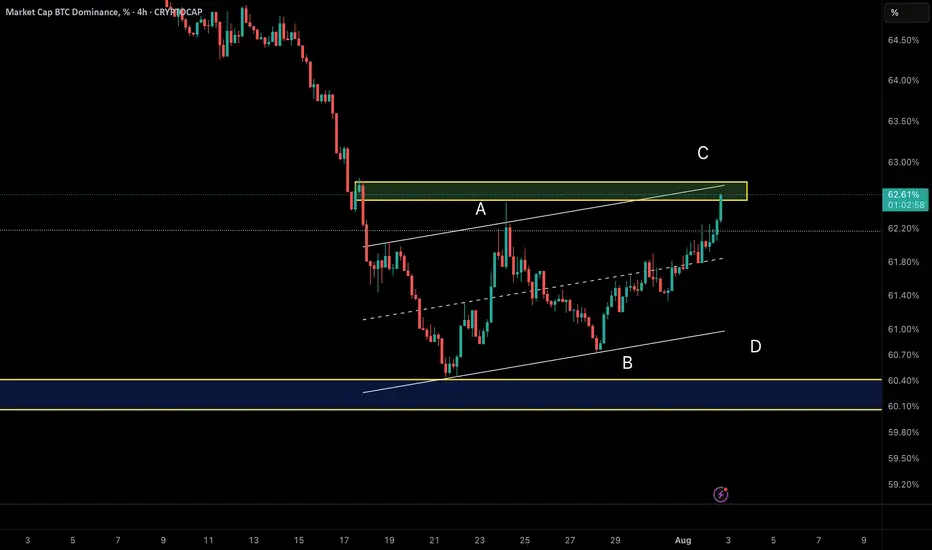
Smart Money Watching BTC Dominance – Rotation to Alts IncomingAfter a deep correction, BTC Dominance has entered a corrective upward phase inside an ascending channel.
Wave A rallied from 60.5% to 62.3%, followed by Wave B retracing to 60.74%.
Currently, Wave C is developing and has reached around 62.2%.
The key resistance sits near 62.7%, exactly at the upper trendline of the channel. This could act as a reversal point, potentially ending Wave C and triggering a bearish move.
💡 Implication:
If dominance drops from this zone, we could see capital rotation into altcoins, supporting a bounce across the broader altcoin market.
EPIC : Risky signal...Hello friends🙌
🔊Due to the good price growth, we have found important support points for you.
Now, due to the price correction, we have found buy points for you and you can buy with risk and capital management and move with it until the goals we have set for you.
🔥Follow us for more signals🔥
*Trade safely with us*

ETH 4H Mid-Zone BounceETH on the 4H
ETH found support right at the midpoint between the 0.382 and 0.236 Fib levels — exactly at yesterday’s close.
Price closed above the BB center, and the SMA is also holding above it — early signs of recovery.
RSI formed a double bottom in the oversold zone and has now crossed above its moving average.
MACD is about to flip bullish.
I remain bullish and still holding my long, but with tight risk management.
Always take profits and manage risk.
Interaction is welcome.
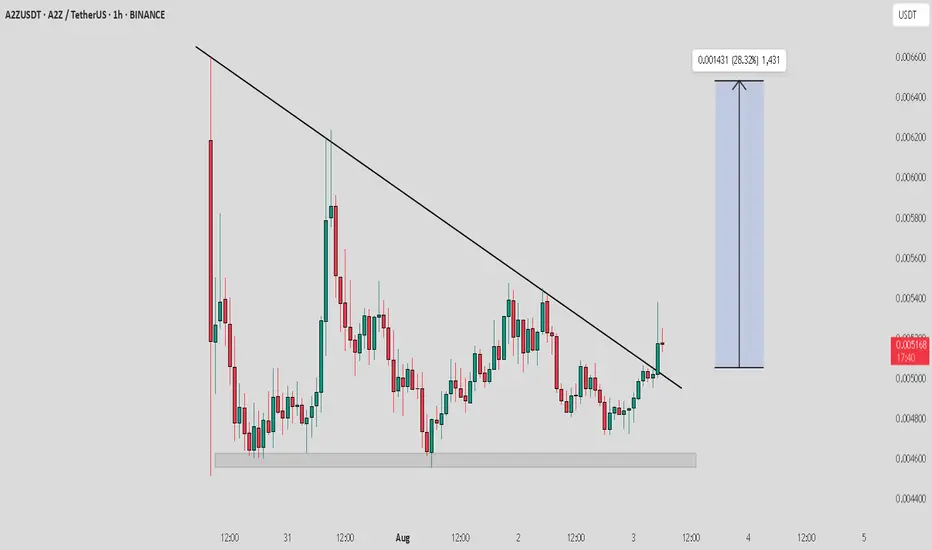
A2Z / USDT : Keep a close watch on retest proccessA2Z/USDT has broken out of a key trendline resistance and is now retesting the breakout zone.
This retest phase is critical — a successful hold here could trigger a sharp bullish move of 20-30% in the short term.
Volume confirmation and strong bullish candle on lower timeframes will add more confidence.
Keep it on your radar — next move could be quick.
DOGEUSDT Technical Analysis – Bullish Reversal Anticipated DOGEUSDT Technical Analysis – Bullish Reversal Anticipated
🔍 Key Technical Zones:
Support Zone: $0.1990 – $0.2015
Strong bullish reactions noted from this level in previous attempts.
Confluence with volume accumulation on the left (as seen in the Volume Profile).
Signifies a strong demand zone where buyers are stepping in.
Resistance Zone / Target: $0.2220 – $0.2240
Previous structural high and supply zone.
Marked as the first major liquidity area.
Also aligns with imbalance and CHoCH (Change of Character), a common SMC concept.
🔄 Market Structure:
CHoCH (Change of Character) marked multiple times, indicating attempts by bulls to reclaim structure.
Recent price action shows accumulation near support.
Sideways consolidation suggests potential for a bullish breakout.
Liquidity sweep of recent lows could indicate that smart money is accumulating positions before a move higher.
🎯 Trade Setup Idea:
Entry Area: Between $0.2000 – $0.2060 (inside the support zone)
Target: $0.22396 (as marked)
Stop Loss: Below $0.1980 (below the visible support range)
🔧 Indicators and Tools Used:
Volume Profile (VRVP): Shows most volume traded around $0.205 – $0.207, indicating strong positioning from market participants.
Smart Money Concepts (SMC): CHoCH and liquidity concepts signal potential accumulation and reversal.
Price Action Analysis: Clean swing structure with support-resistance rotation visible.
📌 Conclusion:
DOGEUSDT is currently trading in a range-bound structure with a bullish bias from the support zone. If the price sustains above $0.205 and breaks above minor resistance, the upside target of $0.22396 is likely. This setup is supported by strong volume accumulation and smart money structure shifts.

XLMUSDTXLMUSDT From the specified range (of course, now) it should reach the price of 0.5169, in the middle of the way it will correct at the price of 0.3755 and then it will rise towards the target, this is certain
Market geometry is right

ERA : Risky but profitableHello friends🙌
Given the high that has been made and the price has returned, there is a possibility that the price will correct to the middle of the move, which is why we have provided two buying levels for you, which you can buy with risk and capital management and move towards the specified goals.
🔥Follow us for more signals🔥
*Trade safely with us*

OMNI : Will it happen again?Hello friends🙌
✅As you can see, everything is clearly and explicitly drawn for you.
✅Just pay attention to risk and capital management for trading and if you like, support us.
🔥Follow us for more signals🔥
*Trade safely with us*

ETH Price Weakens: Watching This Strong Demand Zone Closely$ETH/USDT Analysis (12H)
Ethereum has broken below a key support zone, confirming short-term weakness in price structure.
At the same time, the RSI is showing bearish divergence, signaling slowing momentum while the price was making higher highs — a classic early warning of a potential drop.
Now all eyes are on the strong demand zone below. If ETH finds support there, we could see a solid bounce or even a full trend reversal. But if this zone fails, deeper correction may follow.
DYOR, NFA
Thanks for the reading

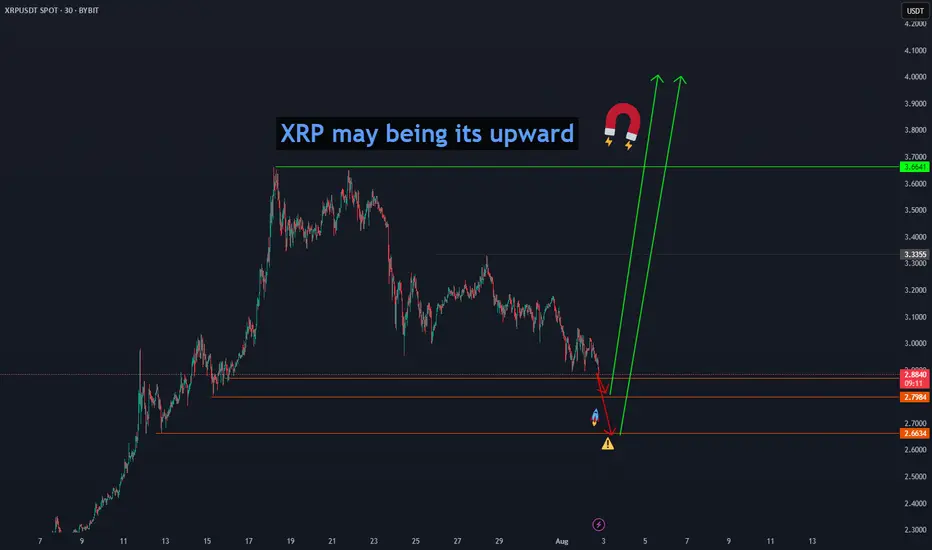
XRP may being its upward" Ripple (XRP) may begin its upward move from the price levels of 2.8865, 2.7984, and 2.6634, aiming for a first confirmed target at 3.6641 and then $4." BINANCE:XRPUSDT